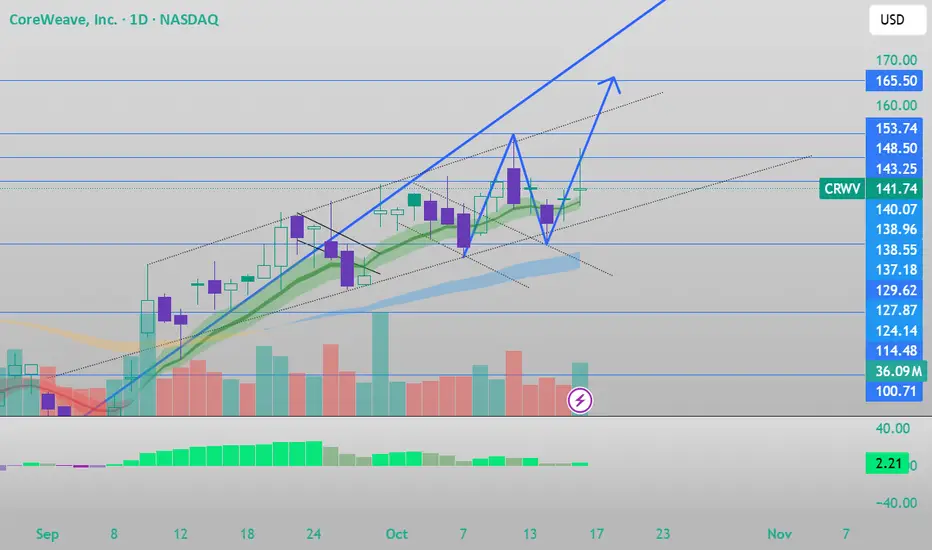
CRWV breakout and retestOn daily it break out the bull flag and retest the flag, Soon it will touch down the $165 NASDAQ:CRWV
Trade ideas
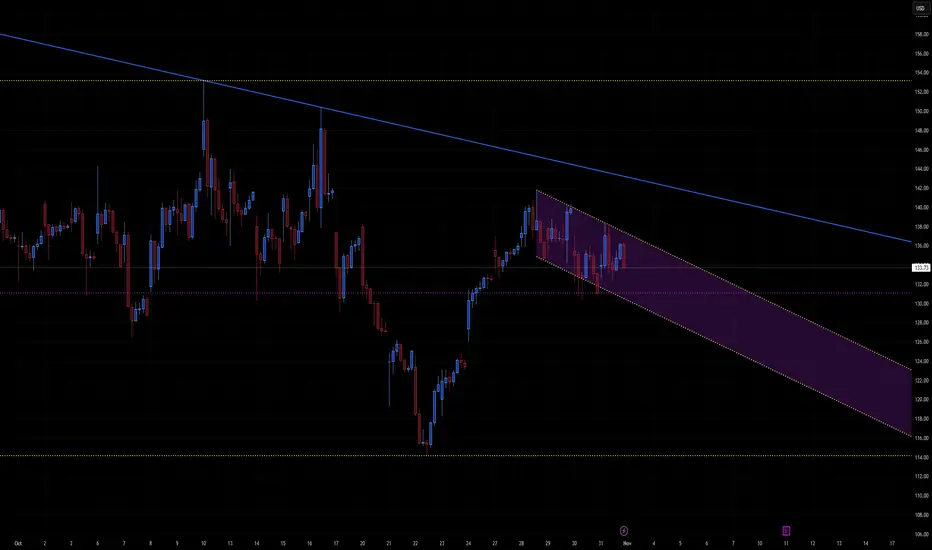
CRWV where does the breakout of this channel occur?A descending parallel channel (purple shaded region) starting from the recent local high.
Current price near 133.7 USD, trading mid-channel.
Major horizontal supports around 130 and 116 (yellow dotted lines).
Overhead resistance near 138–140 USD and the top of the falling channel (~136–137 USD short-term).
This indicates controlled pullback within a bearish channel after a strong prior rebound — a typical flag pattern structure, which can resolve in either direction.
📈 Bullish Scenario
Setup:
Price has stabilized inside the descending channel and could stage a rebound if momentum returns.
Confirmation Triggers:
Break and daily close above 136–138 USD (channel breakout).
Volume pickup confirming accumulation rather than short covering.
Upside Targets:
144–146 USD → short-term resistance zone (top of previous consolidation).
150–154 USD → major target and measured-move projection from the flag pattern.
Catalysts:
Broader market risk-on sentiment (tech rebound, softer yields).
Positive company-specific or sector news.
Invalidation:
Daily close below 130 USD, re-entering lower half of channel.
📉 Bearish Scenario
Setup:
If price keeps respecting the descending channel and fails to reclaim 136–138 USD, the downtrend continues.
Confirmation Triggers:
Breakdown below 130 USD (support + midpoint of channel).
Bearish continuation with increasing volume.
Downside Targets:
122–124 USD → lower channel boundary (first logical support).
116 USD → key horizontal support and measured-move objective.
108–110 USD → extended bearish target if momentum accelerates.
Catalysts:
Market rotation out of growth / risk assets.
Rising yields or stronger dollar.
Invalidation:
Break and sustained close above 138 USD.
⚖️ Neutral / Range-Bound Outlook
Until price escapes 130–138 USD, expect choppy sideways trading within the channel.
Momentum indicators (RSI, volume) likely to flatten, signaling indecision before a larger move.
🧩 Summary Table
Bias Confirmation Target Zone Invalidation Notes
Bullish Close > 138 USD 144 → 150 → 154 USD < 130 USD Breakout of flag
Bearish Close < 130 USD 122 → 116 → 110 USD > 138 USD Continuation down
Neutral Range 130–138 USD — — Coiling phase
🕒 2–3 Week Projection
Bullish path: Price stabilizes 132–133 → breaks above 136 → targets 144 by mid-November.
Bearish path: Rejection at 136 → slips below 130 → tests 122–124 within next two weeks.
$CRWV Final Plan Daily is looking good. Monthly as well. Weekly, and everything. Please visit my previous post for more detail. Thank you.

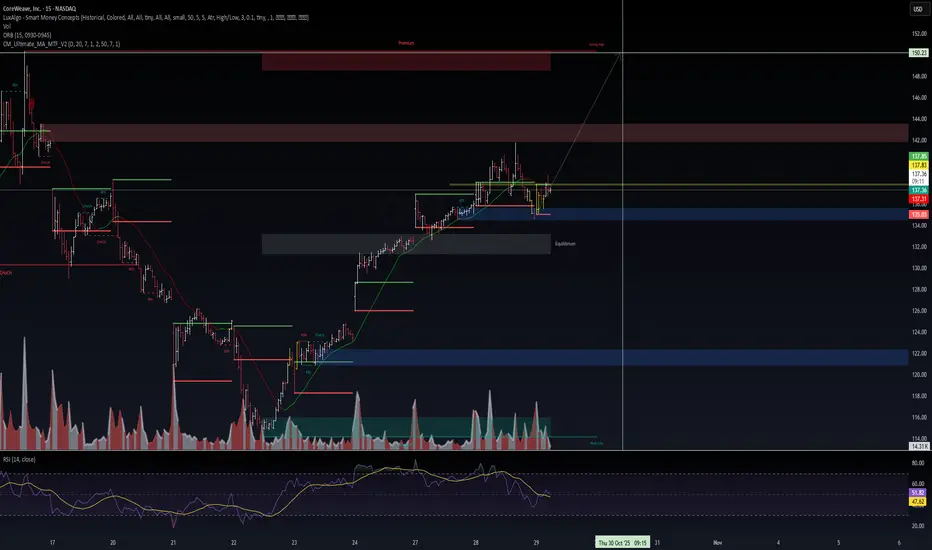
$CRWV: Happy Halloween!🦇 NASDAQ:CRWV | Critical Zone Ahead – Gap Fill or Fade? ⚙️
Back from the shadows.
Held my ground, refilled, recharged.
Now we’re approaching the critical zone — 135.9 to 139.1, the line between continuation and rejection.
Trendline break confirmed. Liquidity reclaim in motion.
If bulls defend 135.9, the gap fill toward 139+ could ignite fast —
fail here, and the vampires feast below equilibrium again.
Halloween vibes: fangs out, risk tight.
Let the market decide who bleeds first.
#CRWV #VolanX #WaverVanir #AITrading #SmartMoneyConcepts #LiquidityReversal #Stocks #MomentumShift #Halloween #VampiricSetup

$CRWV | Institutional Buy Signal Confirmed — DSS Sees a 61% Upsi⚙️ NASDAQ:CRWV | Institutional Buy Signal Confirmed — DSS Sees a 61% Upside Runway 🚀
While the market debates direction, CoreWeave’s structure, volume, and model consensus are quietly aligning for a potential multi-week rally.
📊 VolanX DSS + Institutional Forecast Fusion:
Current Price: $134.63 – $139.93 range
Institutional 30-Day Target: $149.53 (+11.1%)
VolanX DSS 15-Day Prediction: $173.73 (+24.2%)
VolanX DSS 30-Day Projection: $225.67 (+61.3%)
Model Agreement: 9/9 bullish alignment
Confidence Level: 100 %
Sharpe Ratio: 2.20 (strong risk-adjusted return)
Prediction Volatility: 12.6 % → stable yet explosive potential
🧠 VolanX Technical Context (15m–1H Confluence):
Current equilibrium zone: $131.8 – $134.8
Key premium breakout level: $138.7 → above triggers next leg to $149 → $158 → $225
Fibonacci 0.786 (136.0) = current accumulation zone
RSI 40–50 → neutral but forming hidden bullish divergence
Volume contracting → compression coil phase before breakout
🎯 VolanX DSS Playbook:
Position in the equilibrium zone ($132–135).
Hold through November — AI forecast expects parabolic expansion through early December.
Profit targets:
• $149 (institutional target)
• $173 (VolanX 15-day)
• $225 (VolanX 30-day)
Macro Correlation:
CoreWeave rides the AI + Data Center Infrastructure theme.
With yields stabilizing (~4.1 %), liquidity rotation into next-gen compute infrastructure stocks continues — NASDAQ:NVDA , NASDAQ:SMCI , NASDAQ:CRWV leading the pack.
VolanX DSS Probability Matrix:
🟩 Bull 70 % 🟨 Neutral 20 % 🟥 Bear 10 %
“When AI, institutions, and price all agree — volatility becomes opportunity. The setup is loaded.”
#CRWV #WaverVanir #VolanX #AITrading #SmartMoney #InstitutionalFlow #Liquidity #TechStocks #AIInfrastructure #NVDA #SMCI #Bullish
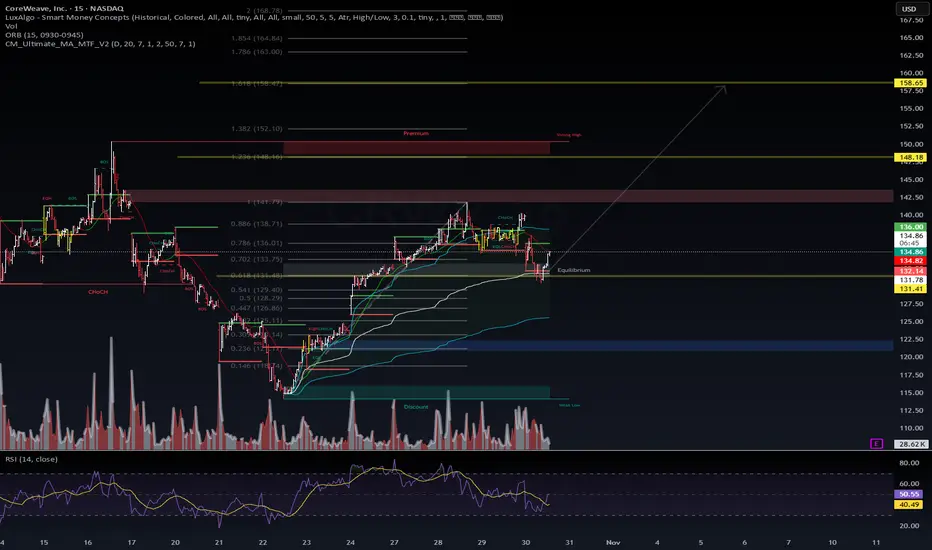
$CRWV | Liquidity Coil Before Breakout⚙️ NASDAQ:CRWV | Liquidity Coil Before Breakout 🚀
VolanX DSS detects a high-probability setup forming between 137–138, with major confluence ahead at 144–145 — aligning with key Fib extensions and structural pivots.
🧠 Structure Insight
Equilibrium support at 135.00
Confirmation zone above 138.15
RSI neutral (~52) — coiling for directional move
Target zone: 151–152 (liquidity extension)
📊 VolanX Probability Matrix
🟩 Bull (65%) → breakout → 144 → 151.80
🟨 Base (30%) → consolidation 135–139
🟥 Bear (5%) → failure under 135
🎯 Macro Edge:
AI liquidity rotation continues. Watch NVDA/SMCI momentum — GPU demand correlation remains a tailwind into Nov 3–5.
💡 “Major confluence. Structure aligned. VolanX eyes the breakout.”
#CRWV #VolanX #AITrading #Liquidity #SmartMoneyConcepts #WaverVanir

CRWV: Watching the play. Bulls must defend this region. Let's see if we build a support here before rocketing higher. I will be in observation until next week.

$CRWV | Liquidity Compression Before ExpansionCoreWeave is coiling for a high-volatility breakout — and the structure looks primed for a premium sweep into the $150 range.
🧠 VolanX DSS Context
Structure: Higher-low sequence holding above equilibrium
Smart Money Concepts: Last CHoCH flipped bullish at $135, now forming BOS confirmations
Volume Profile: Institutional activity clustered around $135-$137 (re-accumulation zone)
RSI: Reset near 50 — momentum ready to reload
Liquidity targets: $142 → $150
🌐 Macro Catalyst Edge
Nvidia ( NASDAQ:NVDA ) & AI infrastructure names leading the charge
Cloud-compute CAPEX accelerating (CoreWeave, Supermicro, TSMC pipeline)
If liquidity rotation continues, NASDAQ:CRWV becomes the high-beta AI play to watch
🎯 Trade Probability Matrix
🟩 Bullish Scenario (65%) → $142–$150
🟨 Neutral Scenario (25%) → $135 retest before expansion
🟥 Bearish Scenario (10%) → Breakdown only if $134 fails
⚙️ VolanX DSS Bias: LONG — structure is clean, liquidity poised.
We don’t chase candles. We anticipate liquidity shifts.
#CRWV #AI #Liquidity #SmartMoney #VolanXDSS #WaverVanir
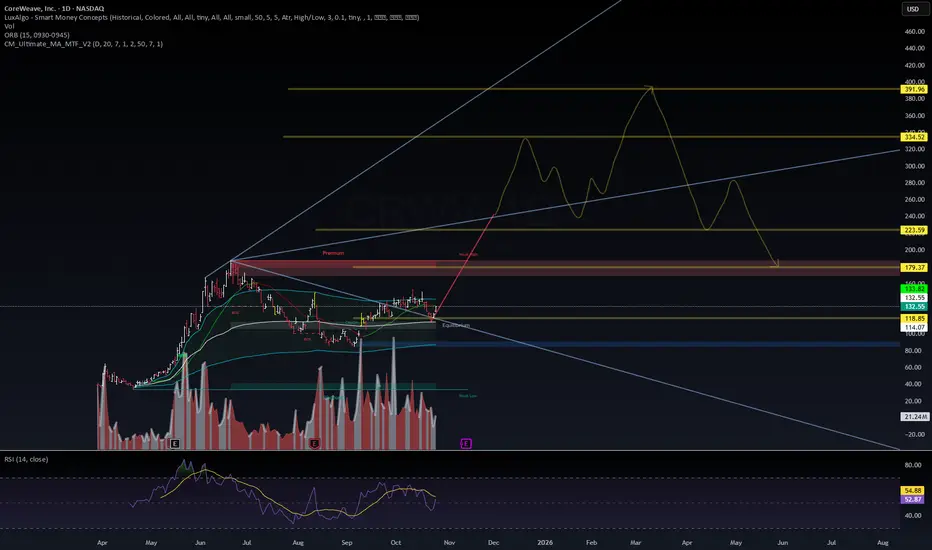
COREWeave Up to $300 rangefirst run up to 185, down to 83, extension up from there for wave 3 puts us in $300 range in coming months. Messy chart, just publishing for myself later

CRWV eyes on $134.74: proven Golden Genesis fib the KEY supportCRWV recovery wave is at a very important stage.
Now trying to launch from Golden Genesis at $134.74
Looking for a new ATH from here, stop loss just below.
.
See "Related Publications" for previous plots such this EXACT BOTTOM call:
Hit BOOST and FOLLOW for more such PRECISE and TIMELY charts.
=========================================================
.
CRWV LongReasoning:
PB to rising 50MA, swing trade
Strong industry
Swing Traders (2-6 Week Holds)
Buying rule : Watch out for a buy stop, this helps avoid fake moves!
Entry: Full position on breakout
Profit Taking: Sell 1/3 at Goal 1
Final Exit: Remainder at Goal 2
Selling is done partially because we never know what is going to happen, so sell as money goes in your favor - Mark Douglas

I've continuously been receiving alerts about insider selling...For the last few weeks, I've continuously been receiving alerts about insider selling like crazy. Nothing similar happened with any other stock I follow. I wouldn't be surprised if the red line came true, but wouldn't that drag down a lot other AI-related stocks?

$CRWV | CoreWeave Inc. — Multi-Model Signal Update🚨 CRWV | CoreWeave Inc. — Multi-Model Signal Update
📅 Oct 25 | VolanX DSS v3.x + Institutional Forecast v2.0
🧠 Models in Conflict – Sentiment vs Institutions
VolanX DSS (Sentiment Score 36): Bearish → $73.57 (-44.5%) in 30 days
Institutional Model: Bullish → $165.09 (+24.55%) target
Technical (SMC + LRG): Reclaim > $133 = bullish phase activation
📊 VolanX Meta-Blend Result: 🟢 Moderately Bullish (63 % prob.)
🎯 Expected range next 30 days: $125 – $165
⚙️ Key Levels: Support $118 / Resistance $165 → $179
📈 Watch for volume expansion and RSI > 60 to confirm leg 2 breakout.
💬 Volatility ahead — DSS detects liquidity compression, while Institutional flow suggests rotation back into AI infrastructure names ( NASDAQ:NVDA / NASDAQ:SMCI / NASDAQ:AMD correlated).
#CRVW #VolanX #AITrading #SmartMoney #WaverVanir #Quant #AIStocks
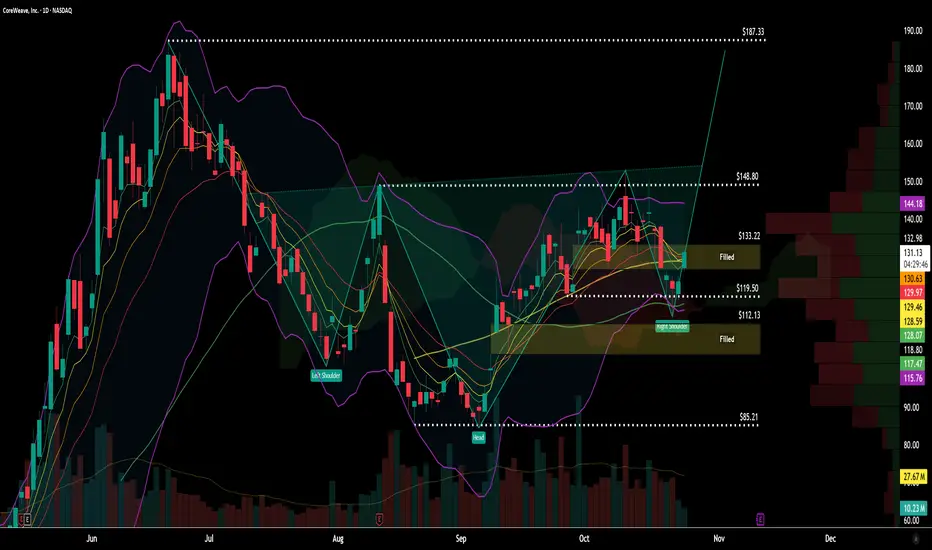
$CRWV – Post-IPO Structure & Complex Kilroy Bottom FormationAfter its IPO, CoreWeave ( NASDAQ:CRWV ) exploded from $39 to $187, marking an impressive +380% gain in just a few months. However, following two missed earnings reports, sentiment cooled, leading to a broad retracement and multi-month consolidation. The upcoming earnings release could prove pivotal for the stock’s next major directional move.
Daily Chart Structure
On the daily timeframe, NASDAQ:CRWV has printed what appears to be a Kilroy bottom (complex inverted head-and-shoulders variant), though with an unusually complex structure — featuring two heads and two right shoulders.
The first head triggered a strong rally that faded quickly.
The second head formed a slightly higher low, maintaining bullish divergence.
The second right shoulder extended lower to search for liquidity, tagging the top of the early September breakaway gap before rebounding.
This secondary right shoulder also coincides with the lower Bollinger Band and Ichimoku cloud support, adding structural confluence.
Gap Behavior & Market Sentiment
Both prior gaps were filled rapidly, suggesting weak follow-through during prior upswings — a sign of underlying fragility in trend conviction. However, the new gap opening from the recent right shoulder introduces a potential reversal opportunity if supported by volume.
The key focus now shifts to the $148–$149 zone, which represents:
The neckline of the complex Kilroy formation
The upper boundary of prior range resistance
A zone of significant volume profile resistance on the right-hand side of the chart
A decisive break above $149 on strong volume would confirm pattern completion and open the door to a potential retest of the $187 post-IPO high.
Support & Risk Levels
Below current price, the chart offers several well-defined structural levels:
$133–$135: Minor support / gap fill area
$119.5: Reaction level from recent low
$112: Base of right shoulder and secondary liquidity zone
$85: Full retracement area if sentiment turns risk-off
As long as the right shoulder structure holds above $112, the base remains valid and the pattern’s bullish bias stays intact.
Technical Summary
✅ Pattern: Complex Kilroy bottom (2H/2RS)
✅ Trend: Stabilizing; higher lows emerging
📊 Key Resistance: $148–$149
⚠️ Support: $133 → $119 → $112
🎯 Upside target (if confirmed): $187 (post-IPO high retest)
🔍 Trigger: Volume-backed breakout above neckline
Final Notes
CoreWeave remains a volatile post-IPO name with strong structural setups but fragile sentiment. The chart suggests accumulation around recent lows, but confirmation will depend entirely on how price reacts into the $148–$149 resistance area.
If the upcoming earnings release delivers a positive catalyst and volume confirms, the measured move from the Kilroy base could complete, retesting the $187 zone in the following quarter.
For educational and technical analysis purposes only.
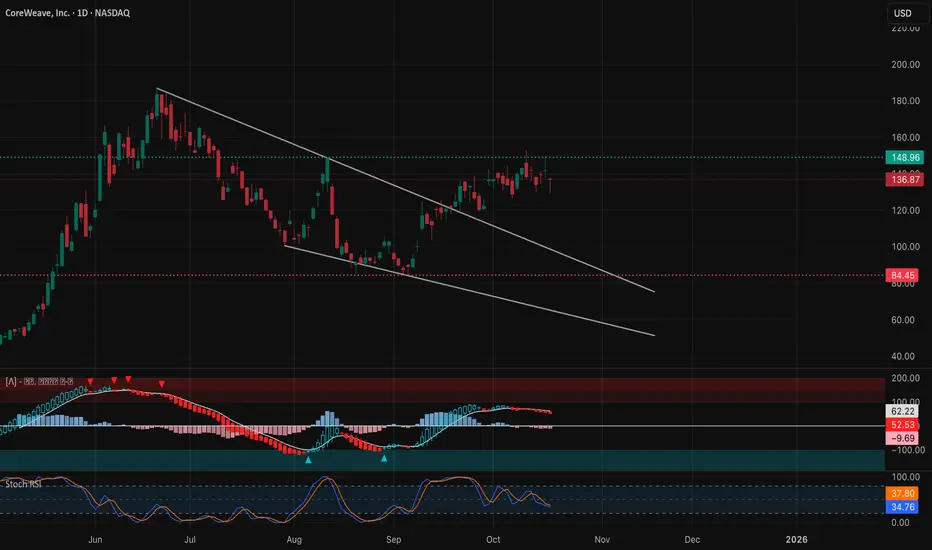
CRWV – Testing Descending Resistance: Oct. 21-25Can Bulls Reclaim $145 or Is the Rally Fading? ⚠️
🟩 Daily Timeframe – Macro Structure and Momentum
CoreWeave’s daily structure shows a clear descending channel since June, with a recent breakout attempt that stalled near $148–$150. After that local top, price retraced back into the mid-range near $136–$138, where buyers are trying to defend short-term structure.
This region is key — a retest of broken resistance now acting as support. A successful hold here would keep the bullish reversal thesis alive. However, failure to defend $134 risks a deeper drop back toward the mid-channel base near $120.
Technically:
* MACD shows fading bullish momentum with histogram turning light red.
* Stoch RSI cooled from overbought and now sits near 35–40, suggesting potential for one more reset before any next leg higher.
* The pattern still favors a bullish continuation if price stays above $134–$136.
Critical zones:
* Support: $130 → $134
* Resistance: $148.9 → $155
🟦 1-Hour Timeframe – Short-Term Price Action
On the 1-hour view, CRWV is fluctuating inside a tight horizontal range ($130–$145) with alternating CHoCH and BOS patterns — showing equal participation between bulls and bears.
Key takeaways:
* The last BOS occurred near $136, suggesting intraday structure recovery.
* Price has since been capped at the $141.7 supply zone, aligning with liquidity rejection from previous sessions.
* MACD is trying to curl back up after bottoming, while Stoch RSI remains in early recovery.
Short-term, a clean breakout above $141.7–$142.5 can attract momentum traders targeting $147–$150, while failure at that zone reopens the downside toward $130.3 (previous BOS retest).
Watch closely how price reacts between $136.5 and $141.7 — that’s the intraday battleground for control.
🟨 15-Minute Timeframe – Intraday Liquidity Rotation
The 15-minute chart reveals a micro descending wedge forming after several CHoCH–BOS sequences, showing a compressed structure between $129–$141.
Price printed a BOS at $136, followed by a minor CHoCH, meaning bulls are testing control but losing momentum into Friday’s close. The short-term pattern likely plays out with a liquidity sweep below $134–$135, then a quick reversal if buyers absorb it.
Indicators:
* MACD shows mild bullish divergence — histogram rising while price holds flat.
* Stoch RSI resetting near oversold, suggesting possible relief bounce ahead.
If price reclaims $137–$138, expect short-term scalps toward $141.7, while loss of $134 exposes $130.3–$127 zone.
🟥 GEX (Gamma Exposure) & Options Sentiment
The GEX map shows how dealers are positioned:
* Highest call resistance (positive GEX): $145–$153
* Highest put support (negative GEX): $129–$120
* Neutral gamma band: $134–$140 — where most hedging flow stabilizes.
* Max Pain: Around $135, suggesting pinning potential early week.
Dealer flows currently neutral to slightly long gamma, which implies controlled volatility and mean reversion bias early week. A break over $145 could flip gamma short — triggering a momentum extension toward $150–$155 if volume confirms.
Implied Volatility Readings:
* IVR: 37.5
* IVX avg: 34
* Current IV slightly elevated but not extreme — moderate volatility pricing, meaning breakout potential is intact.
🎯 Trade Scenarios
Bullish Setup 🟢
* Entry: Above $141.8–$142.5 confirmation breakout
* Targets: $147 → $150 → $153
* Stop: Below $135.5
* Confluence: MACD bullish crossover + RSI > 55
Bearish Setup 🔴
* Entry: Breakdown under $134.5 or rejection from $141.7
* Targets: $130 → $125
* Stop: Above $142.5
* Confluence: MACD turning red + lower EMA slope
🧭 Closing Outlook – Week of Oct 21–25
CRWV is at a technical inflection zone, coiling just below a key resistance while testing reclaimed trendline support. This structure usually leads to a volatility expansion week.
If bulls defend $134–$136, expect a rebound attempt toward $145+. A failure there shifts control back to sellers, dragging price toward $127–$130 where larger gamma support sits.
With balanced options flow and fading volume, patience is key — wait for clean breakouts or liquidity sweeps before entry.
Disclaimer:
This analysis is for educational purposes only and does not constitute financial advice. Always do your own research and manage your risk.
CRWVSomeone bought more options for 12/19 they now hold over 17 million in options 140 call for 12/19/25 that’s a
Massive bet I long the stock as soon as I saw that . We will find out soon

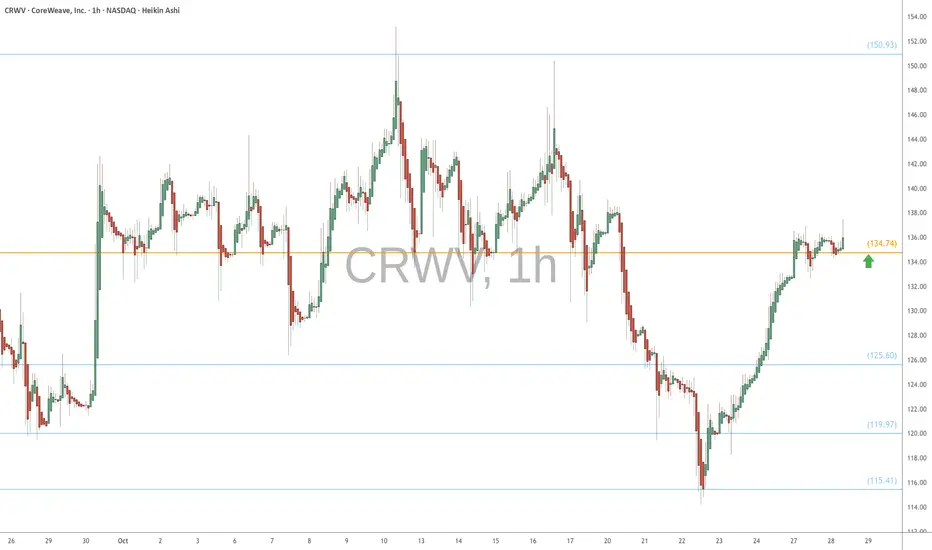
CRWV - channel breakdown towards gap fillCRWV - Stock breaking out of the channel on the daily to the downside. Stock has gap to fill to the downside. 126.50 to $122.58. looking for gap fill if enter. outs below $127 looking good. $135 key level for a move to the upside.

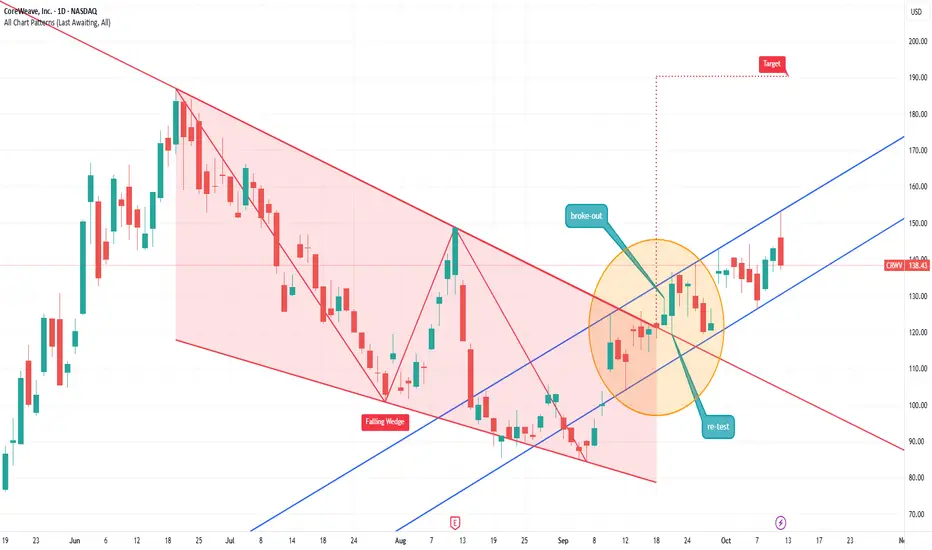
CRWV to 185+, technical, financial and fundamental analysisCRWV recently broke out from a falling wedge with a re-test. The broke out target would be at around $190. So far it's riding toward that in the new uptrend channel.
The technical setup and projection is also supported by the strong financial and fundamental.
Financial - Total sales from past 4 quarters were about $4 billions. But the company has a sales backlog of $50+ billions. EPS isn't positive yet as it's still in a huge growth and investment mode. But EBITDA have been growing well.
Fundamental - The partnerships and deals with Nividia, OpenAI, Microsoft, Google, Meta have been incredible. The contracts have been growing fast in both the GPU gigawatt capacity and number of hyperscale customers.
Recently, the company has a number of acquisitions: Monolith AI, OpenPipe, Core Scientific and Weights & Biases. These companies specializing in PaaS and SaaS. So they allow CoreWeave to expand well beyond IaaS with stronger and more diversified products portfolio.
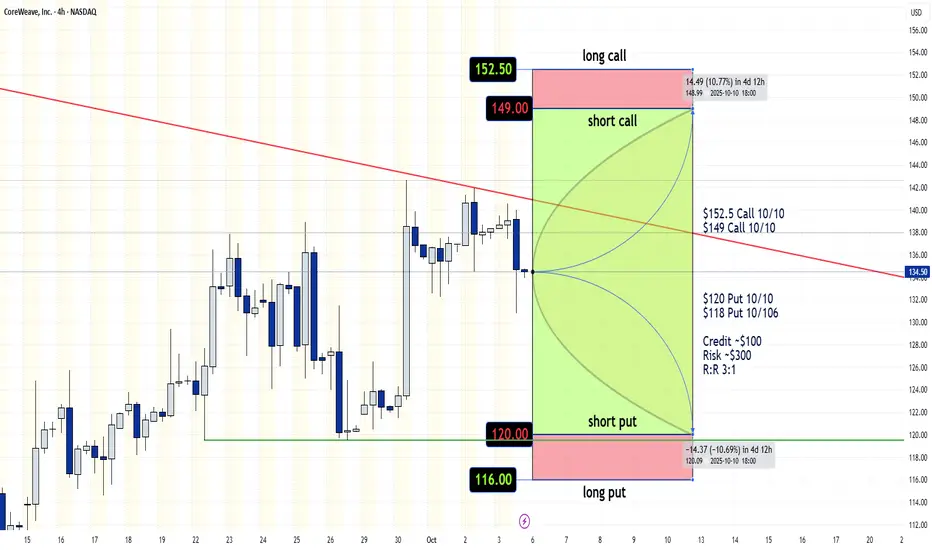
$CRWV IRON CONDOR TRADE IDEA FOR 10/10 EXPY+1 $152.5 Call 10/10
-1 $149 Call 10/10
-1 $120 Put 10/10
+1 $118 Put 10/106
Credit ~$100
Risk ~$300
R:R 3:1
FLAG!Look at this flag.
Look at the coiling after break out from flag.
This looks like it wants to jump.
For note, I own 10 shares of this company, am looking into possibly funneling some more money though into this stock for a pure scalp play.
RED LINE IS YOUR FREAK OUT LINE- DO NOT OWN BELOW THIS POINT
Otherwise, happy trading and we would WANT to aim for the 161.8% retracement level.
But if i were to be honest, im looking to get out maybe at $200

CoreWeave Is Up 300% Since April. What Its Chart Says HereCoreWeave NASDAQ:CRWV has risen more than 240% since its March initial public offering and some 300% since its April low -- including a roughly 13% leg up since just the stock's Sept. 26 session low. What does CRWV's fundamental and technical analysis say here?
Let's check things out:
CoreWeave's Fundamental Analysis
CRWV has been rising on multiple recent positive catalysts, with the latest one coming on Sept. 30.
Shares took off after Bloomberg News reported that morning that CRWV had signed a deal to supply social-media giant Meta Platforms NASDAQ:META with up to $14.2 billion of AI-focused computing power.
CoreWeave, which later publicly confirmed the deal, will provide Meta with access to GB300 systems from Nvidia NASDAQ:NVDA as part of the agreement.
The pact adds to CoreWeave's already-long list of elite clientele. Microsoft NASDAQ:MSFT had been the firm's largest customer, while CoreWeave recently expanded an initial agreement with OpenAI into a contract worth an estimated $11.9 billion to $22.4 billion.
Interestingly, CoreWeave and OpenAI are both backed by Nvidia, while OpenAI is also backed by Microsoft.
For those not familiar with CoreWeave, it's a cloud/AI infrastructure-technology company.
The CoreWeave Cloud Platform combines software and cloud services to deliver increased efficiencies and automation that can better manage the complex infrastructures required to develop and run AI workloads.
The firm is involved with both large-language-model training and inference as well. That's crucial to the generative and agentic sides of artificial intelligence, which in my opinion is the future of how companies will eventually monetize AI (at least on the software side).
CoreWeave is a competitor to all of the major cloud-services providers. However, Oracle NYSE:ORCL is emerging as the company's primary rival in providing elite-level, high-paying customers with GPU cloud solutions and high-performance computing.
CoreWeave's Technical Analysis
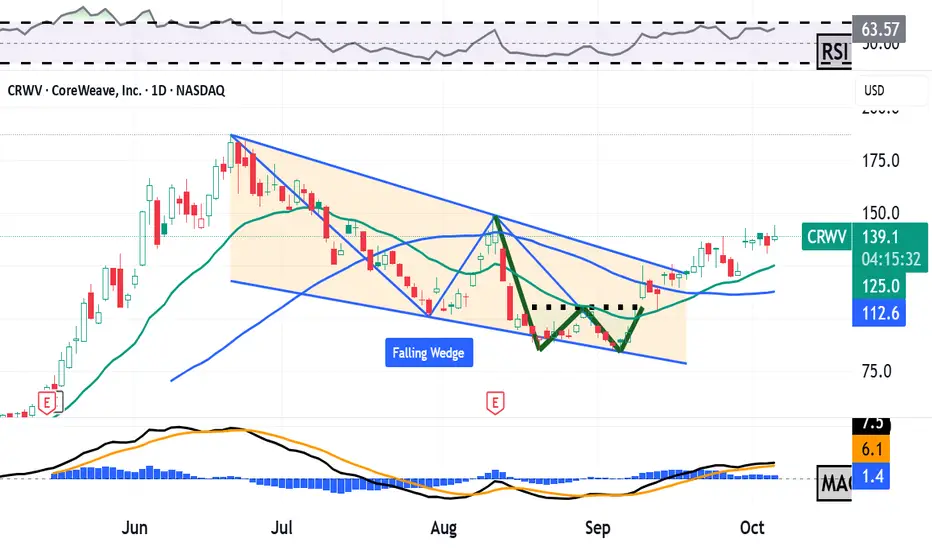
Here's CRWV's chart going back some five months and running through Wednesday afternoon:
There are multiple positive technical items visible on this chart.
First, I see a "falling-wedge" pattern of bullish reversal that ran from mid-June into mid-September, as marked with the red box above. I also see a double-bottom pattern of bullish reversal marked with a jagged green line.
These patterns both emerged just after CoreWeave sold off from its mid-June high of $187. The stock eventually bottomed out at $84.40 intraday on Sept. 5, but has rebounded some 60% since then.
That undoubtedly has many investors and traders asking themselves whether CRWV still has room to run.
Well, we see in the chart above that CoreWeave's 21-day Exponential Moving Average (or "EMA," marked with a green line above) recently crossed above the stock's 50-day Simple Moving Average (or "SMA," denoted with a blue line). This is known as a "swing trader's cross" or "mini-golden cross," which are considered bullish.
Meanwhile, CoreWeave took and held that 50-day SMA some two weeks ago. That probably encouraged some professional managers to increase long-side exposure.
The 50-day SMA line was also CoreWeave's pivot, and it stood at about $111 at the time vs. the stock's $134.79 close on Friday.
Also note that CoreWeave's Relative Strength Index (the gray line at the chart's top) is healthy, but looking nowhere close to technically overbought.
However, the stock's daily Moving Average Convergence Divergence indicator (or "MACD," marked with black and gold lines and blue bars at the chart's bottom), appears to be very bullishly postured.
Within the MACD, the 9-day EMA (the blue bars) has been above zero since early September.
Similarly, the 12-day EMA (the black line) has been above the 26-day EMA (the gold line) since early September, and both have been positive since mid-September. All of those things are typically bullish signals.
Reducing Net Basis
What if someone wants to get long on CoreWeave but is afraid that the horses might have already left the barn?
In this scenario, options traders often use a "buy-write" strategy (also known as a covered call) to lower their net basis on the stock.
This involves purchasing the underlying shares while also selling an equivalent amount of call options above the current stock price.
Here's an example that assumes CoreWeave will next report quarterly earnings in mid-November:
-- Purchase 100 shares of CRWV at or close to $135.75.
-- Sell (write) one Nov. 21 CRWV $160 call for about $10.30. This call will presumably expire after CoreWeave's next earnings release.
Net Basis: $125.45
Traders in this example have reduced their net basis by 7.6%, but also sold the right to someone else to purchase the shares at $160 up until the call's Nov. 21 expiration.
If the shares are called away, the trader's profit at expiration (assuming the covered call remains in place) would max out at 27.5%.
But if there's no exercise and the stock is at or below $160 at expiration, the trader would keep the entire $10.30 premium.
(Moomoo Technologies Inc. Markets Commentator Stephen "Sarge" Guilfoyle was short CRWV at the time of writing this column.)
This article discusses technical analysis, other approaches, including fundamental analysis, may offer very different views. The examples provided are for illustrative purposes only and are not intended to be reflective of the results you can expect to achieve. Specific security charts used are for illustrative purposes only and are not a recommendation, offer to sell, or a solicitation of an offer to buy any security. Past investment performance does not indicate or guarantee future success. Returns will vary, and all investments carry risks, including loss of principal. This content is also not a research report and is not intended to serve as the basis for any investment decision. The information contained in this article does not purport to be a complete description of the securities, markets, or developments referred to in this material. Moomoo and its affiliates make no representation or warranty as to the article's adequacy, completeness, accuracy or timeliness for any particular purpose of the above content. Furthermore, there is no guarantee that any statements, estimates, price targets, opinions or forecasts provided herein will prove to be correct.
Options trading is risky and not appropriate for everyone. Read the Options Disclosure Document ( j.moomoo.com ) before trading. Options are complex and you may quickly lose the entire investment. Supporting docs for any claims will be furnished upon request.
Options trading subject to eligibility requirements. Strategies available will depend on options level approved.
Maximum potential loss and profit for options are calculated based on the single leg or an entire multi-leg trade remaining intact until expiration with no option contracts being exercised or assigned. These figures do not account for a portion of a multi-leg strategy being changed or removed or the trader assuming a short or long position in the underlying stock at or before expiration. Therefore, it is possible to lose more than the theoretical max loss of a strategy.
Moomoo is a financial information and trading app offered by Moomoo Technologies Inc. In the U.S., investment products and services on Moomoo are offered by Moomoo Financial Inc., Member FINRA/SIPC.
TradingView is an independent third party not affiliated with Moomoo Financial Inc., Moomoo Technologies Inc., or its affiliates. Moomoo Financial Inc. and its affiliates do not endorse, represent or warrant the completeness and accuracy of the data and information available on the TradingView platform and are not responsible for any services provided by the third-party platform.
CRWV 31% upside potentialCRWV has closed the daily candle in the golden pocket of its swing high to swing low fib trace.
From this point , with the current momentum and market trend favouring the stock , this could easily go to 180 which is a 30% upside potential. With your own risk/reward ratio based stop loss I think this trade setup is looking good

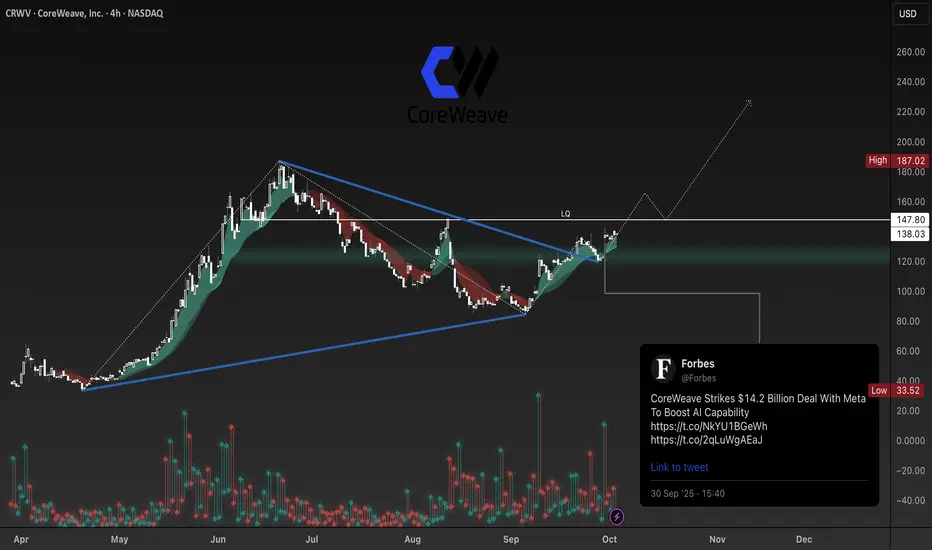
CRWV: The Beautiful Path ForwardCoreWeave (CRWV) has reached a pivotal moment in its market journey. After months of decline within a defined descending channel, the stock is showing signs of a complete structural reversal. The higher-timeframe breakout, the mid-timeframe shift into higher lows, and the execution-level formation of an inverse head and shoulders all point toward a unified, bullish story.
The following stages will outline the necessary phases for this development to fully mature—from breaking free of the broader downtrend, to establishing a foundation of strength, and finally to executing the reversal that unlocks higher price targets. Together, they form the roadmap of why CRWV has, indeed, a beautiful path forward.
Phase 1: The Big Picture – Breaking Free from the Downtrend
On the higher-timeframe 4H chart, CRWV has spent months trapped within a descending channel, carving out lower lows (LL) and reinforcing bearish sentiment. This long consolidation served to reset valuations and shake out weak hands, but now the structure has shifted.
The decisive break above the descending channel represents more than just a technical move—it’s a structural transition. Price has climbed from a deep demand base near $85 and pushed into a breakout zone around $138–$148, marking the first higher high after a prolonged series of lower lows. This moment defines the end of the downtrend and the birth of a new market cycle.
Phase 2: The Reversal Zone – Building a Foundation
Zooming into the mid-timeframe, we see how the market began transitioning out of weakness. After establishing a double bottom (DB) near the lows, CRWV started printing higher lows (HLs), gradually chipping away at resistance. Each break of structure (BoS) confirmed strength, and the final move toward $148 created the key break that unlocked bullish continuation potential.
This reversal is critical—it shows that buyers are not just stepping in at demand but are defending higher levels. Market sentiment is shifting as supply diminishes and accumulation takes place. The $148 zone now becomes a key pivot, where a breakout and retest would transform resistance into support and set the stage for acceleration.
Phase 3: The Execution – The Inverse Head and Shoulders
On the execution timeframe, the structure is clear: CRWV has formed an inverse head and shoulders pattern, a powerful reversal signal. The left shoulder, head, and right shoulder align perfectly with the neckline at $148. A breakout above this neckline, followed by a successful retest, provides the precise technical entry for traders.
From there, the projection points higher, with potential upside first into $160, and then a measured move back toward the all-time highs around $187. Beyond that, continuation could even extend toward the $220 zone as momentum builds, fueled by both technical breakout dynamics and strengthening fundamentals, such as CRWV’s recent $14.2 billion AI partnership deal with Meta.
Conclusion: The Beautiful Path Forward
CRWV’s chart tells a story of patience, accumulation, and now rebirth. From the wide-angle view of a descending channel break, through the detail of higher lows and structural shifts, down to the execution of a textbook inverse head and shoulders—the setup is harmonious and compelling.
With momentum aligning across all timeframes, and key catalysts supporting growth, CRWV indeed has a beautiful path forward. The market has spoken: the downtrend is behind us, the foundation is built, and the future points higher.