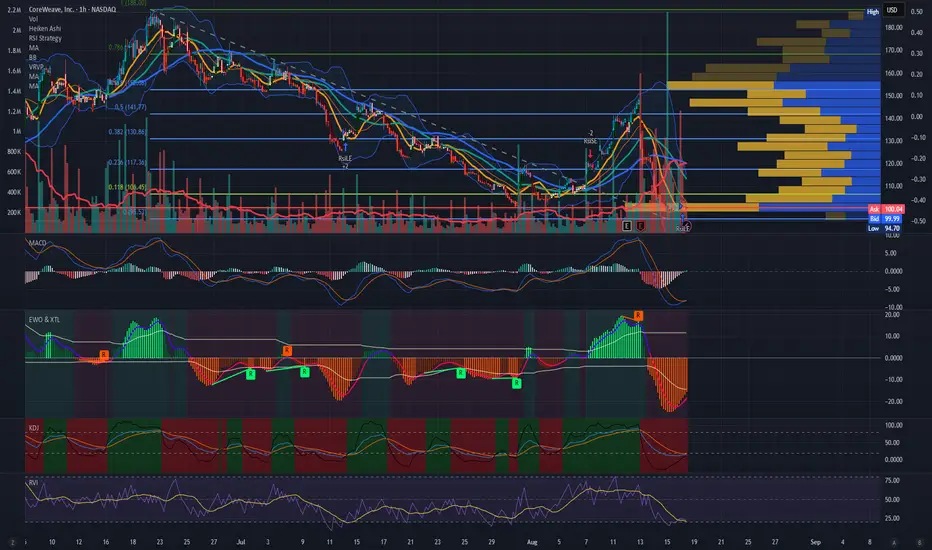
Coreweave CRWV AI data center growingCRWV is in revenue growth and near positive earnings in another year.
Just an idea, make own decisions.
www.tradingview.com
* FIB resistance entry, 1 hr chart, cross-over, volume spikes like $70-$180 / share.
* Revenue 747 mil in 2024 and projected to hit 5.2 Billion in 2025 and 11.8 B in 2026 and 17.1B in 2027, and 21.3 B in 2028 or a 20x revenue in 4 years.
* Earning -1.59 in 2025, -0.38 in 2026 and positive $2.13 in 2027. and $3.44 in 2028
* MACD cross over on 1 hr chart with volume spike
* Elliot wave cross up
* KDJ cross into green on 21/7 on 1 hr chart
* Volatility bottom up cross signal
Looking at a potential 50% gain off entry $98-100, planning to exit if dipping lower for new entry.
#CRWV
#APLD
Trade ideas
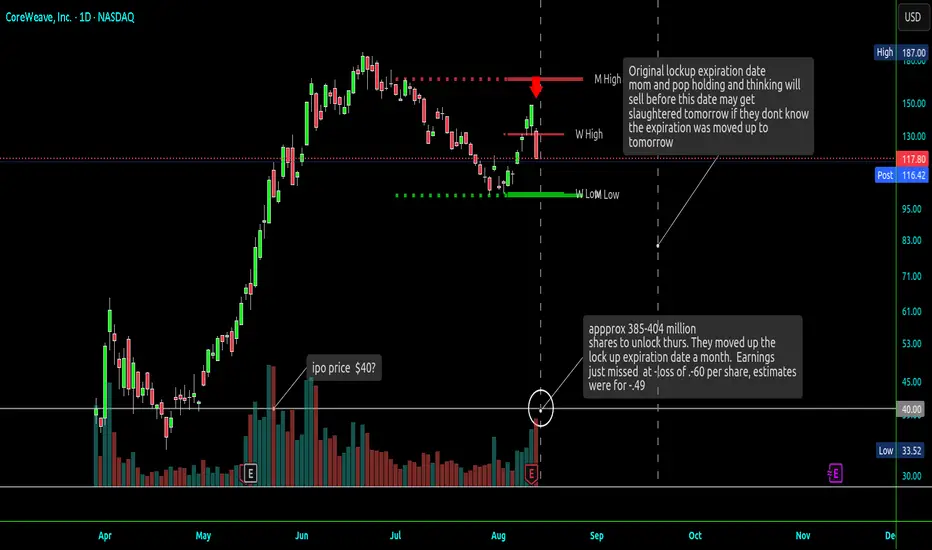
CRWV Lockup Expiration- Hype Cool Runner IPOLockup Expiration moved up to tomorrow. Well above IPO price. Had a hype cool ipo run. Down 20% today alone. Unlocking millions of shares which could put a lot of overhead pressure on it. Beat on recent Rev but missed its negative earnings by a bunch. Was a great short/put today lets see what happens when the real pressure shows up tomorrow. Ck out the details on it on an AI. Tried to post yesterday, was not sure if it posted. Do your own research. Many ipos coming to market this type of thing can be an opportunity in peak bull market cycles. They start bringing so many things to market.
Weekly Watchlist - 8/18 - 8/22 Top 3 - $CHWY, $LYFT, $YUM+BONUSThis is my weekly watchlist - solid setups going into this week.

New rideThe price hits the purple trendline and halts its decline.
It opens with a gap down of -5%, but quickly recovers, forming Larry Williams’ OOPS pattern.
Buy at 99$, with a stop below today’s low.
Target at $187, the previous high with an ambitious +88% upside.
Extremely high volume today, with incredible buying pressure during the first 30 minutes of the session.
What Is the OOPS Pattern?
The OOPS pattern occurs when:
- The market opens with a gap in the direction of the recent trend (e.g., gap down in a downtrend).
- But instead of continuing, it quickly reverses and moves against the gap, trapping traders who chased the open.

CRWV recap... high volume movethat earnings drop was absolutely amazing. I know it's not amazing to shareholders, but the volume move was swift and hit targets.
That buy today looks like a pop incoming at least. But do play with caution as the company sold off for a reason. The company is new & volatile so play the swings. Let's see if we can get 105-110 next week if catastrophe stays at bay over the weekend.
The kicker candlestick pattern is a great reversal pattern. Google it and check to see if trading view has more education and examples.
A Kicker Candlestick pattern consists of 2 candles to reverse the current trend. There must be space between the candles. continuation is below the kicking candle.
Enjoy

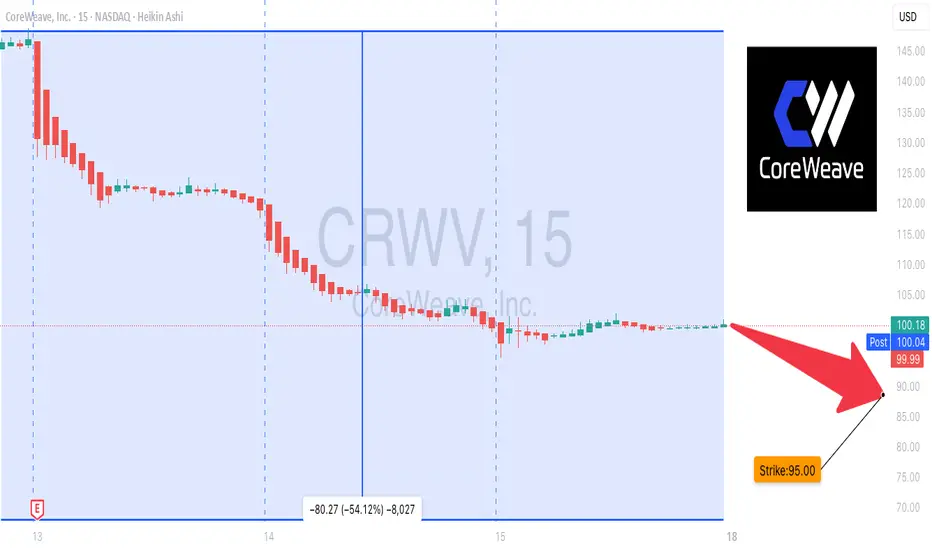
CRWV Breakdown Alert: Short Setup Ready!
## **⚠️ CRWV Bearish Swing Setup – Puts in Play!**
**Moderate Bearish Bias | Aug 15, 2025**
**📊 Key Highlights:**
* **RSI:** 37.9 – Clear bearish momentum 📉
* **5D Perf:** -17.98% 🚨
* **10D Perf:** Similar heavy downside pressure
* **Volume:** Average (1.0x) – no panic selling, but no bullish rescue either
* **Options Flow:** Neutral Call/Put (1.00)
* **VIX:** 14.84 – Low volatility, clean downside setups
---
**💡 Trade Plan:**
* **Type:** Aug 29 ’25 \$95 PUT
* **Entry:** \$6.50 (on confirmed break < \$98)
* **Stop Loss:** \$2.52 (-40%)
* **Target 1:** \$9.45 (+50%)
* **Target 2:** \$15.75 (+150%)
* **Confidence:** 75%
---
**⚠️ Risks:**
* Reversal above \$100 = high risk of stop hit
* Premiums elevated vs historical norms
* Weak volume = could slow downside momentum
---
📆 **Signal Time:** 2025-08-15 11:46 EDT
💎 **Execution:** Enter at open ONLY if \$98 breaks with momentum
---
\#CRWV #OptionsAlert #SwingTrade #PutOptions #NASDAQ #BearishTrade #MomentumStocks #StockMarket
CRWV: CoreWeave — Post–Lock-Up Expiration Outlook1. Fundamentals & Event Risk
Lock-Up Expiration: On Aug 14, 2025, ~83% of Class A shares became tradable. This adds a massive supply influx, often triggering profit-taking and short-term downside pressure.
Earnings Context:
* Revenue: $1.21B (beat expectations) — shows strong demand in AI infrastructure.
* Net Loss: $291M ($0.60/share) — larger than expected, raising concerns on profitability and debt load.
* Guidance: Full-year revenue forecast raised to $5.15–$5.35B.
Market Sentiment: Mixed — Citi remains bullish ($160 PT), Morgan Stanley and Mizuho more cautious, flagging valuation and concentration risk.
Implication: The lock-up timing right after earnings creates a high-volatility environment. Even strong revenue growth may not offset insider selling pressure in the short term.
2. Technical Analysis (1-Hour Chart)
Trend Structure
* Price climbed in a rising channel, printing multiple Break of Structure (BOS) signals on the way up.
* A Change of Character (CHoCH) has now emerged after the last BOS — early signal of trend reversal.
* Momentum shifted sharply lower after failing at ~$150.
Key Zones
* Immediate Resistance: $141.43 — must be reclaimed for bullish momentum.
* Major Supply Zone: $150–$163 — heavy prior volume and likely selling interest.
* Immediate Support: $133.15 — break here opens door to $114.21.
* Next Strong Demand: $101.60 — last defense before deeper retracement.
Indicators
* MACD: Bearish crossover with histogram expanding — sellers have control.
* Stochastic: Oversold but not turning upward yet — suggests weakness could continue before bounce.
3. Combined Trade Plan
Short-Term Bearish Bias
* The confluence of lock-up supply shock + CHoCH + MACD bearish momentum favors short setups until price proves otherwise.
Possible Strategies
* Aggressive Traders: Look for failed retests near $141.43 or channel midline for put entries or short stock.
* Conservative Traders: Wait for a clean break & retest of $133.15 before targeting $114.21.
* Options Play: Short-term bear call spread or debit put spread, targeting $114–$110 zone.
Bullish Contingency
* If price reclaims and holds above $141.43 with volume, potential push to $150, but heavy resistance remains.
4. Risk Management
* Keep stops tight due to IPO-related volatility.
* Size positions smaller than normal — rapid swings possible as liquidity shifts.
* Watch for intraday reversal candles near oversold levels — could trigger short squeezes.
Bottom Line:
CRVW is in a vulnerable spot — strong revenue growth is fighting against heavy insider selling pressure post lock-up. Until the chart confirms strength above $141.43, rallies are suspect. Best approach is to lean bearish short-term, but be nimble for oversold bounces.

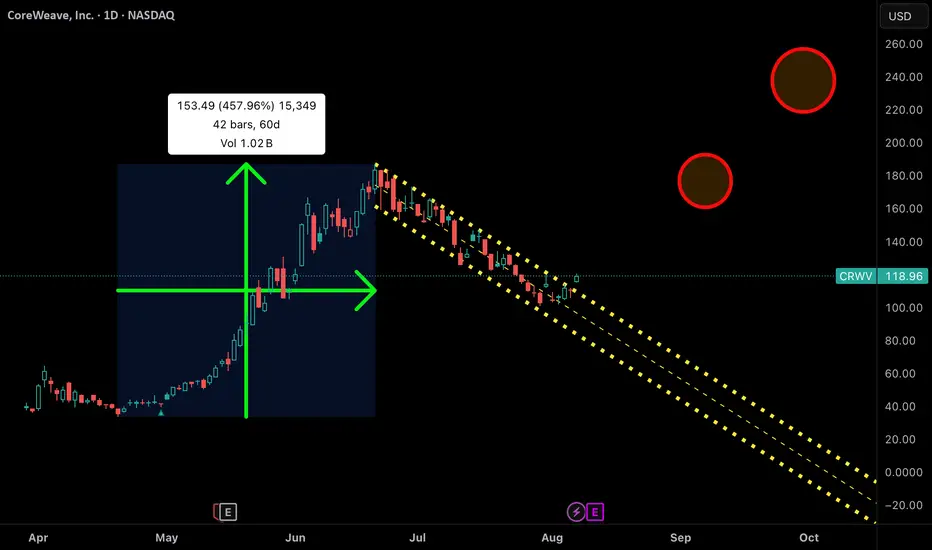
Frothy Market - More Juice in the tank?Coreweave has been a wild ride, look no further if you're looking for a high beta stock at the very center of the AI cyclical tailwind. There's no doubt this market is frothy, so i'll make it clear that this stock is not for the faint hearted.
Coreweave pumped 457% since the Liberation day crash, one of the strongest performers on the market. We peaked at $187 and crashed 46%. Resistance has been broken on the fourth touch, we gapped up from $110, this is where I took my trade as I anticipated a break of the trendline resistance. Stop loss moved to break even.
Coreweave is not in the all clear just yet. There's strong resistance between $139 to $144. Earnings on 12/08/25, so expect some extreme volatility. There's big question marks around the business model and the valuation, but in a euphoric market none of that matters - it's all about momentum and this chart suggests we could push up higher one more time.
Not financial advice, do what's best for you.

How far CRWV can go???Last time when I published my idea it moved +450% up.
What do you think about this time?
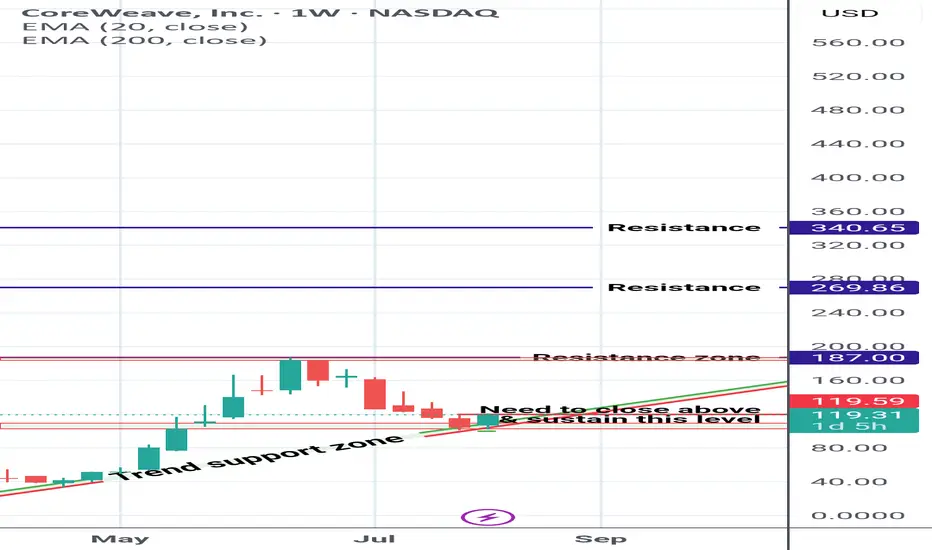
CoreWeave Inc CRWV Getting Ready CoreWeave Inc looks a good bet at cmp 119$ for long.
Risk : Reward Ratio is awesome.
Below trend support zone makes it weaker.
$CRWV: Reversal Brewing or More Pain Ahead?🧠 NASDAQ:CRWV – Technical Analysis (Daily Timeframe)
CoreWeave is currently trading at $104.14, sitting at the lower end of a well-defined descending channel after a steep selloff (-8.75% today). Volume is spiking, suggesting growing interest — whether that's accumulation or distribution is the key to watch next.
📉 Descending Channel Breakdown
Upper trendline = breakout trigger
Lower trendline = breakdown trapdoor
🟡 Midline of the channel = key decision zone (dynamic resistance/support)
Acts like a battlefield: bulls want to flip it, bears want to reject it.
CRWD has been respecting the midline as resistance — until price reclaims and holds above it, trend remains bearish.
If we break above the midline with volume, that’s early confirmation of strength before even touching the top of the channel.
🟢 Long Setup (Breakout Play)
Trigger: Break & close above channel top (~$110+)
Confirmation: Reclaim midline, convert it to support
Targets:
$120 local supply
$140 minor inefficiency
$186 gap-fill + key supply zone
🔴 Short Setup (Breakdown Play)
Trigger: Break & close below lower trendline (~$100 or under)
Confirmation: Fail to reclaim midline on bounce
Targets:
$85 psychological zone
$64.82 demand level
📊 Indicators
MACD: Bearish, but curling. A bullish cross on a midline reclaim = fuel.
RSI: Near oversold, showing early divergence = potential bounce
Volume: Big pop today — first real signal buyers/sellers are clashing hard.
🎯 Key Takeaway:
✅ Break & close above midline → early strength
✅ Break & close above channel → CONFIRMED BUY
❌ Close below lower channel → HIGH-PROBABILITY SHORT
❓ Rejections at midline → continue fading pops until proven wrong

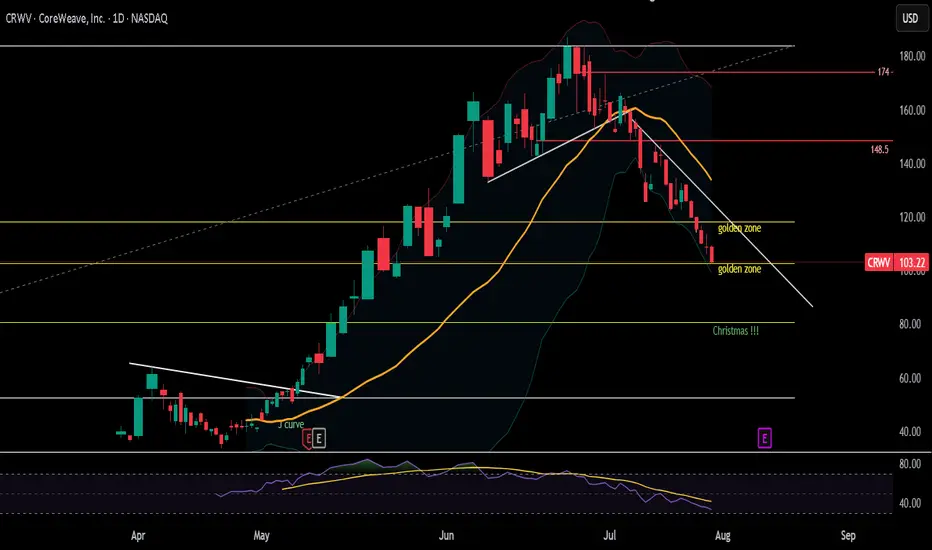
CRWV still crashing... breaking $100?whew.... will we break $100?
*failed 110
well i have a christmas fib outlined. i think i'll do a little investigating on this stock. popped due to its connection to NFLX. let's see what is going on before we buy the dip.
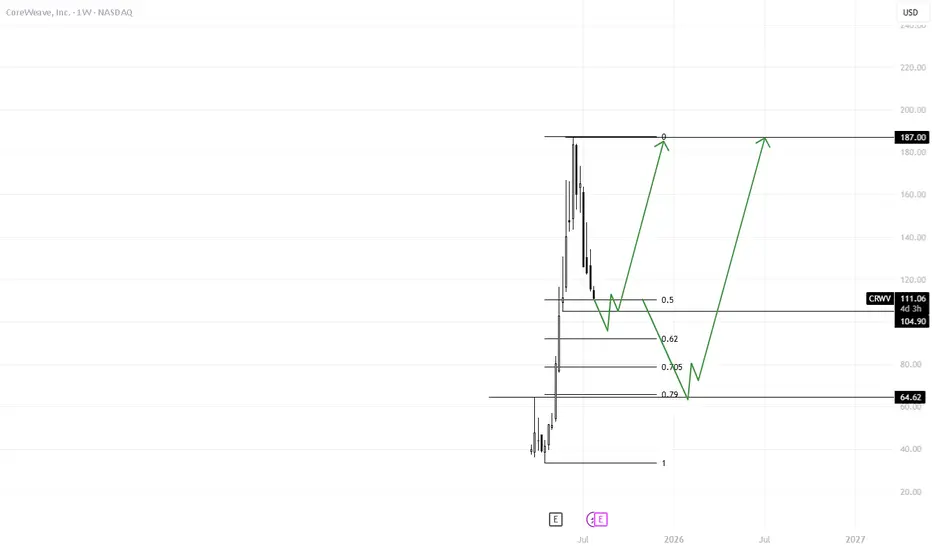
CRWVExpecting Bullish price action at 100$ level. If break of structure is noted and maintained I see upside targets remaining 189$. Second Scenario is Price falls to the 60$ level then shows bullish price action.
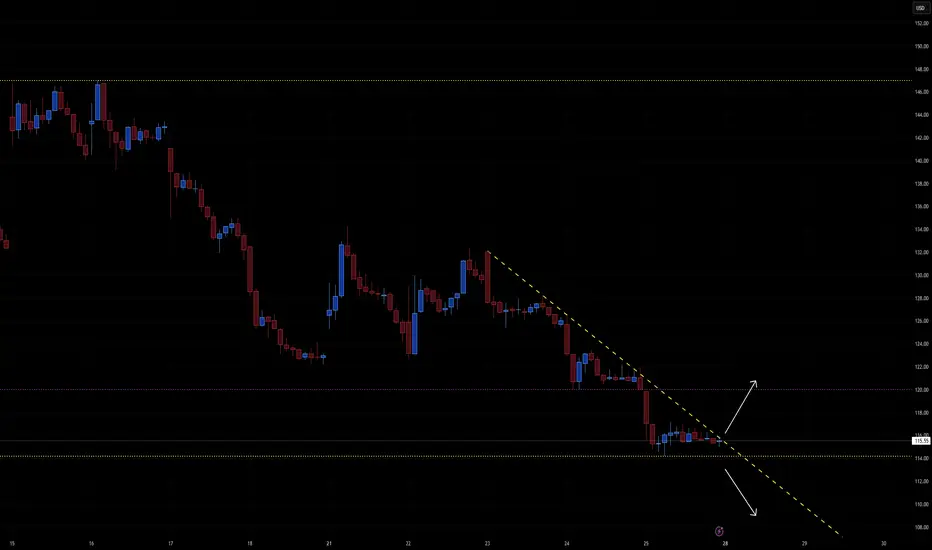
CRWV - THE MOMENT OF TRUTH📰 CoreWeave (CRWV) — Technical & Macro Update
Ticker: CRWV | Chart Timeframe: 30-min | Current Price: $115.62
Sector: AI Infrastructure / Data Centers
Date: July 26, 2025
⚡ Market Recap
CoreWeave was in the spotlight this week following two key developments:
🏗️ $7 Billion Lease Deal: Entered two 15-year AI data center agreements with Applied Digital (APLD), expected to generate $7B in top-line revenue. This solidifies long-term client infrastructure demand and recurring income.
💸 Debt Load Grows: Issued $1.75B in 9% bonds, raising concerns over capital intensity and financing strategy. Total projected capex through 2025 is $20–23B, requiring significant additional funding.
📉 HSBC Slashes Price Target: HSBC initiated coverage with a sell rating and an aggressive price target of $32 — a 72% downside from current levels. The firm cited:
Unsustainable customer concentration (Microsoft makes up ~60% of revenue)
High financial leverage
Risk of multiple compression as AI hype cools
Despite bullish sentiment from lease news, the downgrade weighed on investor confidence, pushing shares into a tight range.
🔍 Chart Technical Outlook
Structure Summary:
Price has compressed under a descending trendline
Trading between $114.00 (support) and $118.50 (resistance)
Price action is setting up for a breakout or breakdown
✅ Bullish Setup
Breakout Level: $118.50+
Short-Term Targets: $122 → $126 → $130
Tailwinds:
Long-term lease revenue visibility
Strong Q1 growth (+420% YoY)
Core partners: OpenAI, Mistral, Microsoft
❌ Bearish Breakdown
Breakdown Level: $114.00
Targets: $110 → $106.50
Headwinds:
$12B+ in debt, rising interest costs
Analyst downgrade to $32 price target
Customer concentration and margin risk
🧠 Strategic Takeaway
CoreWeave is perched at a critical level. While bulls are encouraged by long-term deals and market share in AI compute, bears are becoming louder following HSBC’s stark warning.
Play the breakout—but know the macro backdrop. A move above $118.50 opens upside, but failure below $114 could confirm bears' thesis.
CRWV: Week of July 21Sharing my analysis on NASDAQ:CRWV for next week.
As always, not advice just opinions.
Safe trades and take care!

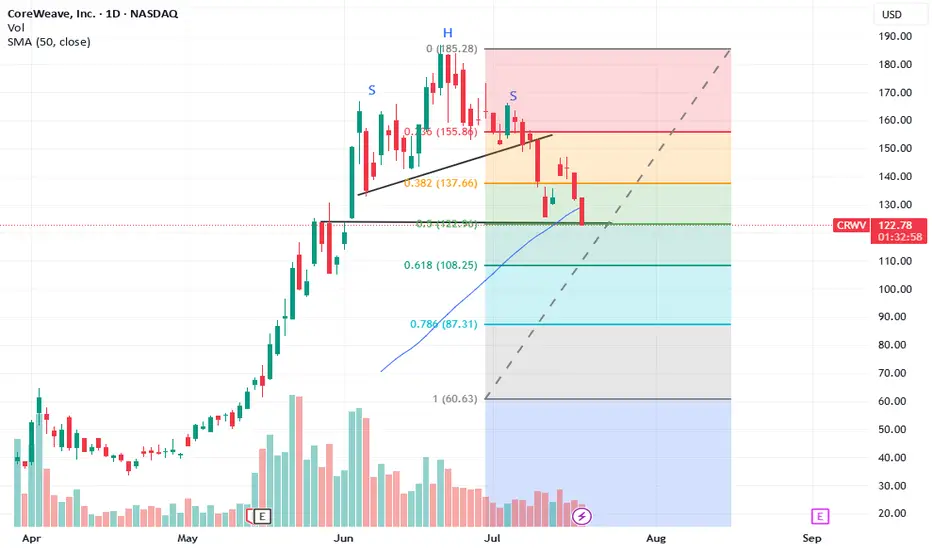
Coreweave retesting supportAfter a recent pop off the support line, it looks like the stock will retest these levels. Also, note the clear H&S pattern over the last several months. I'm expecting a breakdown below support in the next week or two.
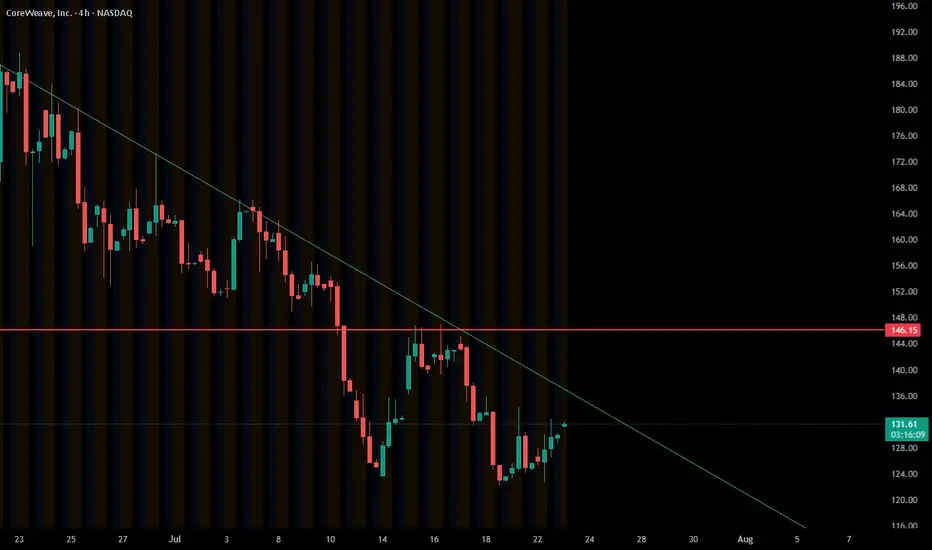
CRWV retest incoming?will we retest 130?
That's my bet. I'm sure that Fri 7/18 will be wild as it is the monthly contract. Staying below 140, I'll hold my runners.
After this bottom, I think we will reverse back upward to 145+

Weekly Equities Trade Idea: CRCL Puts (Update)Hello Traders!
I'm providing an update to the CRCL trade idea from Monday July 14th. Here's what I'm watching:
- Price to open within the range from Tuesday July 15th
- Potential imbalance resolve from Monday July 14th at $204.70
- If price breaks Friday July 11th's high at $206.80 the trade is invalidated
Cheers,
DTD

Short-term Bear Case for CRCLHello Traders!
As part of my weekly equity trade analysis, I will be uploading my recordings of what I am seeing and intending to trade for the week. A quick summary of what's in the video is as follows:
- CRCL is a high beta stock that seems to not be moving in tandem with its peers as of late
- I am expecting volatility due to market data and monthly options expiration
- CRCL has formed a new bearish order block below another bearish order block and is wedged with a weekly bearish setup. We are anticipating expansion out of this range to the downside
- I am waiting for a re-test of $199-$205 for a full move to $155-$145
Cheers,
DTD

WHAT GOES UP MUST COME DOWN wants to close daily gap at $123.66CRWV forms ‘Head and Shoulders’ on the daily over the past month. The breakout to $180s is all I saw a month ago…but now a reversal has started to $123.66 and maybe to $111.95 as the worse case scenario. My daughter made me hold on to this one like she did on Nvidia. She was right on that one….but she is 45 and I am 82. She has more time to wait it out than me. CRWV has taken the path of many IPOs….it pulls up right after coming out of the gate. Regains its footing and starts to move (using horse racing terminology) Great speed rating, so she gains ground in the first turn. Still improving her time down the backstretch as she breaks the $100 mark by middle of May and gaining momentum. She continues to pass horses and moves into the lead as they reach the 1/4 pole. By now it’s apparent that CRWV is a closer as she demonstrates moving down the last eighth of a mile. As she roars up the home stretch 8 lengths ahead of the field closing above $180.
Unfortunately her next race is dismal as she forms a ‘head and shoulder’ pattern. From here it’s all downhill until she reaches $123.66 …..or worse $111.95


CRWV is crash this weeklast 3 days closed below 21 ema. under 50 on daily RSI. head/shoulders below 145 may breach 140 this week? looks like it. i'm gonna make the play.
148 SL
