Deckers May Have StalledDeckers Outdoors plunged in late 2025, and now traders may see further downside risk.
The first pattern on today’s chart is the drop on October 24 after guidance trailed estimates. The footwear company rebounded in December, but it could be showing signs of stalling this month.
Second is the $99.7
Deckers Outdoor Corporation Shs Cert Deposito Arg Repr 0.04 Shs
No trades
136.785 USD
872.99 M USD
4.51 B USD
About Deckers Outdoor Corporation
Sector
Industry
CEO
Stefano Caroti
Website
Headquarters
Goleta
Founded
1973
Identifiers
2
ISIN AR0571828273
Deckers Outdoor Corp. engages in the business of designing, marketing, and distributing footwear, apparel, and accessories developed for both everyday casual lifestyle use and high performance activities. It operates through the following segments: UGG Brand, HOKA Brand, Teva Brand, Sanuk Brand, Other Brands, and Direct-to-Consumer. The UGG Brand segment offers a line of premium footwear, apparel, and accessories. The HOKA Brand segment sells footwear and apparel that offers enhanced cushioning and inherent stability with minimal weight, originally designed for ultra-runners. The Teva Brand segment focuses on the sport sandal and modern outdoor lifestyle category, such as sandals, shoes, and boots. The Sanuk Brand segment originated in Southern California surf culture and has emerged into a lifestyle brand with a presence in the relaxed casual shoe and sandal categories. The Other Brands segment includes the Koolaburra by UGG brand. The Direct-to-Consumer segment consists of retail stores and e-commerce websites. The company was founded by Douglas B. Otto in 1973 and is headquartered in Goleta, CA.
Related stocks

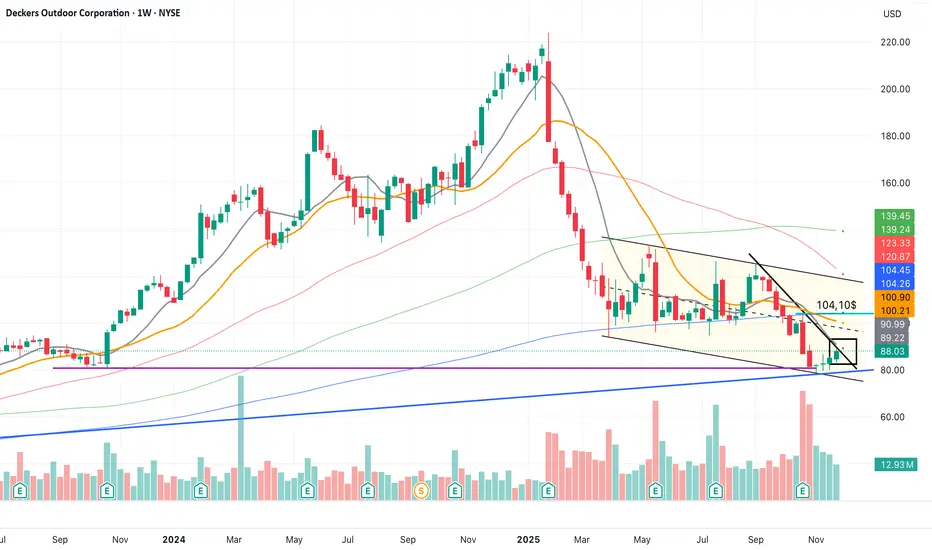
Reversing The price seems to have found a bottom and is beginning to rise, supported by rating upgrades and strong sales forecasts for the next quarter.
It is approaching a breakout above the black resistance, with the next target at $104.10 (light blue resistance), the previous high, where it will also meet
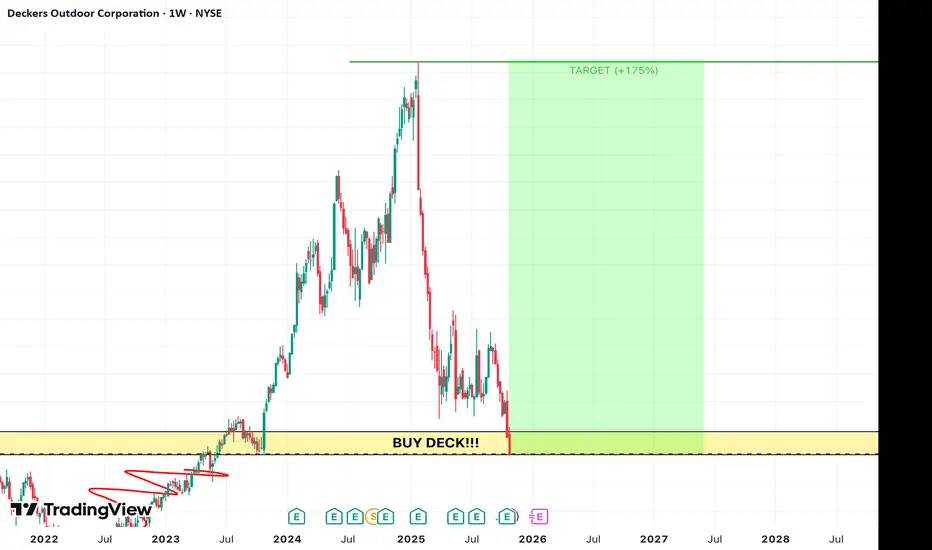
ALL-IN DECK!!!!Boys let's go ALL-IN!!!! Reversal expected from this level. Many stocks dropping giving us a chance to get them for cheap.
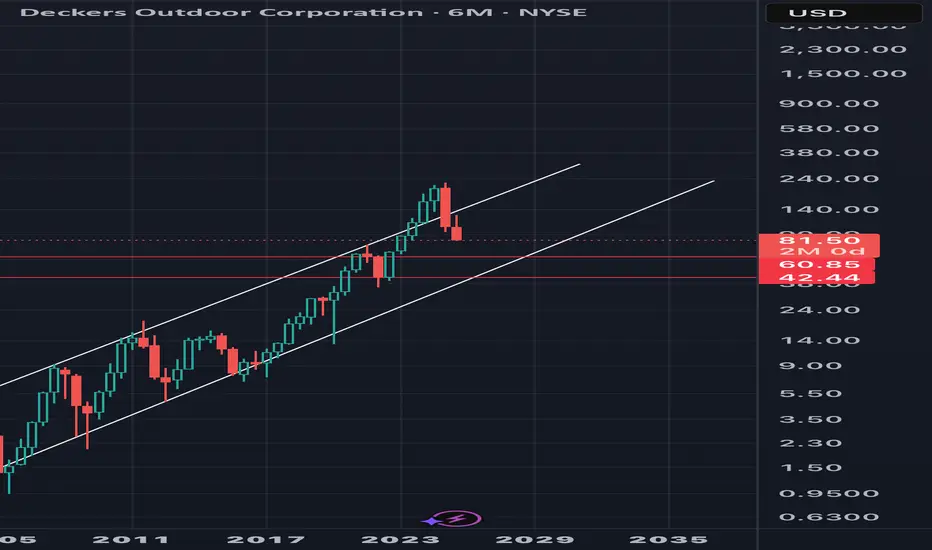
Widening The Channel??Deckers looks appealing at its current price but I think a sideways move is in the future to widen the channel. Watch the lower timeframes for confirming the direction. Be patient and see what happens at the 40-60 zone in my opinion.
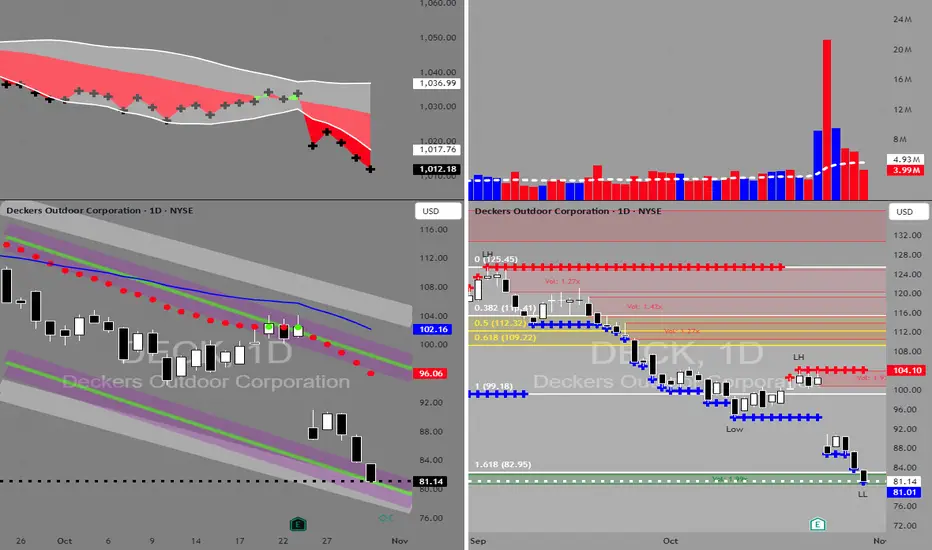
DECK in BUY ZONEMy trading plan is very simple.
I buy or sell when at either of these events happen:
* Price tags the top or bottom of parallel channel zones
* Money flow volume spikes beyond it's Bollinger Bands
So...
Here's why I'm picking this symbol to do the thing.
Price in buying zone at bottom of channe
$DECK is getting ridiculously cheap- NYSE:DECK fundamentals are in tact and investors have panic sold shares because of tariff fears which are overblows.
- NYSE:DECK has a long runway to grow internationally
- NYSE:DECK might close the gap below and then close the earning gap above before next earnings.
- NYSE:DECK earning r

9/25/25 - $deck - lol tf?9/25/25 :: VROCKSTAR :: NYSE:DECK
lol tf?
- while the market bot the "generational dip" as X pnl posters call it, on quantum memes and underpants gnome nuke co's
- here's a name that... still gets no love
- people are going to walk around barefoot in an AI-youre-out-of-a-job-world... i guess.
- d

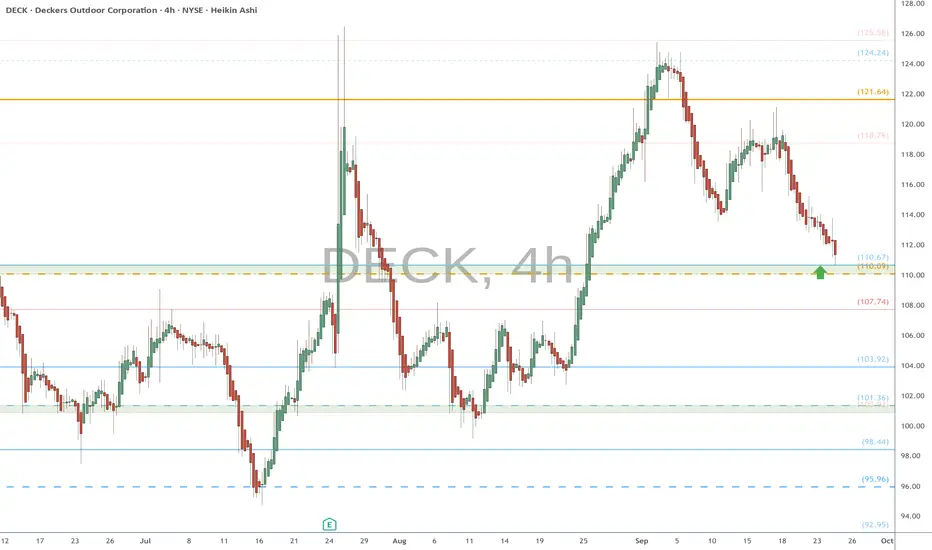
DECK eyes on $110: Key Support if held could mark BOTTOMDECK in a downtrend since our alert 9 months ago.
Currently testing a key support at $110.09-110.67
Looking for a bounce here, with tight stop loss
.
Previous Analsis that caught the EXACT TOP:
Hit BOOST and FOLLOW for more such PRECISE and TIMELY charts.
========================================
8/8/25 - $deck - Don't fud yo hoka8/8/25 :: VROCKSTAR :: NYSE:DECK
Don't fud yo hoka
- idk why 7+% fcf yield, buybacks, 35%+ ROICs, growth in 2H (worst behind us) and growing HSD++ is unattractive in this tape
- but i'll take the over here
- here's the deal... NASDAQ:CROX result was pretty bad. but honestly even that thing's a

8/1/25 - $deck - 50% position8/1/25 :: VROCKSTAR :: NYSE:DECK
50% position
- if you have followed long enough, you know that when i write this sort of thing, it's maybe 5-10x a year, at most
- i still think anything can happen here in the mkt, so there are a lot of arrangements i've made in my portfolio to account for furth

See all ideas
Summarizing what the indicators are suggesting.
Oscillators
Neutral
SellBuy
Strong sellStrong buy
Strong sellSellNeutralBuyStrong buy
Oscillators
Neutral
SellBuy
Strong sellStrong buy
Strong sellSellNeutralBuyStrong buy
Summary
Neutral
SellBuy
Strong sellStrong buy
Strong sellSellNeutralBuyStrong buy
Summary
Neutral
SellBuy
Strong sellStrong buy
Strong sellSellNeutralBuyStrong buy
Summary
Neutral
SellBuy
Strong sellStrong buy
Strong sellSellNeutralBuyStrong buy
Moving Averages
Neutral
SellBuy
Strong sellStrong buy
Strong sellSellNeutralBuyStrong buy
Moving Averages
Neutral
SellBuy
Strong sellStrong buy
Strong sellSellNeutralBuyStrong buy
Displays a symbol's price movements over previous years to identify recurring trends.