Disney Mid-Correction?Looks like Disney could be in the middle of B wave currently, with C wave taking it down to mid double digits in the future before the next impulsive move
Walt Disney Company Shs Cert Deposito Arg Repr 0.083333333 Shs
No trades
Market insights

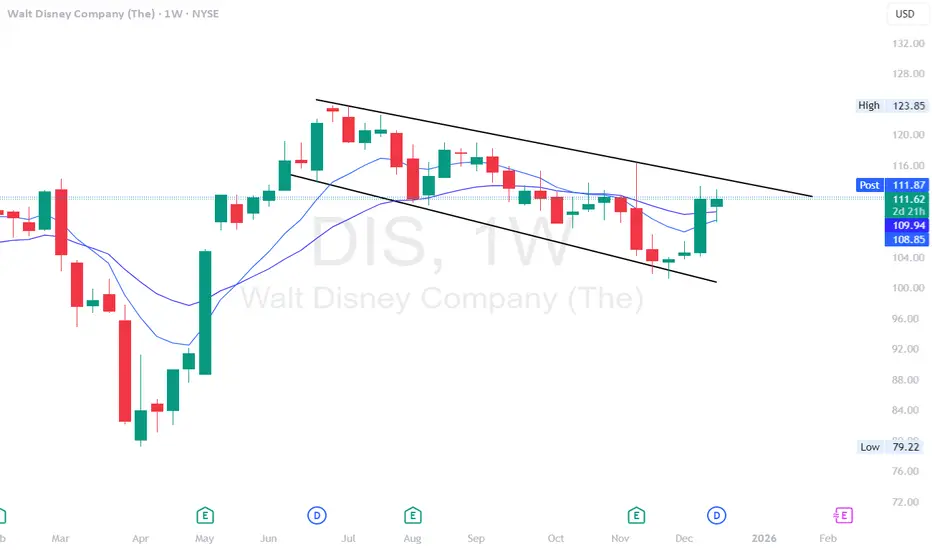
$DIS - stock testing top of the channel possible breakoutDIS- stock has daily gap to $113.50. Stock in a trend channel. testing top of the channel. looking for calls above $112 for gap fill then $115 break for a bigger move upside. If fails here. $108 break for a move lower.
08-2025-12-10-DIS-Uptrend-Long-9.5DIS:
Long Position with Uptrend
Scorecard: 9.5
S: 106.73
E: 107.44
T: 116.23
Shares: 352.11
Walt Disney I Short Term Potential Buy to ResistanceWelcome back! Let me know your thoughts in the comments!
** Walt Disney Analysis - Listen to video!
We recommend that you keep this on your watch list and enter when the entry criteria of your strategy is met.
Please support this idea with a LIKE and COMMENT if you find it useful and Click "Follow" on our profile if you'd like these trade ideas delivered straight to your email in the future.
Thanks for your continued support!

DIS WEEKLY OUTLOOK!One of the best and easiest strategies when trading sideways markets…
I guess there’s no need for a long explanation the chart already speaks for itself if you know how to read it.
In trading or investing, you can never know where the market is going next. That’s exactly why we use charts: they show us solid levels where buying and selling makes sense. As you can see, DIS is still falling and as the saying goes, “never catch a falling knife.” If you buy here, you are taking unnecessary risk because this is the middle of the movement, not a confirmed reversal.
Technical analysis always teaches the same principle:
“Buy support, sell resistance.”
Right now I’m watching to see where this downward move stops. The $80–$85 zone is the main buying area, with a $77.44 stop-loss level. And I know what you’re thinking: “But what if the price doesn’t come down and reverses upward from here?
In that case, we simply wait.
If the price breaks above the $120 resistance, that level will turn into a strong support zone — and that breakout will also give us a clean buying opportunity. We don’t need to rush. We let the chart show us the solid levels.
Please ask yourself first: Are you a long-term investor or a trader?
If you are a trader, never enter a position without a proper setup, stop-loss, and take-profit target. Discipline is everything in trading.
And of course, this is not financial advice.

Walt Disney (DIS) – Reversal Cup & Handle FormationOn the Daily timeframe, NYSE:DIS is forming a reversal cup and handle pattern.
The price is moving below both EMA 50 and EMA 100 , confirming short-term bearish momentum. The recent decline matches the depth of the previous cup’s widest part, indicating potential continuation toward the next strong support near $106.
If this support level breaks, the price could move down to test the psychological zone around $100 , and possibly fill the gap below it.

Disney Stock Breakdown: Hidden Bull Flag and the Next Big MovePrice continues to trade inside the long-term parallel channel drawn from the higher timeframe structure. This channel has been respected for several years, and price is still moving within the same range.
On the monthly chart, price is below the 50-EMA, which increases the probability of a deeper retracement toward the 200-EMA. The global downtrendline, built from the major lows, was broken by a strong two-month bullish impulse. Current price action suggests the market may be forming a retest of that breakout zone.
On the weekly timeframe, price is trading below both the 50-EMA and 200-EMA, signaling potential continuation to the downside before buyers regain momentum. MACD and RSI both point lower, supporting the expectation of a pullback. A reaction around the weekly RSI 30 zone is likely.
A bull flag structure is developing. The corrective move is slower than the preceding impulse, indicating buyers are consolidating. If a breakout occurs near the expected zone, the pattern’s measured move suggests a potential rally equal to the height of the flagpole, aligning closely with the next major resistance level.
Another important detail: upward swings inside the channel have progressively shortened, signaling weakening seller control and an increasing breakout probability.
Selling volume has also decreased week-over-week, and the company’s latest report came out positive, adding additional bullish context once the correction completes.
Overall, the base scenario: further downside into the retest area, followed by a potential bullish breakout if the flag pattern confirms.
$DISA multi-year technical review of NYSE:DIS reveals a compelling narrative of a stock emerging from a prolonged period of consolidation. After a significant decline from its all-time highs, the stock appears to be building a substantial base, showing early technical signs of a potential major trend reversal.
1. The Macro Picture: A Multi-Year Consolidation Phase
The most prominent feature on the NYSE:DIS chart is its extensive consolidation phase, spanning approximately three years. This extended period of sideways price action following a prior downtrend is classically interpreted as a "re-accumulation" phase. During this time, the stock has been establishing a clear and well-defined trading range, effectively building a new foundation for its next significant directional move. The longer the base, the more potent the eventual breakout tends to be.
2. Defining the Battle Lines: Support and Resistance
Within this multi-year range, clearly defined support and resistance levels have emerged. Your observation that these lines "look promising" is astute, as the repeated testing of these boundaries strengthens their technical significance.
The resistance level represents a price ceiling that has contained several rally attempts over the years. A decisive break above this level would be a powerful bullish signal.
The support level has acted as a durable floor, preventing further decline and indicating persistent buying interest at these lower prices.
The convergence of this long-term base with these clear technical boundaries creates a "compression" effect, suggesting that a decisive breakout is increasingly probable.
3. Fibonacci Framework: Mapping the Recovery Path
The application of a Fibonacci retracement tool, drawn from the key swing high to the subsequent major low, provides a mathematical roadmap for potential recovery targets. The price action has already successfully navigated through the initial, shallower retracement hurdles, indicating building momentum.
Levels Conquered: The stock has already surpassed the 0.236 ($114.17) and 0.382 ($107.66) Fibonacci levels. This is a constructive sign, demonstrating that buyers are capable of pushing the price through increasingly significant resistance zones.
Future Profit-Taking Targets: The path ahead is now focused on the next tiers of Fibonacci resistance. These levels serve as logical areas where profit-taking can be expected and where the next battles between bulls and bears will occur. Our key upside targets are now:
Primary Target (0.50): $102.40 - A psychologically important level often associated with a 50% recovery of the prior decline.
Secondary Target (0.618): $97.13 - The classic "golden ratio" retracement, a common target for a strong trend reversal.
Extended Target (0.786): $89.64 - This level represents a deep retracement and would signal a very powerful bullish reversal, bringing the stock close to a full recovery of its prior downtrend.
Synthesis and Strategic Outlook
In summary, NYSE:DIS is at a critical technical juncture. The stock is no longer in a freefall but has spent years building a base, indicating a potential regime change from bearish to bullish.
The Bullish Thesis: The successful breach of the initial Fibonacci levels, while respecting the long-term support, suggests underlying strength. A confirmed breakout above the multi-year resistance would signal the start of a new, sustained uptrend, with targets projected toward the $89 - $102 zone.
Key Triggers to Watch:
Confirmation: A sustained breakout above the multi-year resistance level on high volume.
Invalidation: A breakdown below the established long-term support, which would suggest the consolidation was a continuation pattern instead of a reversal base.
The promising support and resistance structure, combined with the progressive climb through Fibonacci levels, positions NYSE:DIS as a stock to watch closely for a potential major bullish move, with a clear roadmap for profit-taking at defined technical targets.

Disney May Face DownsideWalt Disney spent months in a narrow range, and now some traders may see downside risk.
The first pattern on today’s chart is the $108.66 level. It was the low on May 12 after positive trade news drove the broader market higher. The media giant stayed above that price until last Thursday, when it crossed below it on heavy volume. Has support broken?
Second, DIS spent months in a narrow range before the move. Escaping that pattern may increase the potential for a move.
Third, prices are now below the 50- and 200-day simple moving averages.
Next, some traders may view the May 7 price gap below $100 as a potential area to revisit.
Finally, DIS hasn’t made a new 52-week high since June 30 or a new all-time high since March 2021. That may reflect relative weakness when contrasted with the broader market’s strength over the same period.
TradeStation has, for decades, advanced the trading industry, providing access to stocks, options and futures. If you're born to trade, we could be for you. See our Overview for more.
Past performance, whether actual or indicated by historical tests of strategies, is no guarantee of future performance or success. There is a possibility that you may sustain a loss equal to or greater than your entire investment regardless of which asset class you trade (equities, options or futures); therefore, you should not invest or risk money that you cannot afford to lose. Online trading is not suitable for all investors. View the document titled Characteristics and Risks of Standardized Options at www.TradeStation.com . Before trading any asset class, customers must read the relevant risk disclosure statements on www.TradeStation.com . System access and trade placement and execution may be delayed or fail due to market volatility and volume, quote delays, system and software errors, Internet traffic, outages and other factors.
Securities and futures trading is offered to self-directed customers by TradeStation Securities, Inc., a broker-dealer registered with the Securities and Exchange Commission and a futures commission merchant licensed with the Commodity Futures Trading Commission). TradeStation Securities is a member of the Financial Industry Regulatory Authority, the National Futures Association, and a number of exchanges.
TradeStation Securities, Inc. and TradeStation Technologies, Inc. are each wholly owned subsidiaries of TradeStation Group, Inc., both operating, and providing products and services, under the TradeStation brand and trademark. When applying for, or purchasing, accounts, subscriptions, products and services, it is important that you know which company you will be dealing with. Visit www.TradeStation.com for further important information explaining what this means.

DISDisney rejecting the top of its range ($120). Based on historical price action, easily could see the bottom of the range again in time (~$85). There is also some Classic bearish divergence on the weekly time frame. Same price as it was in 2015. No bueno.

Walt Disney Signs Multi-Year Deal With YouTube - Where Next?The Walt Disney Company has announced a major multi-year distribution agreement with YouTube TV, expanding access to Disney’s broad entertainment, sports, and news portfolio. The deal restores all Disney-owned networks—including ESPN, ABC, FX, Freeform, Disney Channel, and National Geographic—to YouTube TV subscribers, resolving a blackout that briefly affected viewers earlier in the week.
A central highlight of the agreement is the inclusion of ESPN’s new direct-to-consumer service, ESPN Unlimited, at no extra cost for YouTube TV customers. Subscribers will also gain access to a selection of its live and on-demand content directly within the YouTube TV interface. The two companies also plan to integrate Disney+, Hulu, and genre-specific network bundles into select YouTube offerings, giving users more flexibility in how they access Disney content.
Disney’s leadership emphasized that this deal reflects the company’s strategy to evolve alongside shifting viewing habits as streaming and hybrid distribution become the core of modern media consumption. The restored networks arrive just in time for major live sports programming, particularly college football, which historically drives high viewership and subscription engagement.
Technical Outlook
From a technical perspective, Disney’s stock has been in a prolonged range since August 2022, trading between a low of $78 and resistance at $120 following its steep decline from the $203 peak in March 2021. In June 2025, price was rejected at the $120 zone once again, reinforcing it as a strong resistance level. The stock is now sliding back toward the $78 support region.
For traders, the key setup remains a breakout. A move above $120 could open the door for momentum-driven buying and a potential recovery back toward historical highs. Conversely, a breakdown below $78 would signal renewed weakness. This new YouTube partnership, however, could provide the fundamental catalyst needed to push price out of its multi-year consolidation.

DISNEY STOCK GOES MICKEY MOUSE'D, FALLS UNDER 52-WEEK SMA AGAINDisney (DIS) stock fallen under its major support of 52-week SMA Thursday, immediately after the company reported mixed fourth quarter results on November 13, 2025 as continued declines in its linear TV business offset strength in parks and streaming.
Disney reported revenue of $22.46 billion for the quarter, missing analyst expectations of $22.83 billion and coming in roughly comparable to the year-earlier period.
A 6% revenue drop within the company's entertainment division, which includes its streaming, TV, and theatrical businesses, contributed to the top-line miss. Linear network revenue fell 16% year over year, while operating income dropped 21% as cord-cutting accelerated and ad dollars continued to shift toward streaming.
The results came in the final stretch of CEO Bob Iger’s turnaround ahead of his planned departure next year.
The company said the decline in operating income was driven in part by the sale of its Star India assets, which contributed $84 million to results a year ago. Domestic linear networks also came under pressure from lower advertising tied to weaker viewership and a $40 million decline in political ad spending compared to the prior-year quarter.
Disney also faced weaker theatrical comparisons in the period, adding to the drag on overall Entertainment results.
We still consider to achieve our initial target i.e. fill the gap around $92.17 per share (see relative ideas).
--
Best wishes,
@PandorraResearch Team

Disney Wave Analysis – 14 November 2025
- Disney falling inside impulse wave (1)
- Likely to fall to support level 100.00
Disney continues to fall inside the wide weekly sideways price range from the middle of 2022, as can be seen from the weekly Disney chart below.
The price earlier broke below the support level 110.00 (which stopped the previous impulse wave i) – which accelerated the active impulse wave (1).
Given the long-term downtrend, Disney can be expected to fall further in the active impulse wave (1) to the next round support level 100.00.

DISNEY STOCK GOTTA GO TO TRAMPLING AS 2026 NEARSDisney stock faces several bearish pressures likely to persist through the end of 2025. The company is contending with declining subscriber growth for Disney+, which has seen a drop of 700,000 subscriptions amid stiff competition and price increases. Advertising revenues remain under pressure, and consumer spending shifts post-pandemic have made the theme parks’ revenue outlook ambiguous. Structural vulnerabilities, such as weak liquidity—a current ratio of just 0.72—and low momentum after Q3 2025, underline financial fragility despite revenue increases.
Additionally, Disney’s brand is exposed to risks from ongoing political polarization, which was highlighted by market reactions to high-profile controversies and programming changes in 2025. The rollback of DEI policies may increase near-term stability but risks alienating younger demographics, putting long-term brand equity at risk. Analysts project an overall bearish trend, with some forecasts predicting a correction phase and a year-end share price between $95 and $109 as negative momentum persists despite isolated rebounds.
Finally, Disney shares have underperformed broader market indices in 2025, dropping about 9% in the face of tariff threats and investor uncertainty under President Trump’s administration, making the short-term investment case weak compared to industry peers.
In technical words, Disney stock shined bright in May and June, 2025 but then later (after many bearish attempts) turned back to major support 26-week SMA (100-day low), shed positive intra year returns back to flat line.
Well, in any case of 26-week SMA breakthrough we still consider to achieve our initial target i.e. fill the gap around $92.17 per share (see relative idea).
--
Best wishes,
@PandorraResearch Team
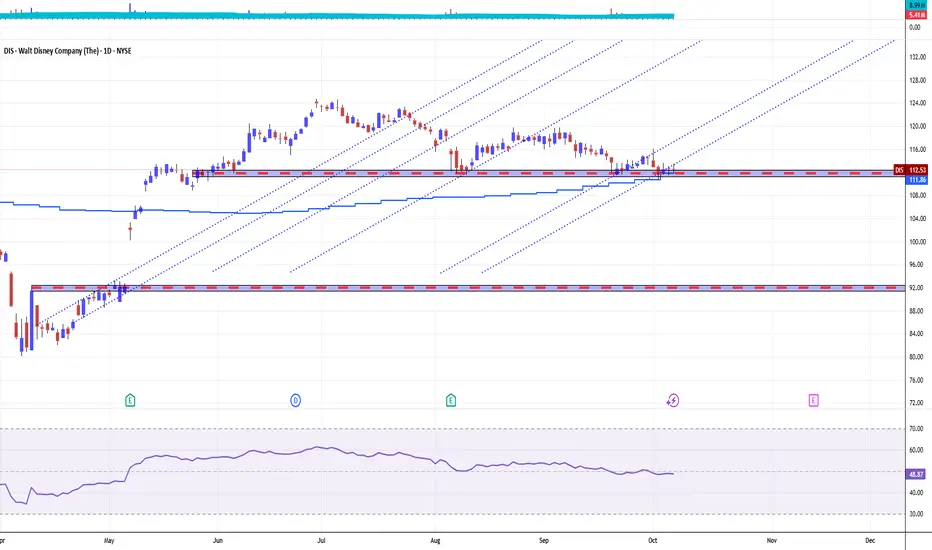
DIS FLAG BREAKOUTBouncing off the 40-week EMA, DIS broke out of a flag, just one day before the Qtr earnings. Pending the Qtr results, this could mean the start of a new leg up.
$DIS - Disney Before Earnings Disney earnings report coming out soon. Analysts are expecting a growth in revenue $22.75Billion to $22.90Billion (around 1% over year growth).
Stocks currently above a nice support zone $112-$114 area and momentum indicators showing bullish trend continuation.
-------------------------------------------------------------------------------------------
Disclaimer:
I do not provide personal investment advice and I am not a qualified licensed investment advisor. I am an amateur investor.
All information found here, including any ideas, opinions, views, predictions, forecasts, commentaries, suggestions, or stock picks, expressed or implied herein, are for informational, entertainment or educational purposes only and should not be construed as personal investment advice. While the information provided is believed to be accurate, it may include errors or inaccuracies. I will not and cannot be held liable for any actions you take as a result of anything you read here.
Conduct your own due diligence, or consult a licensed financial advisor or broker before making any and all investment decisions. Any investments, trades, speculations, or decisions made on the basis of any information found on here, expressed or implied herein, are committed at your own risk, financial or otherwise.
Feel free to give us a follow and shoot us a like for more analysis updates.

Disney Is Up Just 4% YTD. What Its Chart Says Ahead of EarningsWalt Disney Co. NYSE:DIS plans to release fiscal Q4 results this week at a time when the stock has risen just 4% this year and trails the S&P 500 SP:SPX in timeframes ranging from three months to five years. Let's see what the entertainment giant's chart and fundamental analysis say.
Disney's Fundamental Analysis
The "House of Mouse" plans to roll out results ahead of the opening bell on Thursday for the three months ended roughly Sept. 30.
Wall Street expects DIS to report an adjusted $0.85 per fully diluted share on about $22.8 billion of revenue for the period. That would represent a 25.4% drop from the $1.14 in adjusted EPS the company earned in the same period last year, while revenue would have grown 0.9% from the $22.6 billion DIS recorded in fiscal Q4 2024.
In fact, only three of the 22 sell-side analysts that I know of that cover Disney have revised their earnings estimates higher since the quarter began, while 13 have cut their numbers. (The remaining six analysts made no changes.)
But beyond analysts, many economists will also be watching Disney's earnings for signs of the U.S. consumer's financial health.
After all, Disney's results could serve as an economic bellwether given that consumers might splurge on the company's theme parks and movies -- or skip them altogether depending on someone's individual finances.
So far, signs for the overall leisure-and-hospitality sector aren't all that encouraging, with the most recent employment reports showing decreased labor demand across the segment.
Disney's Technical Analysis
Now check out Disney's chart going back some five months and running through Friday afternoon:
Readers will first note that DIS peaked early this summer, creating a double-top pattern of bearish reversal marked with a jagged red line and red box at left above.
The stock then went into a long falling-wedge pattern, marked with blue diagonal lines and a blue box in the chart's center and right. This is considered a pattern of bullish reversal, but the falling wedge's two trendlines appear to be coming together only very slowly.
As Disney shares have worked their way lower over the past 4+ months, the stock has appeared to hit resistance at its 50-day Simple Moving Average (or "SMA," denoted by a squiggly blue line). However, the stock seems to have also found support at Disney's 200-day SMA (the red squiggly line above).
Looking at the secondary technical indicators that I most often follow, Disney's Relative Strength Index (the gray line at the chart's top) has been weak, but continues to work its way towards something closer to neutral.
Meanwhile, the stock's daily Moving Average Convergence Divergence indicator (or "MACD," marked with black and gold lines and blue bars at the chart's bottom), isn't saying much at all. The histogram of the stock's 9-day Exponential Average (or "EMA," marked with blue bars) seems to be sitting very close to zero and never straying very far.
Similarly, Disney's 12-day EMA (the black line) and 26-day EMA (the gold line) appear to be running together. The bulls would be rooting for the black line to overtake the gold line, but the fact that it hasn't (and that both of them are running below zero) is mildly bearish.
An Options Option
As I write this, the options market looks to be pricing in an approximate 7% move for Disney's stock following its upcoming earnings.
Options traders with no directional bias might employ what's called a "short strangle" in this scenario because they're hoping to take advantage of so-called "intrinsic-value crush (or "IV crush").
These traders are selling potentially unlimited risk for a premium, and are willing to take a short or long equity position should the stock move more than expected. Here's an example:
-- Sell (write) one DIS $119 call with a Nov. 14 expiration date (i.e., after this week's earnings come out). This was priced at about $1.36 as I wrote this column.
--- Sell (write) one DIS Nov. 14 $103 put for roughly $1.33.
Net Credit: $2.69.
This example has three potential outcomes at expiration:
-- Should the stock's price end up between $103 and $119 at expiration, the trader would simply pocket the $2.69 net credit.
-- Should Disney trade above $119 at expiration, the trader would end up short 100 DIS shares at a $121.69 net basis.
-- Should the stock trade at or below $103 at expiration, the trader would end up long 100 DIS shares at a $100.31 net basis.
(Moomoo Technologies Inc. Markets Commentator Stephen "Sarge" Guilfoyle had no position in DIS at the time of writing this column.)
This article discusses technical analysis, other approaches, including fundamental analysis, may offer very different views. The examples provided are for illustrative purposes only and are not intended to be reflective of the results you can expect to achieve. Specific security charts used are for illustrative purposes only and are not a recommendation, offer to sell, or a solicitation of an offer to buy any security. Past investment performance does not indicate or guarantee future success. Returns will vary, and all investments carry risks, including loss of principal. This content is also not a research report and is not intended to serve as the basis for any investment decision. The information contained in this article does not purport to be a complete description of the securities, markets, or developments referred to in this material. Moomoo and its affiliates make no representation or warranty as to the article's adequacy, completeness, accuracy or timeliness for any particular purpose of the above content. Furthermore, there is no guarantee that any statements, estimates, price targets, opinions or forecasts provided herein will prove to be correct.
Options trading is risky and not appropriate for everyone. Read the Options Disclosure Document ( j.moomoo.com ) before trading. Options are complex and you may quickly lose the entire investment. Supporting docs for any claims will be furnished upon request.
Options trading subject to eligibility requirements. Strategies available will depend on options level approved.
Maximum potential loss and profit for options are calculated based on the single leg or an entire multi-leg trade remaining intact until expiration with no option contracts being exercised or assigned. These figures do not account for a portion of a multi-leg strategy being changed or removed or the trader assuming a short or long position in the underlying stock at or before expiration. Therefore, it is possible to lose more than the theoretical max loss of a strategy.
Moomoo is a financial information and trading app offered by Moomoo Technologies Inc. In the U.S., investment products and services on Moomoo are offered by Moomoo Financial Inc., Member FINRA/SIPC.
TradingView is an independent third party not affiliated with Moomoo Financial Inc., Moomoo Technologies Inc., or its affiliates. Moomoo Financial Inc. and its affiliates do not endorse, represent or warrant the completeness and accuracy of the data and information available on the TradingView platform and are not responsible for any services provided by the third-party platform.

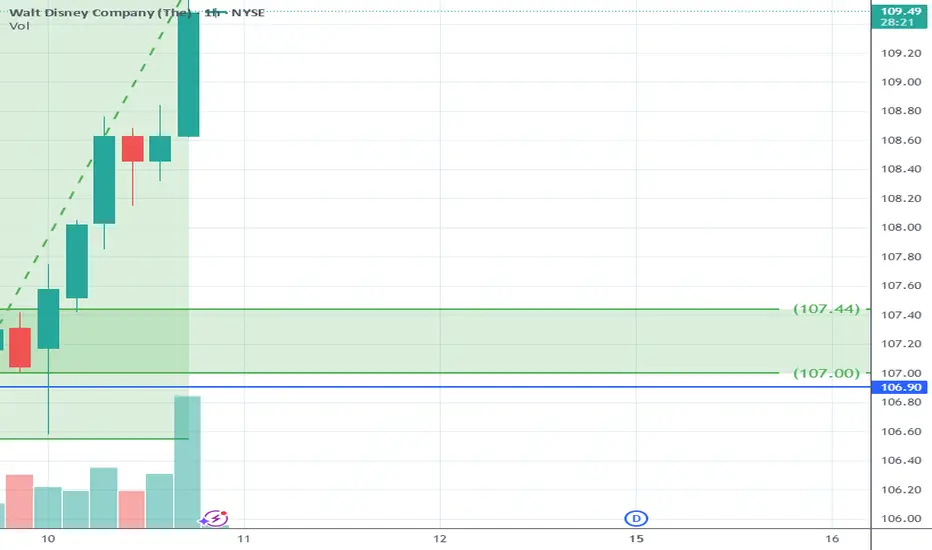
Earnings,MACD,And Candlesticks-Top 3 Catalysts That Give SignalsSo in this chart NYSE:DIS we are using
👉MACD
👉Earnings Report
👉Multi-time frame
👉Candlestick Analysis
What you need know:
-
Earnings are a catalyst to price gaps also MACD shows you buying momentum.
-
Also understand candlesticks give early signals.
-
The problem is the the light green MACD histogram on the 1H chart.
-
Also another challenge will be the broker executing the buy limit order.
-
If the broker doesn't execute your limit order don't try to. Hsse the position just let it go.
Because a buying opportunity is just around the corner.
If the price goes in the opposite direction, make you reserve 50% of your capital when you enter your
Trade .For example is you have $100 only trade $50.
This is part of risk management later when you gain experience you can increase your position size.
Am using Candlesticks, MACD, and MACD histogram.
This is my trading system.
Questions 🤔
👉What are multi time frame trading strategies?
👉What makes earnings report catalysts?
👉What is the MACD Histogram?
Leave your answers below..
Disclaimer ⚠️ Trading is risky please learn about risk management and profit taking strategies.
Also feel free to use a simulation trading account before you use real money.

DIS: Monthly and Earnings!My thoughts on DIS for the month and its earnings release next week.
Just thoughts, not advice of course.
Thanks for watching!

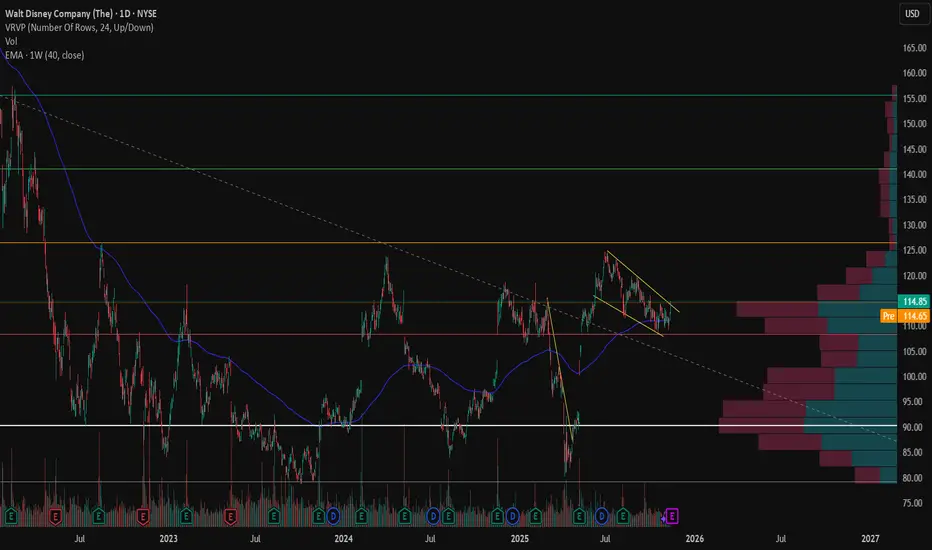
Flagging, Sitting on the 200-Day SMANYSE:DIS is at a critical technical junction:
It’s holding the 200-day MA, a key long-term support.
The descending channel suggests continued short-term pressure, but a breakout above $113–114 could confirm reversal momentum.
A bullish case would require a breakout above the upper blue trendline with volume.
A bearish continuation would be confirmed if price loses the $108–110 support area.
Will be watching

DIS | A Possible Bull Flag On Disney | LONGThe Walt Disney Co. engages in the business of international family entertainment and media enterprise. It owns and operates television and radio production, distribution and broadcasting stations, direct-to-consumer services, amusement parks, and hotels. It operates through the following business segments: Disney Entertainment, ESPN, and Disney Parks, Experiences, and Products. The company was founded by Walter Elias Disney on October 16, 1923 and is headquartered in Burbank, CA.

DIS Falling WedgeDis rallied from April '25 until July '25 and then consolidated around $120, forming a bullish falling wedge. The red line is the 200-day moving average which is acting as support at $110. It has been bounced off twice. The seasonals look bullish going into the last 2 months of the year when considering 2023 and 2024 price movement. The P/E ratio is 17.66 which is almost a 3rd of its 2-year moving average which is 47.43, indicating a low valuation with lots of room for upside. The aqua line is the 50-day sma which needs to be closed beyond along with the top side of the rising wedge before this thing can really take off. Fundamentals look bullish as well, with an uptrend in annual revenue growth and downtrend in debt/equity.

Disney's Possible Swing SetupHi Traders!
As I analyze Disney, I am seeing it's in a counter trend on the 24HR with a resistance at $120. I'm staying patient watching to see how far price will retrace with a 24HR CHOCH sitting at around $102.50. That seems far away, but that would help fill in some of the gap, and give a nice set up for a reversal. In addition, there are 4 days left in the current Monthly candle, and they've been closing small. IMO that could indicate that price could eventually make it to $130.
For now, I have alerts set and I'm planning to take a long swing.
Let me know what you guys think in the comments! Good luck!
*DISCLAIMER: I am not a financial advisor. The ideas and trades I take on my page are for educational and entertainment purposes only. I'm just showing you guys how I trade. Remember, trading of any kind involves risk. Your investments are solely your responsibility and not mine.*
