EBAY QuantSignals V3 Swing 2025-11-05EBAY QuantSignals V3 Swing 2025-11-05
EBAY Swing Signal | 2025-11-05
• Direction: BUY PUTS | Confidence: 60%
• Horizon: 16 days to 2025-11-21
• Strike Focus: $80.00
• Entry Range: $1.81
• Target 1: $2.70
• Stop Loss: $1.30
• 1W Move: -0.71%
• 2W Move: -10.78%
• Volume vs Prior Swing: 1.6×
• Swing Range: $79.11 - $91.91
• ⚠️ MODERATE RISK WARNING: Consider reducing position size due to moderate confidence level.
⚖️ Compliance: Educational swing commentary for QS Premium. Not financial advice.
🎯 TRADE RECOMMENDATION
Direction: BUY PUTS
Confidence: 60%
Conviction Level: MEDIUM
🧠 ANALYSIS SUMMARY
Katy AI Signal: NEUTRAL with 50% confidence, but provides specific bearish targets ($86.32 target vs $79.46 stop loss) - directional bias suggests potential downside with weak technical positioning
Technical Analysis: Strong bearish momentum with -11.75% daily decline, price at 12.2% of swing range near support at $79.11, all EMAs aligned bearish, MACD bearish, weak trend strength
News Sentiment: Mixed with recent downgrades (UBS lowers target to $95) but some positive analyst coverage (Truist raises to $92, Benchmark maintains $110), overall moderate bearish impact from recent large-cap loser status
Options Flow: Put/Call ratio of 0.68 indicates bullish flow bias, but unusual activity at $84 calls suggests potential resistance level - institutional positioning shows defensive hedging
Risk Level: ELEVATED - extreme daily move may lead to oversold bounce, neutral Katy signal limits conviction
💰 TRADE SETUP
Expiry Date: 2025-11-21 (16 days)
Recommended Strike: $80.00
Entry Price: $1.74 - $1.87
Target 1: $2.70 (50% gain from entry)
Target 2: $3.50 (90% gain from entry)
Stop Loss: $1.30 (25% loss from entry)
Position Size: 2% of portfolio
⚡ COMPETITIVE EDGE
Why This Trade: Combines extreme oversold conditions with clear technical breakdown below key levels, offering favor
Image
QS Analyst
APP
— 11:16 AM
able risk/reward despite Katy's neutral stance
Timing Advantage: Entry after -11.75% daily decline reduces immediate downside risk while capturing potential continuation of bearish momentum
Risk Mitigation: Tight stop loss protects against oversold bounce, strike selection at current price level provides balanced delta exposure
🚨 IMPORTANT NOTES
Katy AI shows NEUTRAL confidence (50%) - trade qualifies but requires caution
Extreme daily move increases volatility risk - position size should be conservative
Monitor $79.11 swing low as critical support level - break below would confirm bearish continuation
Consider scaling into position given elevated volatility environment
📊 TRADE DETAILS 📊
🎯 Instrument: EBAY
🔀 Direction: BUY 📈
🎯 Strike: 80.00
💵 Entry Price: 1.81
🎯 Profit Target: 2.70
🛑 Stop Loss: 1.30
📅 Expiry: 2025-11-21
📏 Size: 2.0
📈 Confidence: 60%
⏰ Entry Timing: N/A
🕒 Signal Time: 2025-11-05 14:16:11 EST
⚠️ MODERATE RISK WARNING: Consider reducing position size due to moderate confidence level.
Trade ideas

eBay: Confirming Wave [ii] Top Right on ScheduleeBay rallied once again to test resistance at $101.15, but quickly reversed with sharp sell-offs, confirming the top of magenta wave in a timely manner. Since then, the stock has moved as anticipated below the $86.36 level and now appears poised for further declines as part of wave . The subsequent wave- corrective move higher should remain capped below $86.36, allowing wave to complete turquoise wave 1 at a lower level—though still above $55.96.

EBAY Wave Analysis – 30 October 2025
- EBAY broke support zone
- Likely to fall to support level 80.00
EBAY today opened with the sharp downward gap which broke the support zone between the support level 87.00 (which stopped multiple downward corrections from September) and the 50% Fibonacci correction of the upward impulse from June.
The breakout of this support zone accelerated the active intermediate ABC correction from the key resistance level 101.00.
EBAY can be expected to fall further toward the next support level 80.00 (former resistance from June).

EBAY | This Retail Business Will BOOM | LONGeBay, Inc. is a commerce company, whose platforms include an online marketplace and its localized counterparts, including off-platform businesses in South Korea, Japan, and Turkey, as well as eBay's suite of mobile apps. It offers a platform for various product categories, including parts and accessories, collectibles, fashion, electronics, and home & garden. eBay generates revenue mainly through fees from sales, payment processing, and advertising. The company was founded by Pierre Morad Omidyar in September 1995 and is headquartered in San Jose, CA.

Ebay Wave Analysis – 14 October 2025
- Barclays reversed from key support level 87.00
- Likely to rise to resistance level 94.20
Ebay recently reversed from the support area between the key support level 87.00 (lower boundary of the sideways price range from August), lower daily Bollinger Band and the 50% Fibonacci correction of the upward impulse from June.
The upward reversal from this support area created daily Japanese candlesticks reversal pattern Hammer.
Given the clear daily uptrend, Ebay can be expected to rise to the next resistance level 94.20 (which stopped earlier waves a and B).

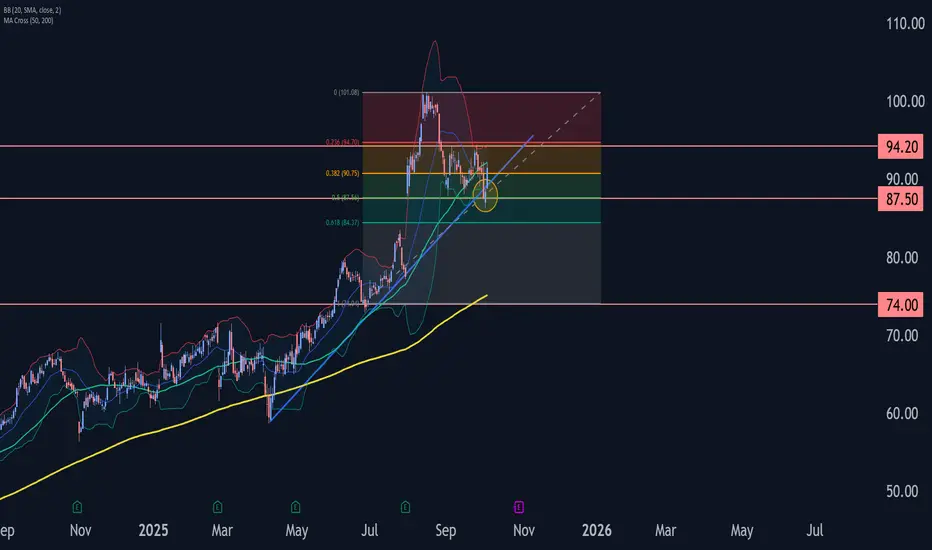
Ebay Wave Analysis – 2 October 2025
- Ebay reversed from support level 87,50
- Likely to rise to resistance level 94.20
Ebay recently reversed up from the support area between the support level 87,50 (low of the previous wave A from the start of September) and the lower daily Bollinger Band.
The support level 87,50 was strengthened by the 50% Fibonacci correction of the previous sharp upward impulse 5 from June and by the support trendline from April.
Given the clear daily uptrend, Ebay can be expected to rise to the next resistance level 94.20 (which stopped earlier waves B and ii).
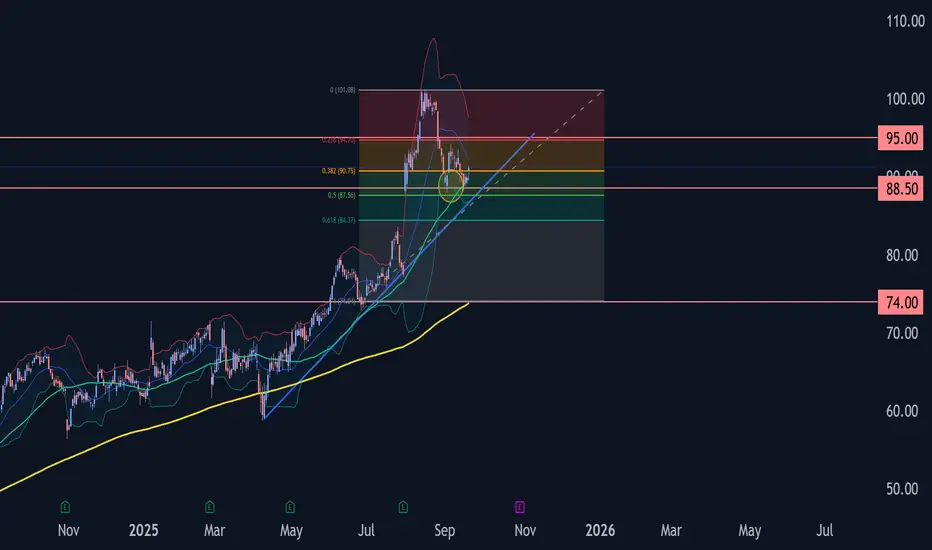
Ebay Wave Analysis – 19 September 2025- Ebay reversed from support zone
- Likely to rise to resistance level 95.00
Ebay recently reversed up from the support zone between the key support level 88.50 (which stopped the previous wave (A) at the start of September).
The support level 88.50 was further strengthened by the lower daily Bollinger Band, 50% Fibonacci correction of the upward impulse wave (5) from June and the support trendline from April.
Given the clear daily uptrend, Ebay can be expected to rise to the next resistance level 95.00 (which stopped the previous correction (B)).
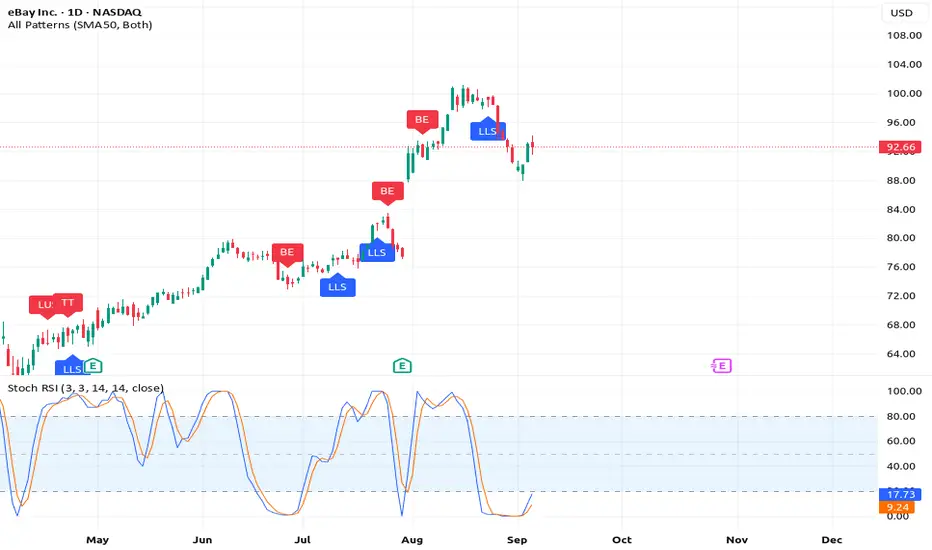
How To Boost The 3-Step Rocket Booster Strategy Using StochasticAm so tired right now and i feel so sad.
How do you feel?
When it comes to trading your feelings dont matter
what matters is your technical analysis.
These past days i kept reading the book
by Steve on candlestick charting
And comparing
to the technical skills i already know.
It took me about 3 years to learn technical analysis so if you
are starting dont give up.
Finding this stock NASDAQ:EBAY was not easy at all.
I had to refine and digest my trading strategies.
I kept studying and refining
my trading strategies.
Its not easy but its worth it.Thats all i
have been doing these past days
Just studying trading.
By the way that's a spinning black top
And its above the Rocket booster strategy
Also notice the crossover below?
Rocket boost this content to learn more.
Disclaimer:Trading is risky learn risk management
and profit taking strategies
also use a simulation trading account
before you trade with real money.
eBay - At this high, the air is thinThis overshoot of the U-MLH is a nice opportunity to stalk ebay for a Short-Trade.
1. wait for a close inside the fork
2. expect a test/retest at the U-MLH
3. on a break of a pivot, I enter short.
Profit Target 1 is the Centerline.
Further downside is possible, but has to be shown below the CL.
Happy new week folks §8-)

Ebay Wave Analysis – 13 August 2025
- Ebay broke the round resistance level 100.00
- Likely to rise to resistance 105.00
Ebay recently broke the round resistance level 100.00, the breakout of which was preceded by the breakout of the resistance trendline of the daily up channel from April.
The breakout of these price levels accelerated the active impulse wave 5, which is part of the intermediate impulse wave (C).
Ebay can be expected to rise to the next resistance, 105.00, which is the target price for the completion of the active impulse wave.

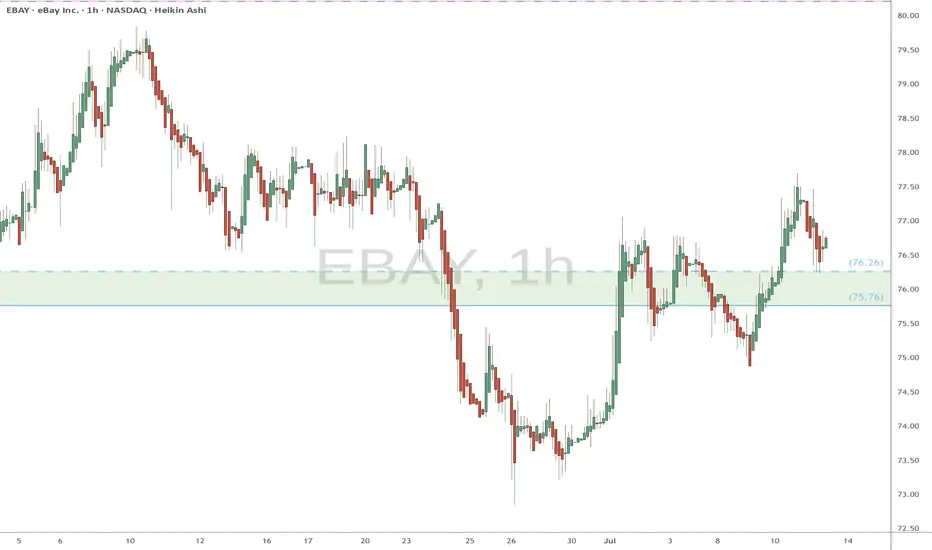
EBAY watch $75.76-76.26: Key Support zone to launch next Leg UP EBAY trying to get back above its ATH from 2021.
Now testing a key support zone at $75.76-76.26.
Good but late long entry with StopLoss just below.
.
See "Related Pubications" for previous charts such as THE BOTTOM call:
Hit the BOOST and FOLLOW for more PRECISE and TIMELY charts.
=========================================================
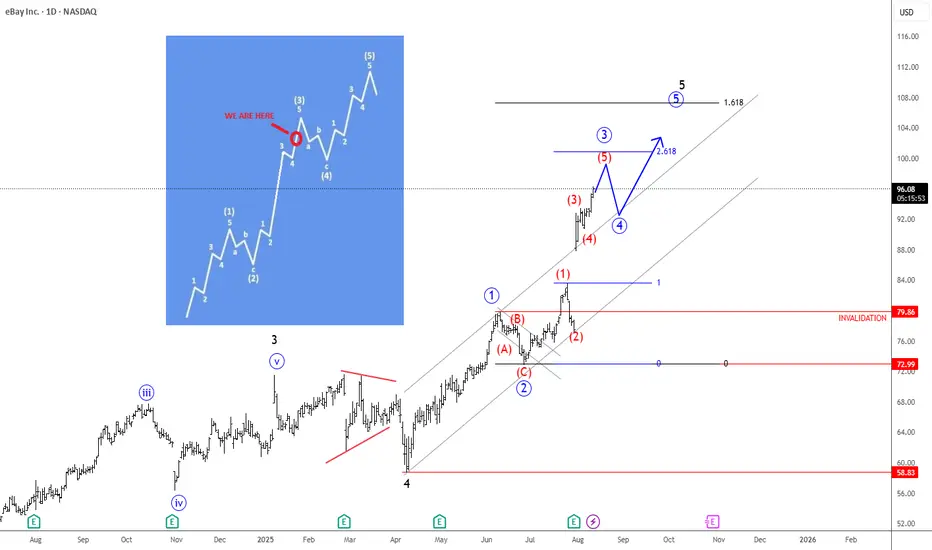
Ebay Extends The Rally; Pointing To 100 AreaEbay Extends The Rally within an impulse, which can push the price up to 100 area from technical and Elliott wave perspective.
Ebay is extending strongly higher after beating earnings at the end of July, which we see it as a wave 3 of an ongoing five-wave bullish impulse. Currently it can be trading in subwave (5) of 3 that can stop around 100 area, and from where we may see a new corrective pullback in wave 4, as eBay executives sell shares worth over 5.5million. So soon watch out for a new higher degree wave 4 pullback before the bullish trend for wave 5 resumes.
A bullish impulse in Elliott Wave Theory is a five-wave upward movement showing strong trend momentum. Wave 1 starts the advance, Wave 2 corrects part of it, Wave 3 is the longest and most powerful leg, Wave 4 consolidates without overlapping Wave 1, and Wave 5 is the final push before a larger correction. The key rules are: Wave 2 never fully retraces Wave 1, Wave 3 is never the shortest, and Wave 4 doesn’t enter Wave 1’s price zone. This pattern reflects shifting market psychology from early accumulation to final optimism.
EBAY Aggressive Pullback Setup to Deeper SupportsEBAY closed at $95.30 (+2.32%), up 22.33% over 1M, with RSI(14) at 78.55 signaling overbought exhaustion. Stochastic likely >80, ADX >25 trend intact, but price above upper BB after breaking 92 resistance. Recent all-time high near 93.50 (Aug 8) extended to 95+, but post-CPI inflation (core 3.0% YoY) and tariff risks could trigger a deeper correction in e-commerce. Analyses show potential downside to lower pivots.
Chart Analysis:
Strong uptrend from $72 support, but RSI divergence emerging. Bollinger Bands widening on volatility.
Key levels: Resistance at $97 (pivot high), deeper support at $85 (61.8% Fib from recent low, near older Bollinger lower ~$78 adjusted).
Trade Idea: Short
Entry: Below $94 (break of intraday support).
Target: $85 (deeper Fib/pivot support for extended pullback).
Stop Loss: $96 (tighter above today's high for reduced risk).
Risk: ~$2 (94 to 96), Reward: ~$9 (94 to 85), R/R: 1:4.5. Scale out at $88 if momentum fades early.
Tariffs hitting eBay harder? #EBAY #Overbought #Pullback #Ecommerce

Ebay Wave Analysis – 24 July 2025
- Ebay broke round resistance level 80.00
- Likely to rise to resistance level 84.00
Ebay recently broke the round resistance level 80.00 (which stopped the previous intermediate impulse wave (5) at the start of June, as can be seen below).
The breakout of the resistance level 80.00 accelerated the active minor impulse wave 3 – which belongs to the intermediate impulse wave (3) from the start of July.
Given the clear daily uptrend, Ebay can be expected to rise to the next resistance level 84.00 (target price for the completion of the active minor impulse wave 3).

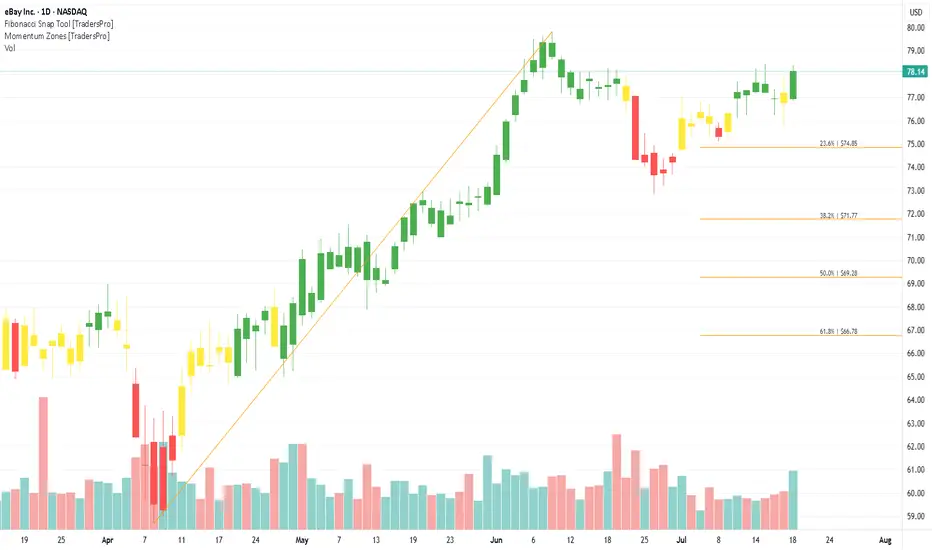
eBay Inc. (EBAY) Thrives on Niche Buyer DemandeBay Inc. (EBAY) is a global e-commerce marketplace connecting millions of buyers and sellers across a wide range of categories, from collectibles and electronics to fashion and home goods. Known for its auction-style listings and fixed-price options, eBay offers a flexible, user-driven shopping experience. The company’s growth is driven by increasing online retail demand, global expansion, and a strong focus on niche and enthusiast categories.
On the chart, a confirmation bar with rising volume shows renewed buying momentum. The price has entered the momentum zone by breaking above the .236 Fibonacci level. A trailing stop can be placed just below that level using the Fibonacci snap tool to protect gains while giving the trade room to run.
Ebay Wave Analysis – 18 July 2025
- Ebay rising inside impulse wave (3)
- Likely to rise to resistance 80.00
Ebay continues to rise inside the impulse wave (3) of the long-term upward impulse wave 3 from the end of June.
The active long-term impulse wave 3 started earlier from the support zone between the support level 74.00, upper trendline of the recently broken up channel from November and the lower daily Bollinger Band.
Given the clear daily uptrend, Ebay can be expected to rise further to the next resistance 80.00 (monthly high from June and the target for the completion of the active wave (3)).

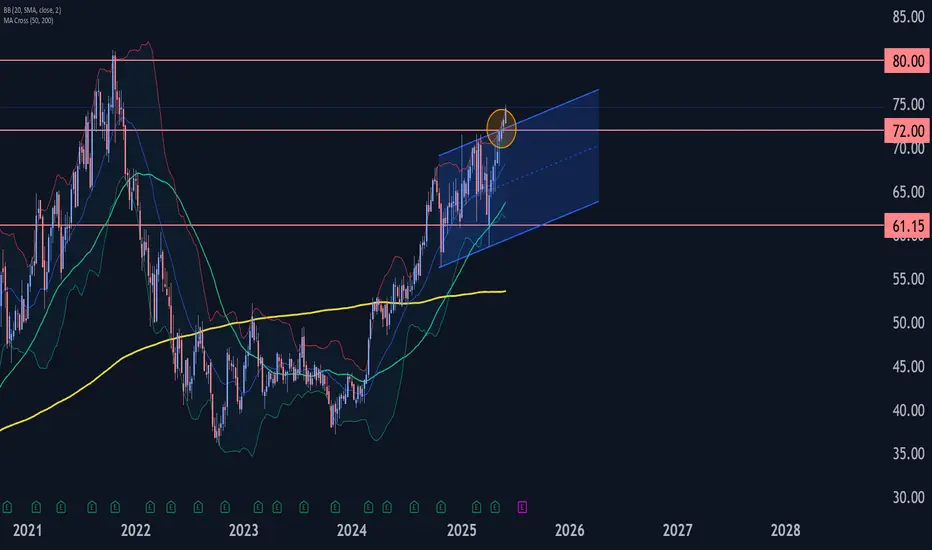
Ebay Wave Analysis – 24 June 2025
- Ebay reversed from long-term resistance level 80.00
- Likely to fall to support level 71.15
Ebay recently reversed down from the resistance area between the major long-term resistance level 80.00 (which started the weekly downtrend in 2021) and the upper weekly Bollinger Band.
The downward reversal from this resistance area created the weekly Japanese candlesticks reversal pattern Shooting Star.
Given the strength of the resistance level 80.00 and the overbought weekly Stochastic, Ebay can be expected to fall to the next support level 71.15 (former resistance from the start of 2025).

EBAY on WatchWatching the pullback here.
Looking for an entry, but not going to try and catch a falling knife.
Why:
Strong uptrend
20EMA is aligning with .5 retracement
Could be low risk high reward depending on entry

ebay is on sale 🛒Hello TradingView Family / Fellow Traders. This is Richard, also known as theSignalyst.
📈 EBAY has exhibited an overall bullish trend , trading above the orange and blue trendlines.
At present, EBAY is undergoing a correction phase and it is currently approaching a strong support zone 30 - 34
🏹 Thus, the highlighted red circle is a strong area to look for buy setups as it is the intersection of the green support and lower blue and orange trendlines acting as a non-horizontal support.
📚 As per my trading style:
As #EBAY approaches the lower red circle zone, I will be looking for bullish reversal setups (like a double bottom pattern, trendline break , and so on...)
📚 Always follow your trading plan regarding entry, risk management, and trade management.
Good luck!
All Strategies Are Good; If Managed Properly!
~Rich

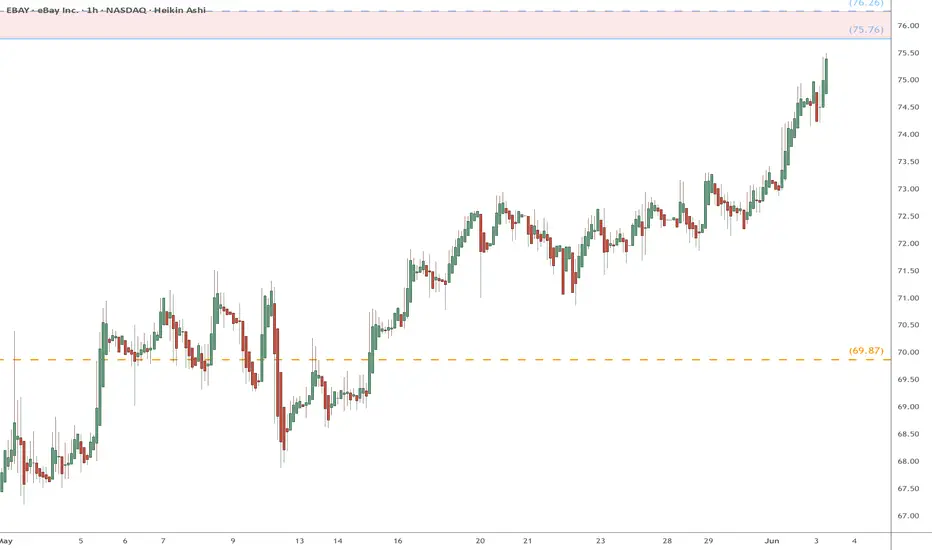
EBAY heads up into $76: Major Resistance zone could mark a TOP EBAY has been relentlessly grinding away Northward.
About to test a serious resistance zone $75.76-76.26
Expecting a dip to possibly the Golden Covid at $69.87
.
Previous Analysis that caught a HUGE breakout:
Ebay Wave Analysis – 2 June 2025
- Ebay broke resistance zone
- Likely to rise to resistance level 80.00
Ebay recently broke the resistance zone between the key resistance level 72.00 and the resistance trendline of the daily Up Channel from last year.
The breakout of this resistance zone accelerated the active weekly impulse wave 3, which belongs to the intermediate impulse wave (3) from 2024.
Given the multiyear uptrend, Ebay can be expected to rise to the next resistance level 80.00 (which stopped the weekly uptrend in 2021).
eBay May Be Breaking OuteBay has quietly snuck to multiyear highs, and some traders may look for further upside.
The first pattern on today’s chart is the February 26 peak of $71.61. At the time, it was the highest level since November 2021. However, EBAY broke it on Friday and continued upward on Monday. That could suggest it’s breaking out.
Second is the April 1 high just below $69. The e-commerce stock struggled to get above it in early May but soon turned the old resistance into new support. That’s potentially consistent with an uptrend.
Next, the 50-day simple moving average (SMA) is above the 100-day SMA. Both are above the 200-day SMA. That sequence, with faster SMAs above slower ones, may reflect a long-term uptrend.
Short-term signals may be similarly positive. For example, the 8-day exponential moving average (EMA) is above the 21-day EMA and MACD is rising.
Check out TradingView's The Leap competition sponsored by TradeStation.
TradeStation has, for decades, advanced the trading industry, providing access to stocks, options and futures. If you're born to trade, we could be for you. See our Overview for more.
Past performance, whether actual or indicated by historical tests of strategies, is no guarantee of future performance or success. There is a possibility that you may sustain a loss equal to or greater than your entire investment regardless of which asset class you trade (equities, options or futures); therefore, you should not invest or risk money that you cannot afford to lose. Online trading is not suitable for all investors. View the document titled Characteristics and Risks of Standardized Options at www.TradeStation.com . Before trading any asset class, customers must read the relevant risk disclosure statements on www.TradeStation.com . System access and trade placement and execution may be delayed or fail due to market volatility and volume, quote delays, system and software errors, Internet traffic, outages and other factors.
Securities and futures trading is offered to self-directed customers by TradeStation Securities, Inc., a broker-dealer registered with the Securities and Exchange Commission and a futures commission merchant licensed with the Commodity Futures Trading Commission). TradeStation Securities is a member of the Financial Industry Regulatory Authority, the National Futures Association, and a number of exchanges.
TradeStation Securities, Inc. and TradeStation Technologies, Inc. are each wholly owned subsidiaries of TradeStation Group, Inc., both operating, and providing products and services, under the TradeStation brand and trademark. When applying for, or purchasing, accounts, subscriptions, products and services, it is important that you know which company you will be dealing with. Visit www.TradeStation.com for further important information explaining what this means.

eBay: Resistance Touched!EBAY has managed to fight its way upward as expected, reaching the resistance at $71.51. In the course of the ongoing (corrective) upward movement, the price has now touched this mark for the third time – and once again showed a pullback reaction. Primarily, the stock should rise above the $71.51 level in the next step to complete the beige wave b above it. However, there remains a 27% chance for a new interim low of the magenta wave alt.(X). In this case, the stock would take a detour below the support at $55.96 but would turn upward again above the lower $49.63 mark.
