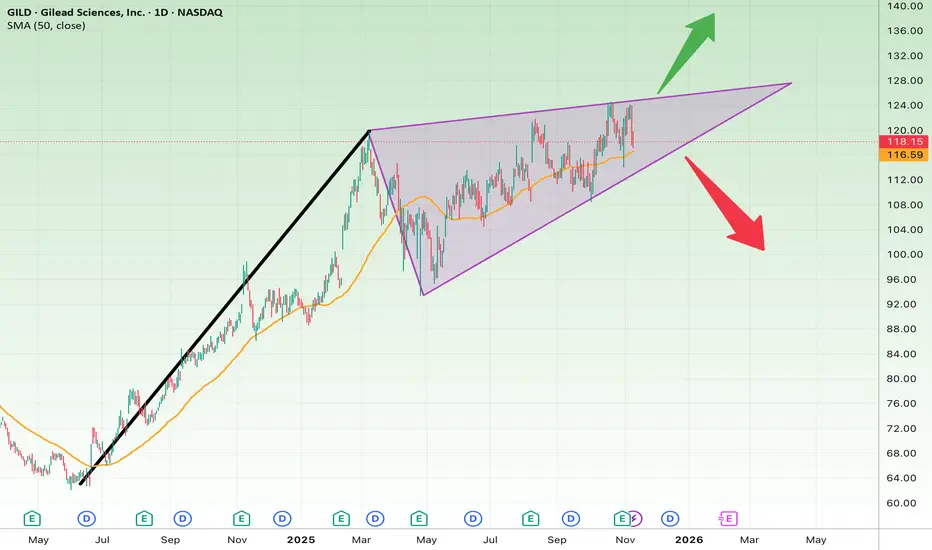
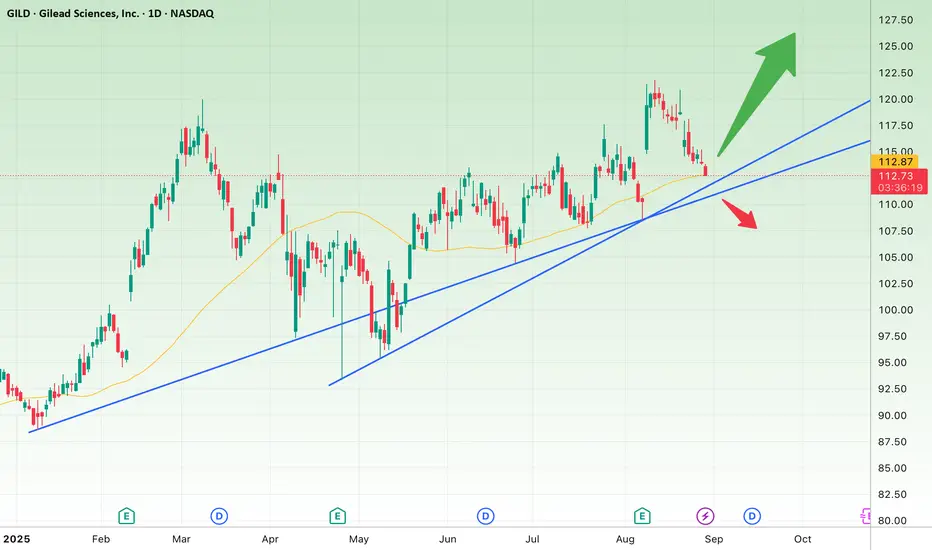
GILD Technical Analysis – Daily TimeframeAfter a strong bullish impulse, GILD has entered a consolidation/corrective phase and is currently trading inside a rising wedge pattern.
Price is hovering near the lower boundary of the wedge and the 50-day SMA, making this area a key decision zone.
Bullish Scenario
If price holds support and br
Key facts today
1.40 USD
426.34 M USD
25.52 B USD
About Gilead Sciences, Inc.
Sector
Industry
CEO
Daniel P. O'Day
Website
Headquarters
Foster City
Founded
1987
ISIN
ARBCOM4601C4
Gilead Sciences, Inc. is a biopharmaceutical company, which engages in the research, development, and commercialization of medicines in areas of unmet medical need. The firm's primary areas of focus include human immunodeficiency virus, acquired immunodeficiency syndrome, liver diseases, hematology, oncology, and inflammation and respiratory diseases. It offers antiviral products under Harvoni, Genvoya, Epclusa, Truvada, Atripla, Descovy, Stribild, Viread, Odefsey, Complera/Eviplera, Sovaldi, and Vosevi brands. The company was founded by Michael L. Riordan on June 22, 1987 and is headquartered in Foster City, CA.
Related stocks

Parallel channelWith my little analysis I do, the parallel channel for the most part has been very promising to me. Looks great on this one as well

$GILD Tradespoon – Neutral Entry $127.51Tradespoon model shows a neutral signal for $ NASDAQ:GILD . Predicted range: $125.13–$128.02. Trend: –0.37%. NASDAQ:GILD
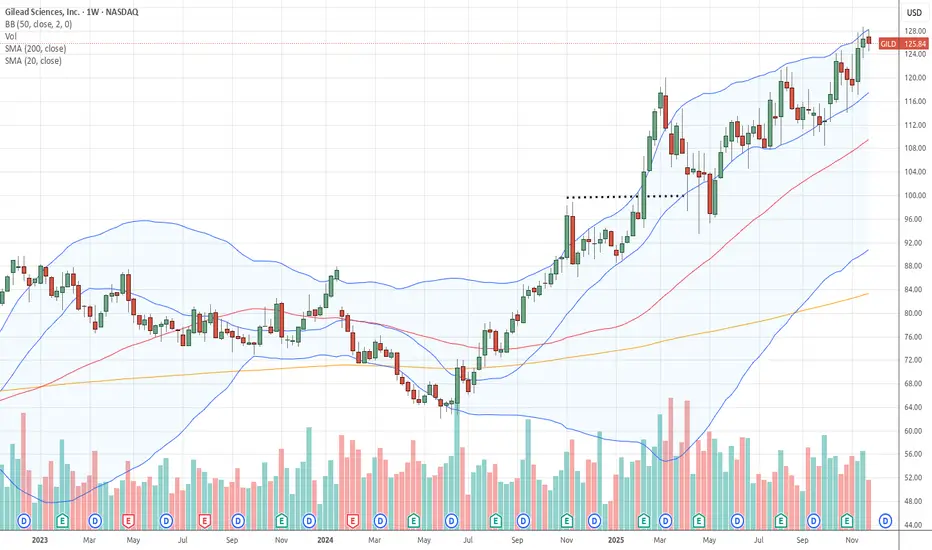
Tight Triangle Formation — GILD Ready for a BreakoutOn the daily chart, GILD is forming an ascending triangle, a bullish continuation pattern that often precedes a breakout move. The stock has rallied from around $75 to $125 and is now consolidating within a tightening range.
The 50-day SMA (around $114) is providing dynamic support.
Short-Term Vie
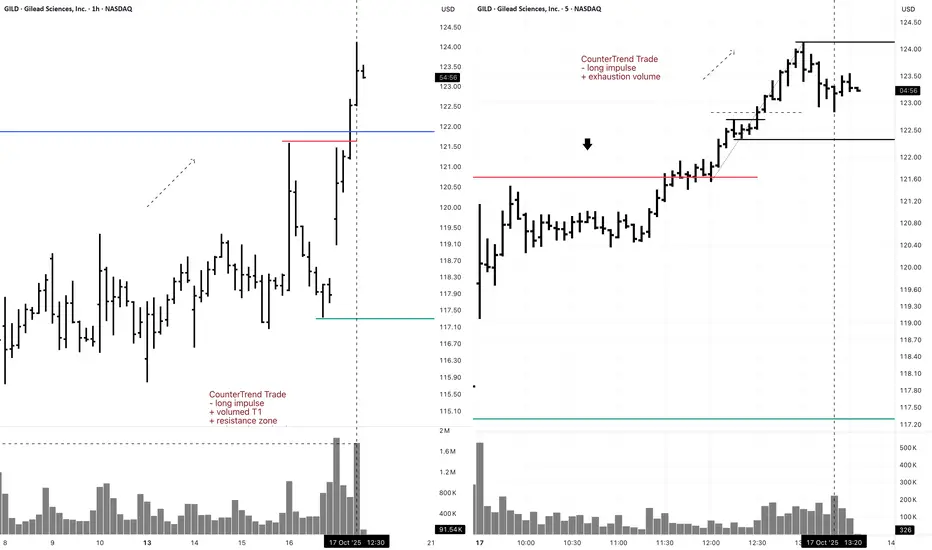
GILD 5M Short CounterTrend Daytrade (Buy Put to Open)5M CounterTrend Trade
- long impulse
+ exhaustion volume
1H CounterTrend
"- long impulse
+ volumed T1
+ resistance zone
+ volumed reaction bar"
1D CounterTrend
"- long impulse
- unvolumed T1
+ resistance level
+ volumed manipulation bar "
1M CounterTrend
"- long impulse
+ volumed T1 level
+ resis
GILD - Leading to the top =======
Volume
=======
- increasing
==========
Price Action
==========
- rounding bottom recently
=================
Technical Indicators
=================
- Ichimoku
>>> price above cloud
>>> Green kumo budding
>>> Tenken + Chiku - above clouds and pointing up
>>> Kijun - Above clouds and po

Gilead’s Critical Battle at the Uptrend Line!
Analysis:
The daily chart of Gilead Sciences (GILD) shows that the stock, after a short-term correction, is once again approaching its main uptrend line (blue). The 50-day moving average (orange) around $114.50 acts as a key support level, and the current price is trading slightly above it.
At t
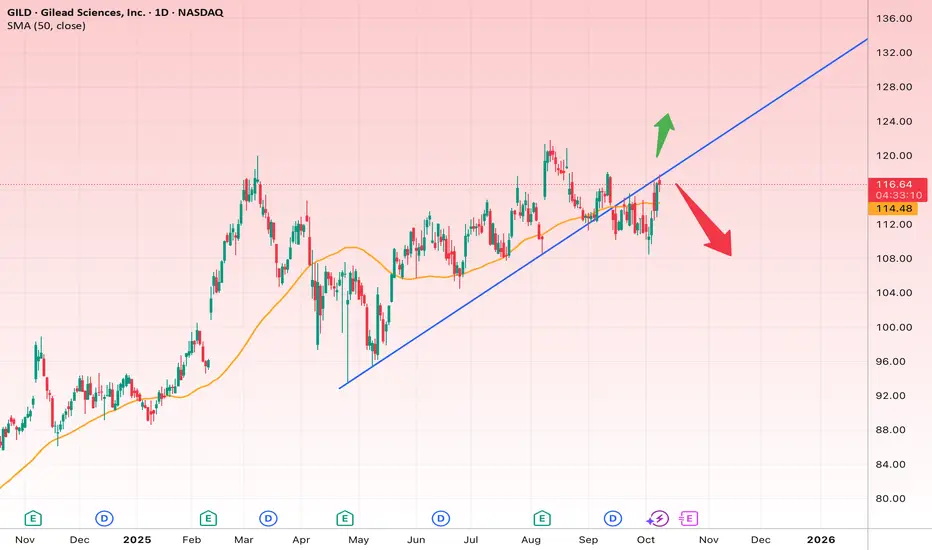
GILD at a Key Decision Zone!📊 Technical Analysis of GILD (NASDAQ)
After a strong rally since the beginning of the year, the price is now testing a major ascending trendline support around $112 – $110.
✅ If the support holds and the price rebounds, we could see continuation towards the next resistance levels at $118 and $125.
GILD Ichimoku Breakout – Targeting 13% UpsideGilead Sciences (GILD) has broken above cloud resistance and the conversion line on the daily Ichimoku chart, setting up a clean breakout trade.
Entry: $108.88
Target: $123.81 (+13.71%)
Stop: $104.15 (-4.34%)
Risk/Reward Ratio: 3.16
Volume & Momentum: Confirmed by CM_Ult_MacD and Williams %R near o

GILD eyes on $111: Major Resistance zone that could mark a TopGILD has been faring better than other pharma companies.
It has just hit a major resistance zone at $110.74-111.74
Look for a Dip-to-Fib or a Break-n-Retest for long entries.
Previous Analysis that nailed all the key levels:
===================================================
.

See all ideas
Displays a symbol's price movements over previous years to identify recurring trends.
GILD5939386
Gilead Sciences, Inc. 5.6% 15-NOV-2064Yield to maturity
5.61%
Maturity date
Nov 15, 2064
GILD5648609
Gilead Sciences, Inc. 5.55% 15-OCT-2053Yield to maturity
5.57%
Maturity date
Oct 15, 2053
GILD5939385
Gilead Sciences, Inc. 5.5% 15-NOV-2054Yield to maturity
5.57%
Maturity date
Nov 15, 2054
GISE
Gilead Sciences, Inc. 4.75% 01-MAR-2046Yield to maturity
5.52%
Maturity date
Mar 1, 2046
US375558BK8
Gilead Sciences, Inc. 4.15% 01-MAR-2047Yield to maturity
5.52%
Maturity date
Mar 1, 2047
GILD5050849
Gilead Sciences, Inc. 2.8% 01-OCT-2050Yield to maturity
5.51%
Maturity date
Oct 1, 2050
GISA
Gilead Sciences, Inc. 4.5% 01-FEB-2045Yield to maturity
5.48%
Maturity date
Feb 1, 2045
US375558AX11
Gilead Sciences, Inc. 4.8% 01-APR-2044Yield to maturity
5.47%
Maturity date
Apr 1, 2044
US375558AS26
Gilead Sciences, Inc. 5.65% 01-DEC-2041Yield to maturity
5.31%
Maturity date
Dec 1, 2041
US375558BS1
Gilead Sciences, Inc. 2.6% 01-OCT-2040Yield to maturity
5.17%
Maturity date
Oct 1, 2040
GISG
Gilead Sciences, Inc. 4.0% 01-SEP-2036Yield to maturity
4.85%
Maturity date
Sep 1, 2036
See all GILDC bonds
Curated watchlists where GILDC is featured.

