GM Retesting $18 -21 Range - Bearish Flag FormationGM Retesting $18 - Bearish Flag Formation;
Airbag Recall + Unsold inventories + UAW strikes and layoffs as cover up for failed pricing strategy. Major FAIL>>>
The information and publications are not meant to be, and do not constitute, financial, investment, trading, or other types of advice or recommendations.
Trade ideas

GM 3BarPlayHere is a 3 bar play also known as a 1-2-3 pattern accompanied by a bull flag on the 5m that has already broken out. Will be looking to ride calls up to the dotted line level which is the last swing high. Simple but effective. If price is not able to hold above the green "Calls" level then the play will be invalidated.

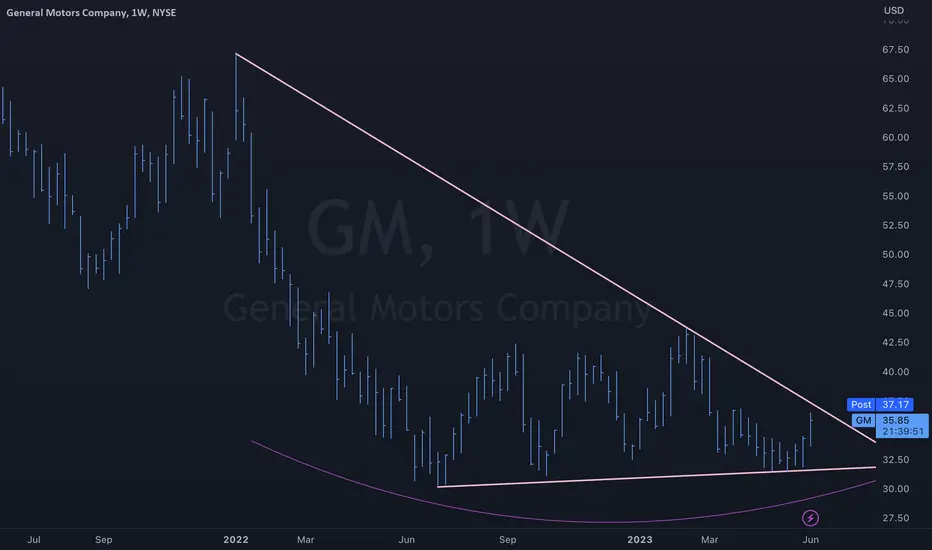
GENERAL MOTORS Confirmed buy signal.General Motors Company (GM) has completed 3 days of trading above the 4H MA50 (blue trend-line), with the 4H RSI almost 60.00. The long-term pattern is a Triangle and the recent Double Bottom was within the Higher Lows Zone that is in place since July 05 2022. Every time the price broke above the 4H MA50 after a 4H RSI oversold bounce on Higher Lows, we had a low risk buy entry at our hands.
There is a 12-month Resistance Zone that we should revisit on the long-term but on the more short/ medium-term we will target the 0.786 Fibonacci retracement level at 39.00, which was the targeted extension on the Lower Highs trend-line during the July High.
-------------------------------------------------------------------------------
** Please LIKE 👍, FOLLOW ✅, SHARE 🙌 and COMMENT ✍ if you enjoy this idea! Also share your ideas and charts in the comments section below! **
-------------------------------------------------------------------------------
💸💸💸💸💸💸
👇 👇 👇 👇 👇 👇

GM, Building Massive Formation, These Levels Are Important!Hi my friends,
Welcome to this analysis about the stock value GM, we are looking at the 4-hour chart, I noticed a divergence between the traditional car-industry stock like GM at the moment and the new electronic cars TSLA, while TSLA going down GM went up the last days. This is an interesting divergence worth to look nearer in, nevertheless, overall GM was one of the weaker stocks since the corona breakdowns and lows established, it is still trading below its all-time-high where others made already new highs and risings, therefore I detected the important levels and possible outcomes for this stock we should consider at the moment.
Looking at my chart you can watch there this huge blue trading channel the stock is trading in, furthermore, it has an established wave-count where it recently completed wave A and B to now form the major wave C in the structure, this wave will run into resistance as the stock still has above in the upper boundary coming together with the black falling resistance line marked in my chart, when the stock approaches this cluster in red there is a higher possibility given for a bearish confirmation to the downside, setting up the next wave D in the wave-count, this can lead to the back-up-zone marked in blue in my chart and a set up for the final wave E which will complete the overall wave-count, this last wave will be highly crucial as it has the potential to confirm the channel the stock is trading in as a bear-flag, this scenario will occur when the stock comes into the zone of the lower boundary anew and closes below it which will cause highly bearish pressure to the downside and activation of lower levels within a high possible spectrum.
The next times will show how the stock will continue with its eave-count and when there is a end, technically speaking as the stock is one of the weaker stocks trading below the previous established high, the bearish scenario should not be kept by side as it will confirm when the wave-count ends and crushes below the lower boundary as mentioned. This is currently the most likely scenario to come across with however there is a smaller possibility given that it will invalidate which will happen when the stock manages to hold the lower boundary sustainably and moves above the wave-count to form a new high.
In this manner, thank you for watching, support for more market insight, good day to you and all the best!
"There are many roads to prosperity, but one must be taken."
Information provided is only educational and should not be used to take action in the markets.

$GM 5th Times a charm?Repetitive test of support, looking for a bounce, maybe this time it can breakout and retest ATH? If not, a nice 21% move is can help.

GM: Target at $39The chart shows a clear consolidation channel, within which you and I will now earn money. I’m trying to go long from the current ones with a target of $39. Buy signals have been generated on the daily chart, so I will try to implement this scenario. Not an investment recommendation.
Good luck to everyone. If you liked it, subscribe.

General Motors to break to the upside?General Motors Company - 30d expiry - We look to Buy a break of 34.33 (stop at 32.53)
Price action looks to be forming a bottom.
Bullish divergence is expected to support prices.
Posted a Double Bottom formation.
The bias is to break to the upside.
Trading has been mixed and volatile.
Expect trading to remain mixed and volatile.
Our profit targets will be 38.83 and 39.83
Resistance: 34.21 / 36.00 / 38.20
Support: 32.70 / 32.02 / 31.50
Please be advised that the in formation presented on TradingView is provided to Vantage (‘Vantage Global Limited’, ‘we’) by a third-party provider (‘Everest Fortune Group’). Please be reminded that you are solely responsible for the trading decisions on your account. There is a very high degree of risk involved in trading. Any information and/or content is intended entirely for research, educational and informational purposes only and does not constitute investment or consultation advice or investment strategy. The information is not tailored to the investment needs of any specific person and therefore does not involve a consideration of any of the investment objectives, financial situation or needs of any viewer that may receive it. Kindly also note that past performance is not a reliable indicator of future results. Actual results may differ materially from those anticipated in forward-looking or past performance statements. We assume no liability as to the accuracy or completeness of any of the information and/or content provided herein and the Company cannot be held responsible for any omission, mistake nor for any loss or damage including without limitation to any loss of profit which may arise from reliance on any information supplied by Everest Fortune Group

General Motors longGM long position.
Market below Lin Reg and MACD on H4.
Confirmation on H1 to take long position with 2 TP.
Tp1 at $38 and 2nd at $44.
SL at $32.39.
Warning!!!!
This content should not be interpreted as financial advice

GM - Buy General Motors ( $GM )General Motors ( NYSE:GM ) stands out as one of the underappreciated stocks in the current market. With a Price to book Ratio under 0.70.
I currently have a pending order at the price of $32.
In recent months, they have been making significant investments in the fields of AI and electric vehicles (EVs).
One of their recent notable investments 👇
GM INVESTS IN #AI AND BATTERY MATERIALS INNOVATOR MITRA CHEM
#GM NYSE:F NASDAQ:TSLA #EVs #EV

GM Long CallBuy Aug-04-23 38 Calls @ 0.47 Limit to Open
Buy Aug-11-23 38.5 Calls @ 0.53 Limit to Open
2 buy for this week and the following. Good prices, at support zone and oversold CCI.

Bearish Alert : GMHourly Chart
Bearish Alert and Bearish Crossover on top of this strong bullish wave.
Waiting for a bearish price action to get an entry level.

$GM BreakoutAlthough consolidation over the last year has given ample trade opportunities we are looking for a breakout above or below supply & demand zones.

I'm using 48c expired in Jan 2024 to trade GM earningThe daily RSI of GM is trading above 70. This could mean that either prices are in a lasting uptrend or just overbought and that therefore a correction could shape (look for bearish divergence in this case).
The MACD is above its signal line and positive. The configuration is positive. General Motors is above its 20 and 50 period moving average (respectively at 37.76 and 37.12).
Supports and resistances:
39.37 **
39.13 *
38.9 **
38.66
38.19 last
38.03
37.88 **
37.48 *
37.25 **

GM - Will the general lead again?
Price sitting at the confluence of 200 DMA and 60 VMA. If it continues to build above, likely tests the upper range of this channel and set up nicely for a breakout.
Upside targets: 41, 47, 54
Bear case: loss of 200 DMA could bring this down to the bottom of the channel to around 31.
Disclosure: no position yet.

GM 5/13/2023GM
Running out of fuel.
Daily chart analysis
After reaching all-time lows during start of Covid back in March 2020, GM went to reach all-time highs by June 2021. All that fake money that was printed during covid sent the stock market soaring.
By December 2021, GM ran out of fumes and couldn’t break the all-time highs and a Double top pattern was formed.
To start in February 2022, price broke from the Double top neckline. The Double top pattern was then confirmed, and price entered a downtrend.
By mid-2022, price entered a Distribution stage and has been moving sideways since.
Today price finds itself breaking thru the support levels of the sideways range. It looks like the Distribution stage is complete and price will look to continue its downtrend.
There was a previous downtrend, followed by a sideways range, and now a breakdown below of support level. This is my cue to enter trade short.
Entering trade short.
Entry: 32.40
Stoploss: 35.50 (-9.64%)
Target: 20.00 (+38.23%), 3.97 RR Ratio

GM General Motors Company Options Ahead of EarningsAnalyzing the options chain of GM General Motors Company prior to the earnings report this week,
I would consider purchasing the 45usd strike price Calls with
an expiration date of 2024-1-19
for a premium of approximately $1.14.
If these options prove to be profitable prior to the earnings release, I would sell at least half of them.
I am interested to hear your thoughts on this strategy.

General Motors to ChargePoint Trading at Bearish Shark PCZI think that these two stock will trade in opposite directions to each other, so I am tracking the ratio between the two stocks, and it looks like General Motors has just about hit the limit to the amount of ChargePoint shares it will be able to buy, and so I expect a decline in GM price and a Rise in ChargePoint's price from here.

General Motors: Bear Flag Bearish BacktestGeneral Motors after getting the TSLA Charging Plug collaboration news was able to generate enough energy to come back up to test the Bearish Channel and 55 Week EMA and from there it got a moderate rejection from it. This could be just the start of a greater move down to the zone between the 0.786 and 0.886 Fibonacci Retraces.
I could aslo see a scenario as to where GM and Ford Motors comes down as the Charging Station Stocks such as ChargePoint and maybe Blink rebound back up, as the moves between these after the news report were opposite of each other and they have two opposing setups.

$GM wedge pattern NYSE:GM bottoming pattern that started last year and wedge pattern ready to break out.
GM - DIVIDENT FALLOUT PATTERNGeneral Motors, a multinational corporation based in the United States, was the leading automobile company for 77 years until Toyota surpassed it in 2008. Despite this, GM has consistently ranked among the top 15 companies on the Fortune 500 list, and recently moved up from No. 8 to No. 5. With operations in eight countries and four brands, GM is also involved in joint ventures with Chinese automakers and produces military vehicles for the US government. Left with only four car brands for serial production the sales are taking steep downhill. The chart shows the last 3 dividend payouts and a significant 25% drop weeks after. To see if that is a solid pattern there is testing the current dividend payout we can have two level checkpoints $29' and $26', let's say that reaching the $29 level around mid-June could seek $26 by the first week of July.
Risk Disclosure: Trading Foreign Exchange (Forex) and Contracts of Difference (CFD's) carries a high level of risk. By registering and signing up, any client affirms their understanding of their own personal accountability for all transactions performed within their account and recognizes the risks associated with trading on such markets and on such sites. Furthermore, one understands that the company carries zero influence over transactions, markets, and trading signals, therefore, cannot be held liable nor guarantee any profits or losses.


General Motors Monthly Log Chartmomentum breaking down below 3 year moving average
General Motors sitting on "volume defined" equilibrium.
Bias is bearish unless it can get back above the "wake up" line.
#generalmotors #gm #dji #spx

GM - BULLISH SCENARIOEarlier this month the company disclosed first quarter US deliveries rose 18% to 603,208 vehicles, with the automaker growing its US market share by an estimated 1.5%, the largest of any company in the industry, GM said.
GM also reported record electric vehicle deliveries of 20,670, though most of those were for the Chevrolet Bolt EV and EUV — GM only delivered two Hummer EV pickups and 968 Cadillac LYRIQ EVs. Analysts and investors will be keen to hear more about GM’s EV ramp-up; GM is expected to launch three more EVs — the Chevrolet Equinox, Blazer, and Silverado EV pickup.
The next price target is located at the $ 45 resistance level.
Risk Disclosure: Trading Foreign Exchange (Forex) and Contracts of Difference (CFD's) carries a high level of risk. By registering and signing up, any client affirms their understanding of their own personal accountability for all transactions performed within their account and recognizes the risks associated with trading on such markets and on such sites. Furthermore, one understands that the company carries zero influence over transactions, markets, and trading signals, therefore, cannot be held liable nor guarantee any profits or losses.
