GOOG: Is a 10% Surge Imminent? The Setup for $340 Explained🚀 NASDAQ:GOOG : Is a 10% Surge Imminent? The Setup for $340 Explained
In the noisy world of trading, clarity is power.
Today, we are looking at Alphabet Inc. (GOOGL). We are not predicting the future, we are simply preparing for a high-probability outcome.
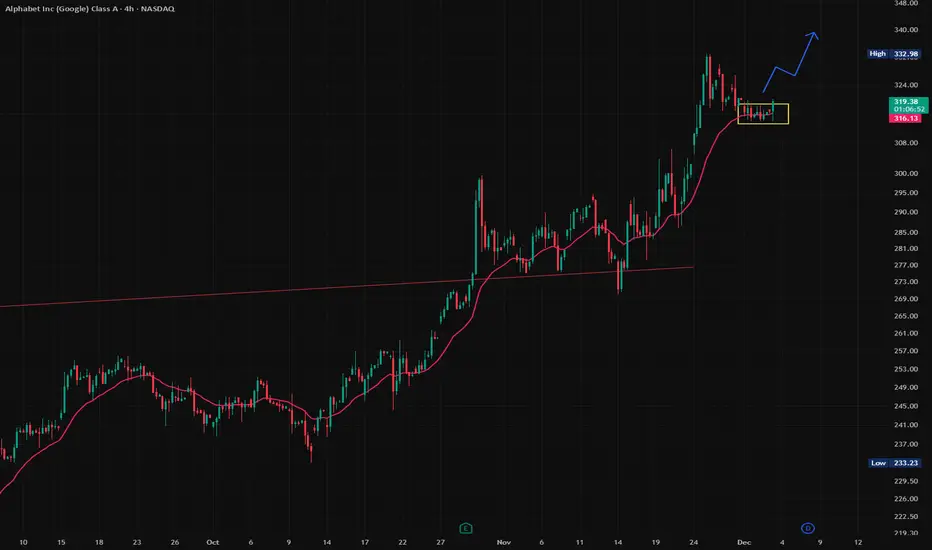
We have identified a textbook Bull Flag pattern. As noted in the chart, this specific structure historically carries a 71% success rate. However, a statistic is only as good as the execution plan behind it.
The Technical Analysis
The price action is currently consolidating between two parallel yellow lines. This "pause" is healthy, it allows the market to build energy for the next potential leg up.
The key level to watch is $323 . We are looking for a clean breakout above this resistance.
A breakout is only valid if it is accompanied by significant volume . Without volume, a move above $323 could be a "fake-out", and that would be bearish.
If the price loses the $305–$309 zone , the Bull Flag structure is broken, and this specific trade idea is invalid . We must respect the market's "no."
The Projection
If the market gives us the green light at $323 , we have two targets based on standard projections:
Conservative : The 100% projection lands us at $336 .
Aggressive : For those holding longer, the 161.8% extension points higher ( approx. $346) .
Here are the levels I would use to set-and-forget in my trading system:
🎯 Take Profit: White lines ($336 - $346) | > 4-7% Potential
🛡️ Stop Loss : ~$314 Zone (Inside the flag structure) | ~ 2.5% Risk
⚖️ Risk/Reward : 2:1 Ratio or more
🎁 Let’s make a simple deal.
I will handle the heavy lifting to find the top 1% of setups like this, and you just HIT the 🚀 Rocket, Follow and Enjoy.
🤝 Deal?
Alphabet Inc (Google) Class A
No trades
Market insights

Alphabet - The exceptional short setup!🔒Alphabet ( NASDAQ:GOOG ) is reversing right now:
🔎Analysis summary:
Alphabet is clearly indicating a major bearish move. With the current retest of major resistance, Alphabet is slowly reversing. Since Alphabet is also massively overextended, really everything is pointing towards a move lower. Just give it a couple of days to reverse.
📝Levels to watch:
$300
SwingTraderPhil
SwingTrading.Simplified. | Investing.Simplified. | #LONGTERMVISION

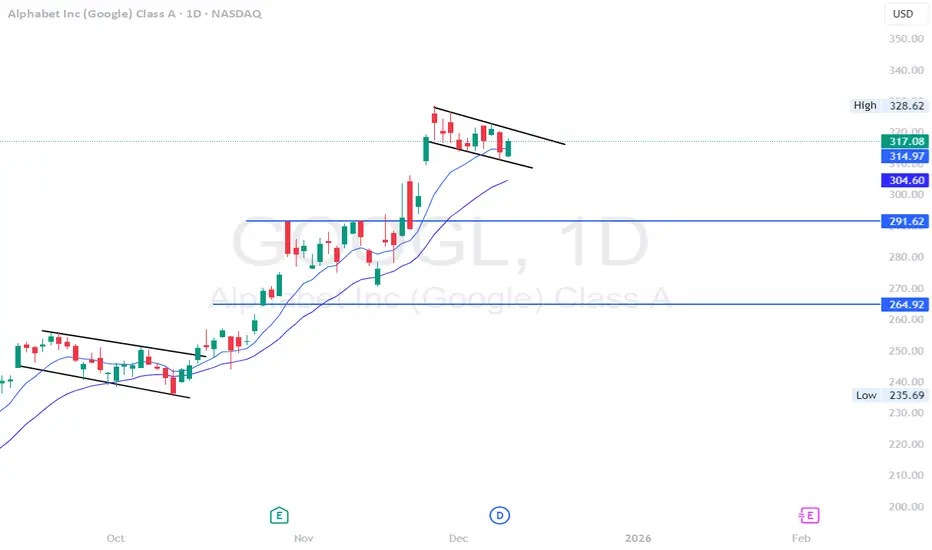
GOOGL. Plan for Dec 15Looking at GOOGL going into Dec. 15, the chart still feels heavy, even though price has stopped falling aggressively.
After the selloff, we got a bounce — but that bounce never reclaimed structure. Price broke down, tried to push back up, and stalled right where former support should turn into resistance. That’s not strength — that’s sellers letting price breathe.
Right now, GOOGL is sitting around the 308–310 area, which feels more like a pause than a base. There’s no real impulsive buying, just small candles and low follow-through. This usually means the market is deciding when, not if, to make the next move.
From a structure standpoint, the bearish move is still valid until proven otherwise.
Levels that actually matter
The first thing I’m watching is 308.
If price loses 308 with any momentum, I expect a quick move into 305, and if that doesn’t hold, 302–300 becomes very realistic. Those levels line up with prior lows and unfinished business from the selloff.
On the upside, 312–315 is the problem area.
That zone was support before the breakdown, and now it’s acting like a ceiling. Every bounce into that area so far has been sold. If price can’t reclaim and hold above 315, upside moves are likely just short-covering, not real trend change.
How GEX fits into this (not the focus, just confirmation)
Options positioning lines up with what price is telling us.
There’s strong PUT support around the current price, which explains why we’re chopping instead of free-falling. But above us, CALL resistance stacks up around 320 and higher, which makes upside continuation harder unless volume steps in.
That’s why moves down feel faster than moves up — dealers aren’t forced to support upside right now.
How I’d think about tomorrow
If GOOGL opens and can’t hold above 310, I’d be cautious leaning long. A clean break below 308 is where downside momentum likely kicks in.
If we open strong and reclaim 315, then I’d reassess — but until that happens, the burden of proof is on the bulls.
For me, Dec. 15 is simple:
* Below 308 → downside continuation likely
* Between 308–315 → chop and traps
* Above 315 → only then does the chart start to improve
Until then, this still looks like bearish consolidation, not a reversal.
Not financial advice. Just how I’m reading the chart going into the next session.

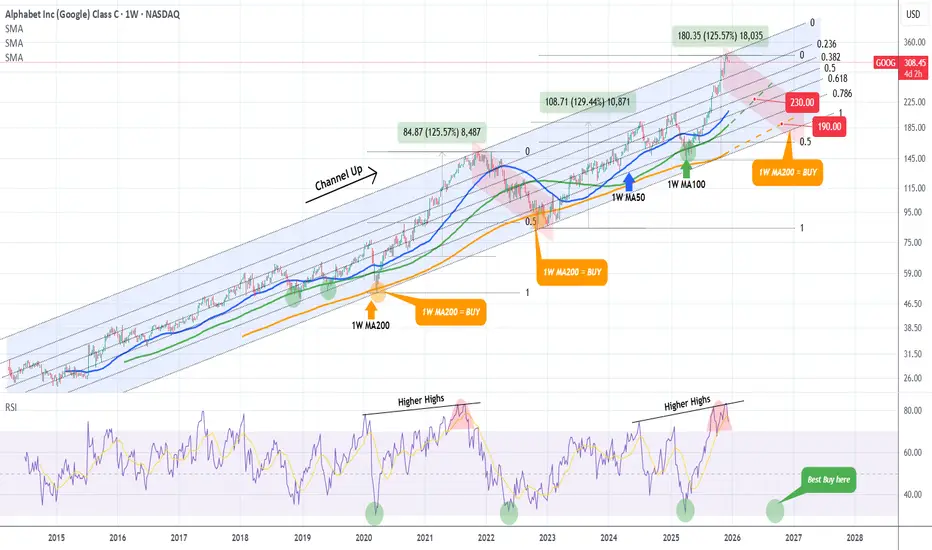
GOOGLE Bear Cycle has started and this is its ultimate blueprintWe made this chart on Google (GOOG) a little more than a month ago, warning of a potential market top on the Higher Highs trend-line of the multi-year Channel Up.
Well 3 weeks ago, the market hit that trend-line and we have a legitimate technical reason to expect that the Bull Cycle has topped. The 1W RSI has even printed the same kind of peak formation it did in September 2021.
We have extended the Channel Up on today's analysis all the way back to Google's IPO and the Fibonacci retracement levels serve absolute justice since the beginning to identify tops and bottoms.
You can see that the 1W MA200 (orange trend-line) has acted as the ultimate Support, thus best buy entry, on the last three major market corrections: the March 2020 COVID crash, the October 2022 Inflation Crisis bottom and the April 2025 (almost) Tariff War.
Before that, it was the 1W MA100 (green trend-line) that gave two excellent buy opportunities back-to-back.
As a result, even though the 2022 Bearish Leg correction bottomed on the 0.5 Fibonacci retracement level, this time we will 'limit' the new Bear Cycle to those MA trend-lines, the MA100 and MA200. If the price is contained on the MA100, its current trajectory shows a potential 'fair' contact around $230. If the market fails to rebound there, we expect a Q3 2026 bottom on the 1W MA200 around $190.
Regardless of that, we will also be looking closing at the 1W RSI. Since the 2020 COVID crash, and those 3 in total major corrections that the Alphabet stock had, when the RSI hit the 32.00 level, it presented an objective buy opportunity, even though in 2022 it dipped even lower.
---
** Please LIKE 👍, FOLLOW ✅, SHARE 🙌 and COMMENT ✍ if you enjoy this idea! Also share your ideas and charts in the comments section below! This is best way to keep it relevant, support us, keep the content here free and allow the idea to reach as many people as possible. **
---
💸💸💸💸💸💸
👇 👇 👇 👇 👇 👇
Google is trading in a high-risk zone.Google (Alphabet) Stock Analysis
As shown on Chart A, Google is trading within a 5-year ascending channel on the weekly timeframe and has now reached the upper boundary of the channel.
On Chart B (daily timeframe), price has broken below its rising channel and has already moved toward the mid-level of the extended channel.
Given the strong bullish momentum in the most recent move, the probability of a sharp sell-off appears limited. However, considering the bearish divergence in the last price leg, along with the presence of a large unfilled gap that price has never revisited, a corrective move can be expected.
Based on these factors, a pullback at least toward the $217 level remains a plausible scenario.
This analysis will be updated accordingly.
Follow me on TradingView for more analyses and live stock trades.
NASDAQ:GOOG

Google: Pause?Over the past two weeks, Google's stock has been taking a breather, moving mostly sideways. Our primary scenario suggests that price will soon gather fresh upward momentum and swing into the red Target Zone between $377.44 and $418.64, where it should complete the overarching upward cycle of the beige wave I. Once this occurs, a new downward impulse is expected to begin, making the red zone suitable for entering short positions; a stop 1% above the upper boundary of the zone can provide protection.

GOOGL GEX & Bullish Decision Point at 320February 20 Expiration – GEX & Options Structure
Looking at the February 20 expiration, the options and GEX structure suggests that price is currently sitting at a critical decision zone .
Put side
The chart shows a clear put support level around 310 .
Price has briefly traded through this level, but there has been no strong downside continuation .
This keeps the scenario alive that 310 can still act as put support into this expiration.
Call side / Decision point
The next core resistance is located around 320 .
This level represents a bullish decision zone .
A clean break and acceptance above 320 could quickly shift dealer positioning.
Such a move would open the door for a potential gamma squeeze to the upside.
Technical context
Since summer, this is already the third similar bull flag structure on the daily chart.
The previous two structures resolved to the upside.
The current pattern has not yet confirmed a breakout.
This makes the 320 level especially important for technical confirmation.
Upside scenario
If price accepts above 320 , the next logical magnet becomes the next core resistance.
Based on daily structure and call wall positioning, this sits around 350 .
Volatility & Skew
Core pricing skew is currently around +25% , favoring calls.
Implied volatility has been compressing for several sessions .
This supports the idea that a directional expansion could follow once price resolves this range.
Summary
310 = key put support
320 = bullish decision point
Acceptance above 320 increases the probability of gamma-driven upside toward higher call resistance levels

GOOGL at a Key Decision Zone — Dec. 10 TA with GEX InsightGOOGL continues to respect one of the most important levels on its chart: the 311–312 zone. Every time price dips into this area, it gets absorbed instantly, creating a solid base for the recent recovery. That kind of repeated defense usually means real buyers are sitting there, not just random bounces.
The move back toward 316–318 shows where supply still lives. Price wasn’t able to push through that pocket, and the rejection lined up perfectly with the upper trendline on the 1-hour chart. It doesn’t break the bullish structure, but it does tell us that sellers remain active and patient at that level.
On the 15-minute timeframe, the picture is cleaner. GOOGL had a strong run off the 311 support, pushed straight into 318, and then shifted into a controlled pullback. EMAs are flattening, which usually means the market is transitioning from momentum into consolidation. The structure stays constructive as long as price avoids making a new lower low. That 311–312 zone is the line in the sand.
The gamma exposure map adds clarity to why the stock keeps behaving this way. The put wall is stacked right at 311–312, which means dealers hedge by buying each time price approaches it — creating that reliable support. On the other side, the first meaningful call-wall pressure sits at 316–318. That’s exactly where price keeps getting rejected, because dealer hedging tends to produce sell-side flow as we approach those levels.
This leaves GOOGL pinned between two strong forces: a supportive floor and a heavy ceiling. Until one of those gives way, the stock is likely to keep drifting around the middle of the range, roughly near 315. A clean breakout over 318 would free it toward 322–325, where the next gamma pockets sit. A breakdown under 312, on the other hand, would open room toward 310 and possibly even 300 if momentum shifts.
Right now the chart and the options-based gamma structure are aligned, and that usually produces reliable levels. GOOGL is coiling — and whichever side breaks first will define the next directional leg.
Disclaimer: This analysis is for educational purposes only and is not financial advice. Always do your own research and manage your risk.
GOOGL Dec 12 Sliding Downward Channel. Key Support Now in PlayGOOGL has been moving inside a clean descending channel on the 15-minute timeframe after the sharp rejection earlier in the session. Each bounce continues to form lower highs, and price remains pinned under the channel’s upper boundary. That trendline has now rejected price multiple times, signaling that sellers are still in control until GOOGL can break above it with strength.
The mid-zone around 313–315 is acting as the key intraday decision area. Buyers attempted to stabilize here, but each rally into 315 met resistance, and the latest candles show hesitation beneath the trendline. Unless GOOGL can reclaim 315 and close above the channel’s upper line, the structure remains bearish.
Below price, the channel’s lower boundary aligns with the 308–309 support zone. This area held earlier and became the base of the channel. If GOOGL breaks under 310, the channel suggests room for continuation toward 308–307, where buyers previously stepped in aggressively.
Now looking at the options landscape, the GEX levels line up tightly with these structural turning points.
The 315 level, where GOOGL stalled repeatedly, corresponds with a significant positive gamma band. When price moves into these upper positive-gamma regions, dealer hedging typically dampens momentum. This explains why every push back into 315 fades—it’s not just chart resistance, it’s an area where hedging flows naturally limit extension.
Above that, the next major positive gamma levels sit around 322–324. These levels represent the top-end call concentration. To reach that area, GOOGL would need to break the descending channel, reclaim 315, and hold it. If that happens, the hedging pressure that previously contained price begins to release, and volatility can expand upward, opening a path toward 320+.
On the downside, negative gamma levels align with the lower channel targets. The cluster around 310–308 shows where downside movement can accelerate. If GOOGL loses 310, the options positioning shifts into a zone where dealer hedging amplifies volatility instead of controlling it. That is exactly the environment where channel breakdowns can follow through cleanly.
The correlation between the descending channel and the GEX positioning creates a clear roadmap:
• Holding below the channel’s upper trendline keeps the bearish structure intact
• A move above 315 signals strength and opens the path to 318 and potentially 322 if momentum builds
• Losing 310 confirms continuation within the downward channel toward 308–307
• Below 307, negative gamma increases the chance of sharper moves
GOOGL is moving cleanly within its channel, and the options landscape supports both the rejection zones above and the acceleration zones below. Dec 12 is likely defined by how price interacts with 315 on top and 310 underneath.
This analysis is for educational purposes only and not financial advice.

GOOGL - flagging on the daily time frame.GOOGL - Stock flagging on the daily time frame. potential breakout move above $320. Stock does have gap to fill to the downside of $309.50 breaks. possible move still on both sides.
GOOGL | InformativeNASDAQ:GOOGL
Technical Summary
GOOGL is breaking down from a multi-week consolidation near the highs. The chart shows repeated failures to hold above the 314–316 resistance band and a clean rejection from the upper Keltner region. Price is now closing below the internal support level at 309–310, shifting the bias to a bearish continuation.
The volume profile shows a clear low-liquidity zone beneath current price, opening the door for a rapid move toward 299.66, followed by the Keltner lower band around 289.
Bearish Factors
1. Failure at Prior Highs
Price made a higher-high earlier but was unable to sustain any momentum. The recent candles show compression followed by a decisive bearish break, signaling the end of upward strength.
2. Breakdown Through 309–310 Support
The red line on your chart marks the bearish threshold. Today’s close sits below that area, confirming sellers have taken control. This level now becomes resistance.
3. Rejection at the Keltner Mid-Level
The mid-band around 316 acted as resistance several times. GOOGL failed to reclaim it even during strong sessions, showing loss of bullish momentum.
4. Volume Profile Gap
There is a thin volume pocket between 309 and the next major volume shelf at 299.66. Once price enters a low-volume region, continuation moves tend to accelerate until reaching the next high-volume area.
5. Trend Context
The structure has shifted from impulsive upward movement to sideways distribution, followed by a clean bearish break. Sellers are stepping in aggressively at upper levels and defending every retest.
Short Scenario
Breakdown Confirmation:
Bearish below 309–310, as long as price remains under this level on a daily close.
Targets:
• First target: 299.66 (primary volume node)
• Second target: 289 (Keltner lower band and major support cluster)
Invalidation:
A daily close back above 316, which would reclaim prior structure and negate the breakdown setup.
Outlook
GOOGL has transitioned from strength to distribution and is now breaking cleanly beneath support. If price remains below the 309–310 band, the chart favors continuation lower toward 299 and potentially 289.
If you want, I can also prepare the optimized TradingView headline for maximum visibility.

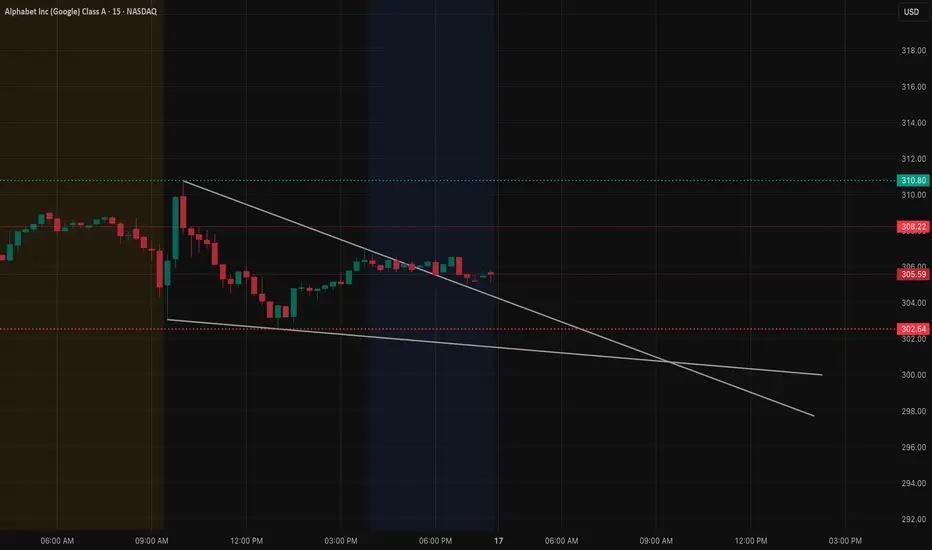
GOOGL at Critical Support – Dec. 17 Could Decide DirectionGOOGL is still trading inside a descending structure, and price is currently compressing toward the apex of that falling channel. The bounce off the lows lacked momentum and volume follow-through, which tells me this is more of a relief move than a true trend reversal for now.
From a price-action perspective, GOOGL failed to reclaim the prior breakdown zone around 308–310. That area continues to act as supply. Until price can hold above it, the path of least resistance remains sideways to down. The lower channel trendline and prior demand around 302–300 remain the key downside magnet if sellers press again.
Now layering in GEX, the options positioning lines up well with what price is showing.
The largest negative gamma / PUT support sits near the 300–302 zone, which explains why price keeps reacting there instead of cascading lower. Dealers are likely hedging aggressively in this area, creating temporary stabilization. However, above price, CALL resistance builds between 315–320, with a notable call wall around 317–320, which caps upside attempts unless we see a strong shift in flows.
This creates a very defined range behavior:
As long as GOOGL remains below 315, upside extensions are likely to stall into dealer-driven resistance. If 302–300 breaks with volume, the next downside pocket opens quickly, since gamma support thins out below that level.
In short, price structure and GEX are aligned. This is still a sell-the-rallies environment, not a chase-the-bounce setup. Bulls need a clean reclaim and acceptance above 315 to flip the narrative. Until that happens, expect choppy consolidation with downside risk toward 302–300, especially if broader market pressure increases.
This analysis is for educational purposes only and does not constitute financial advice. Always manage risk and make your own trading decisions.
GOOGL Market Preview – December 5GOOGL is heading into tomorrow’s session sitting inside a rising structure that has now stalled under the 319–323 supply zone. Price has been grinding higher for days, but today’s sharp rejection showed the first sign of buyers losing momentum. At the same time, the lower trendline continues to hold cleanly, creating a pressure zone where a breakout or breakdown becomes more likely.
Structure Outlook (1H Trend View)
GOOGL has been respecting a gradual uptrend from the 311–313 support area. That zone has acted as the primary accumulation level each time sellers pushed down. But the big story is overhead: the 319–323 supply has rejected every attempt to break higher. Each test created fast selling wicks and stalled momentum.
Price is now compressing between:
* The rising trendline below
* A heavy, sticky supply box above
This creates a squeeze that usually leads to a decisive move. Until GOOGL reclaims 320–323, upside remains limited.
15M SMC View
What Today’s Price Action Means
the CHoCH and BOS marks tell the full story. The BOS into demand was strong, but the CHoCH did not turn into real continuation. Price spent most of the afternoon moving sideways under the red SMC zone — a sign of hesitation.
Bearish signs:
* Repeated rejection from 319–320
* SMC sell zone holding perfectly
* EMAs flattening to slightly downward
* Volume fading on each bounce
Bullish signs:
* Buyers defended the 315–316 demand area
* No clean breakdown beneath the trendline
* Liquidity resting above 320 that could be swept
Overall → buyers are still present, but they aren’t strong enough yet to force a breakout.
GEX Read for Tomorrow
GEX layout gives clear directional boundaries:
* Call walls: 320 → 322.5 → 327.5
* Highest positive GEX: near 320
* PUT support: 315 → 312.5 → 310
* Dealer bias: Calls only 19% (mixed-to-neutral)
* If GOOGL can take out 320, dealer hedging can accelerate a push toward 322.5 and 325.
* If it fails again, price flows naturally back toward 315–312.5, which aligns with the SMC demand zone.
This setup favors whichever boundary breaks first.
What I Expect on December 5:
Unless buyers show unusually strong momentum, GOOGL is more likely to stay range-bound or lean slightly bearish into tomorrow. The inability to reclaim the 319–320 zone today suggests sellers still have a grip.
Upside scenario:
If GOOGL breaks and holds above 320, mo
mentum can squeeze into 322.5 and potentially 325. Liquidity above 320 creates room for a continuation sweep.
Downside scenario (slightly higher probability):
If GOOGL rejects 319–320 again or loses 315 support, the structure favors a drift toward 313–312.5. Breaking that level exposes 310 as the next liquidity pocket.
My Bias:
neutral-to-bearish unless GOOGL can reclaim 320 with conviction. The combination of structure, SMC flow, and GEX resistance suggests the upside remains capped until buyers show real strength.
Quick Trade Thoughts (Not Financial Advice)
Bullish plan:
Break and retest above 320
Target 322.5 → 325
Invalidation: failure to hold the breakout
Bearish plan:
Reject 319–320
Target 315 → 313 → 312.5
Best RR is always near the top of the range
Avoid trading the middle of the wedge — it’s where GOOGL chops and kills prethetmium.
Disclaimer:
This outlook is for educational discussion only. It reflects a technical perspective on market structure and options positioning. Always trade your own plan and manage your risk.

GOOG - Strong Buy (Since COVID) 6 HRGOOG continues its 3 wave movement that started just following Covid. It recently completed the A wave of Circle 3 and now appears to want to retrace to just below 300 before continuing its climb to 865 next year. The current B wave is difficult to measure probability - given its exuberance (volume) and the tendency to alternate with the more protracted drop from circle 1 to circle 2, I suspect the B wave may complete quickly.

Alphabet - This rally will soon be over!🪦Alphabet ( NASDAQ:GOOG ) will end its rally soon:
🔎Analysis summary:
Starting back in 2025, Alphabet created a major bullish break and retest. Following this behavior, we witnessed an expected strong rally of about +120%. But with the current retest of the upper resistance trendline, Alphabet will soon create a healthy retracement.
📝Levels to watch:
$300
SwingTraderPhil
SwingTrading.Simplified. | Investing.Simplified. | #LONGTERMVISION

Google - A major correction starts now!🚽Google ( NASDAQ:GOOGL ) is now creating a top:
🔎Analysis summary:
Over the course of the past couple of months, we witnessed a major rally on Google of about +100%. This rally was totally expected, following the underlying bullish rising channel. But with the current retest of the trendline, Google is heading for a major correction.
📝Levels to watch:
$300 and $200
SwingTraderPhil
SwingTrading.Simplified. | Investing.Simplified. | #LONGTERMVISION

$GOOGL breakout of pullback?Bought some NASDAQ:GOOGL earlier today. I am bearish longer term on the chart, but this looks like it is going to make a new high first.
Google's new Ironwood TPU (7th-gen TPU) is a big deal for AI inference
GOOGL LONG SWING TRADEWe are buying calls for GOOGL out 3 weeks at the money for an ABC down entry for continuation higher.

Alphabet May Be OversoldAlphabet has pulled back after hitting a new all-time high, and some traders may think it’s oversold.
The first pattern on today’s chart is the rally between November 14 and November 25. The Internet giant held its ground yesterday after retracing half the advance, which may confirm its direction is pointing higher.
Second, GOOGL has bounced multiple times at its 21-day exponential moving average (EMA). It returned to the same EMA yesterday. Will that lure trend followers?
Next, stochastics have dipped to an oversold condition.
Finally, GOOGL is an active underlier in the options market. That could help traders take positions with calls and puts.
TradeStation has, for decades, advanced the trading industry, providing access to stocks, options and futures. If you're born to trade, we could be for you. See our Overview for more.
Past performance, whether actual or indicated by historical tests of strategies, is no guarantee of future performance or success. There is a possibility that you may sustain a loss equal to or greater than your entire investment regardless of which asset class you trade (equities, options or futures); therefore, you should not invest or risk money that you cannot afford to lose. Online trading is not suitable for all investors. View the document titled Characteristics and Risks of Standardized Options at www.TradeStation.com . Before trading any asset class, customers must read the relevant risk disclosure statements on www.TradeStation.com . System access and trade placement and execution may be delayed or fail due to market volatility and volume, quote delays, system and software errors, Internet traffic, outages and other factors.
Securities and futures trading is offered to self-directed customers by TradeStation Securities, Inc., a broker-dealer registered with the Securities and Exchange Commission and a futures commission merchant licensed with the Commodity Futures Trading Commission). TradeStation Securities is a member of the Financial Industry Regulatory Authority, the National Futures Association, and a number of exchanges.
Options trading is not suitable for all investors. Your TradeStation Securities’ account application to trade options will be considered and approved or disapproved based on all relevant factors, including your trading experience. See www.TradeStation.com . Visit www.TradeStation.com for full details on the costs and fees associated with options.
Margin trading involves risks, and it is important that you fully understand those risks before trading on margin. The Margin Disclosure Statement outlines many of those risks, including that you can lose more funds than you deposit in your margin account; your brokerage firm can force the sale of securities in your account; your brokerage firm can sell your securities without contacting you; and you are not entitled to an extension of time on a margin call. Review the Margin Disclosure Statement at www.TradeStation.com .
TradeStation Securities, Inc. and TradeStation Technologies, Inc. are each wholly owned subsidiaries of TradeStation Group, Inc., both operating, and providing products and services, under the TradeStation brand and trademark. When applying for, or purchasing, accounts, subscriptions, products and services, it is important that you know which company you will be dealing with. Visit www.TradeStation.com for further important information explaining what this means.

Alphabet - CorrectionThe upward move started in mid-October 2025.
A full five-wave bullish cycle has been completed.
The market is now developing corrective wave A .
Targets:
Intermediate: 292
Primary: 280
---
Please subscribe and leave a comment.
You’ll get new information faster than anyone else.
---

4 consecutive down days for GOOG? Yes, please. Long @ 307.59GOOG has had 4 consecutive down closes only 7 times so far this year. Today makes 8. In the previous 7 instances, it returned at least 2% in 7 trading days or less 6 of the 7 times and a gain all 7 times .
That is all. Very simple today. I'll hold until it hits a sell signal for me and tactically add and sell along the way if necessary.
As always - this is intended as "edutainment" and my perspective on what I am or would be doing, not a recommendation for you to buy or sell. Act accordingly and invest at your own risk. DYOR and only make investments that make good financial sense for you in your current situation.

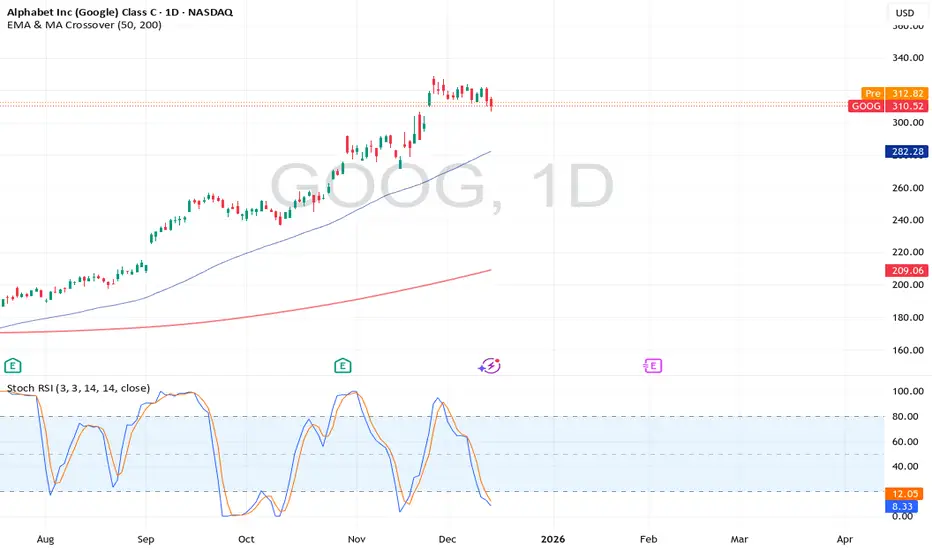
How To Enter Using The 3-Step Rocket Booster StrategyThe price is following the trend line upward
Waiting for the stochastic to signal momentum shift
for entry.
Avoid entering the trade
before the stochastic crosses below
This is the entry signal you should wait for.
You may be thinking,
" But what if it doesn't go my way?"
Yes the trade may end up going in the
opposite direction
But you need to make sure you
have planned for risk management and profit taking
ranges between 10% to 50%
This range is what i saw in the cashflow
board game
created by Richdad company.
Also remember that this price action
follows the 3 step rocket booster strategy
What is the Rocket booster strategy?
1-The price has to be above the 50 EMA
2-The price has to be above the 200 EMA
3-The price should gap up or reverse in this case
Rocket boost this content to learn more.
Disclaimer:Trading is risky please use a simulation
trading account before you trade with real money
GOOGL OutlookQuick expectations for GOOGL
Buying around $276.43 - $296.62, area will most likely hold, if we even get to see it again in the near future.
If we come back to $237.01 - $253.84 liquidate all you got and get GOOGL, if the macro economics permit it and we don't break down because of rate hikes or other stuff.
Watch for that Santa Rally.
Enjoy.
