Here is YOUR chance Bottom Bull Flag 16-20 % Upside16-20 % Upside
300-310 End of 7 Days Distribution
Bottom Bull Flag
Every single Tools Bottoms
Alphabet Inc (Google) Class A
No trades
Market insights

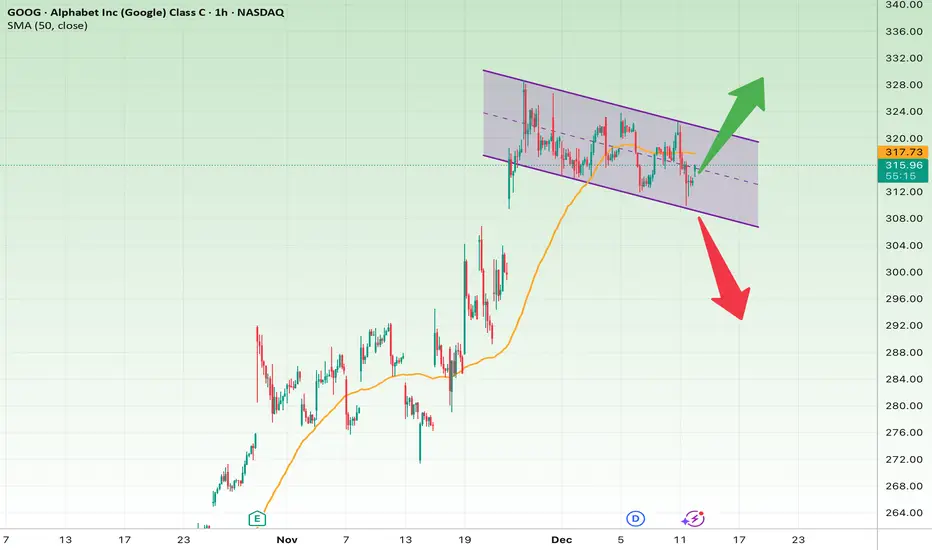
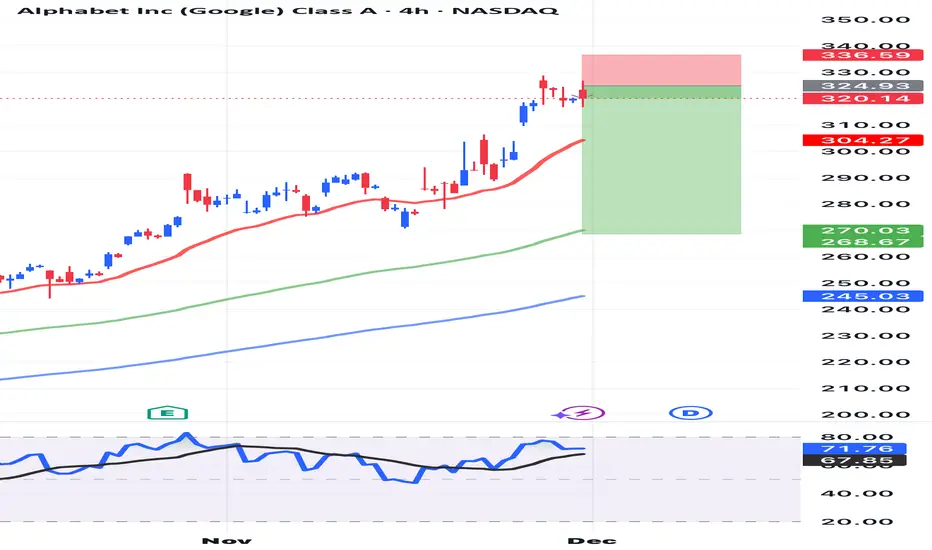
Technical Analysis of GOOG (1H Timeframe)The price is currently oscillating inside a short-term descending channel. Multiple touches on both the upper and lower boundaries increase the pattern’s reliability. The SMA50 is positioned slightly above the price and is acting as resistance for now.
This structure suggests that the market is trapped between two scenarios and is likely to experience a breakout or breakdown soon.
Bullish Scenario
If the price breaks above the channel resistance (around 319–320) and closes a confirming candle above it:
Targets
• Target 1 → 323
• Target 2 → 327–328 (full channel breakout)
• Target 3 → 332
Stop-Loss
• A close below 313
Bullish Reasons
• EMA/SMA are beginning to flatten and may shift back upward
• Price action at the channel bottom signals active demand
• A bullish reversal pattern often forms after a short-term descending channel
Bearish Scenario
If the price breaks below the channel support at 310:
Targets
• Target 1 → 304–305
• Target 2 → 298–300
• Target 3 → 292
Stop-Loss
• A close back above 316–317
Bearish Reasons
• The MA50 is currently acting as resistance
• The descending channel has strong validity
• Multiple rejections at the channel top
Quick Summary
• GOOG is compressed inside a short-term descending channel.
• Break above 320 → continuation of the bullish move.
• Break below 310 → deeper correction likely.
• For now, the market is in a neutral to slightly bearish stance.
GOOGL - Searching for a new high=======
Volume
=======
-slight increase
==========
Price Action
==========
- Bullish flag noticed and px broke out of flag
- Rounding bottom
- Weak selling pressure
=================
Technical Indicators
=================
- Ichimoku
>>> price above cloud
>>> Green kumo expanding
>>> Tenken + Chiku - above clouds and sloping upwards
>>> Kijun - Above clouds and sloping upwards
=========
Oscillators
=========
- MACD turning bullish
- DMI turning bullish
- StochRSI, bullish, crossed and within band
=========
Conclusion
=========
- short to long term breakout swing
- price may reverse at current level, to enter spot or wait for pullback at entry 2.

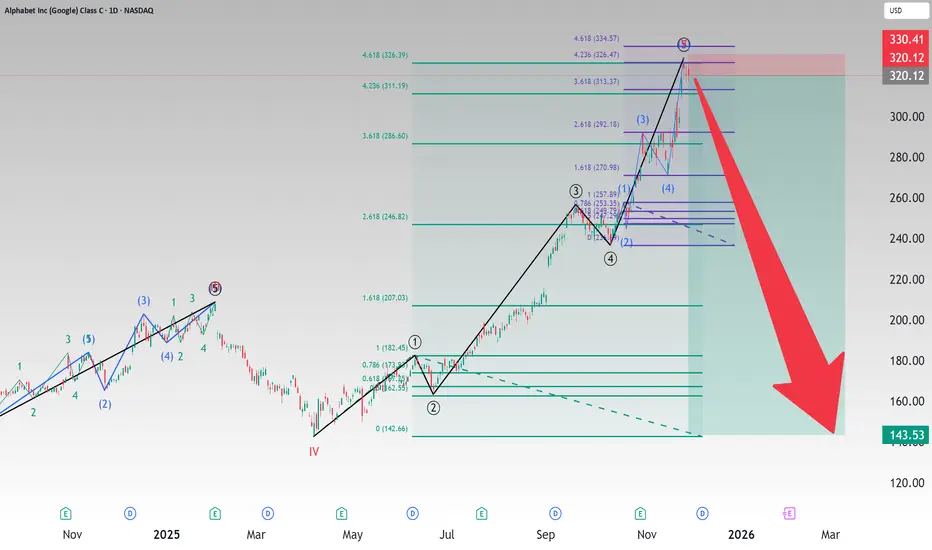
GOOG: 5-Wave Top Completed, A-B-C Pullback Toward 288-300GOOG – Elliott Wave: 5-Wave Top Completed, A–B–C Pullback Toward 288–300 (Blue Box)
Primary Count favors a bullish continuation after Wave C completes
Summary:
GOOG has likely completed a clean 5-wave impulse near 328–330, and is now forming a standard A–B–C corrective pattern.
The primary expectation is a short-term bounce (Wave B) followed by a deeper pullback into the 288–300 Blue Box, where bulls may regain control and start the next upward trend leg.
Primary Count (5–3–5):
Wave A: Initial decline from the 328 top. Holding above 305–308 short-term support.
Wave B: Expected rebound toward 320–324 (lower high + resistance zone). Seen as a counter-trend rally.
Wave C: High-probability target at 288–300 (Blue Box), 50% retracement, Equal Legs (A = C), Prior structure support. If this zone holds → bulls regain control → next trend leg starts.
Alternative Count:
If Wave C breaks below 280, the A–B–C structure becomes invalid, and GOOG likely enters a larger-degree correction, targeting: 265–270 (0.618 retracement). Potential extension toward 250 in a deeper correction wave
Key Levels:
Resistance: 320–324 (Wave B), 330 (invalidates correction → new impulse wave)
Support: 305–308 (A-wave support)
Major Buy Zone: 288–300 (Blue Box)
Invalidation: Break below 280
Structure Notes:
Impulse (1–5) completed with Wave 3 strongest
Wave 4 alternation vs Wave 2 is clean
Momentum divergence into Wave (5) top
MACD & RSI support corrective phase
Price still above 200-day SMA → long-term bullish trend intact
Disclaimer: This analysis is for educational purposes only and is not investment advice. Please do your own research (DYOR) before making any trading decisions.

GOOGL Calls Alert: Bullish Momentum Building📊 GOOGL Trading Information — Weekly (12/11)
Recommendation: BUY CALLS
Confidence: 60% (Medium)
Conviction: MEDIUM
Expiry: 12/19 (8 days)
🧠 Why CALLS?
Katy AI Forecast
Predicts move to $315.63 (+1.25%)
Peak expected around $318.31 (+2.10%)
Smooth upward momentum into Friday morning
Technical Picture
Current price: $311.75
MACD shows bullish divergence
VWAP: $316.09 → upside room
Week position: 46.7% of range → upside runway intact
News / Flow
Mixed news: EU fine (bearish), Fortnite return (bullish)
PCR 1.43 → put-heavy (potential for squeeze)
Weak bearish flow mainly hedging, not directional
💰 Trade Setup
Strike: $312.50 CALL
Entry: $5.55 – $5.65
Target 1: $8.40
Target 2: $11.20
Stop Loss: $3.36
Position Size: 3%
Risk Level: 🟠 Moderate
⚠️ Notes
Katy AI confidence is low (50%) → monitor closely
Regulatory news may cause unexpected volatility
Weekly momentum is neutral → timing matters
Consider scaling in instead of full entry
📝 Quick Summary
GOOGL shows early-week consolidation with bullish momentum forming. Katy AI and technicals agree on a push toward $315–318. Bearish options flow increases the upside squeeze potential. Calls favored for this weekly setup.

Global Trading Economics Risk1. Macroeconomic Risks in Global Trade
Macroeconomic risks arise from changes in global economic conditions. These are the most common risks that affect trade flows, demand, profits, and investment decisions.
a) Economic Slowdowns and Recessions
When major economies like the US, China, or the EU slow down, global trade demand drops sharply. Lower consumer spending reduces imports, companies cut production, and global supply chains weaken. Recessions also increase unemployment, reduce investment, and cause businesses to delay expansion.
b) Inflation Risk
High inflation increases production costs, reduces the purchasing power of consumers, and forces central banks to raise interest rates. When interest rates rise:
borrowing costs go up
companies reduce investment
currency values fluctuate
export and import dynamics shift
Countries with high inflation become less competitive in global markets.
c) Interest Rate Risk
Central banks around the world adjust interest rates to control inflation, stabilize the currency, or stimulate growth. Higher interest rates strengthen a country’s currency, making exports expensive and imports cheaper. Lower interest rates weaken the currency and stimulate exports. These fluctuations directly impact global trade volumes and profitability.
2. Currency Risk in Global Trade
Currency risk is one of the biggest challenges in international trade. Because transactions usually happen in global currencies like USD, EUR, or GBP, sudden changes in exchange rates can create huge gains or losses.
a) Exchange Rate Volatility
If a country's currency depreciates suddenly, its exports become cheaper globally, but its imports become costly. On the other hand, a strong currency makes exports expensive and reduces foreign demand.
b) Currency Wars
Sometimes countries intentionally devalue their currency to boost exports. This creates competitive tension between nations and increases uncertainty for international traders.
c) Hedging Challenges
Companies use forex instruments (like forward contracts, options, and swaps) to protect themselves from currency movements. But hedging itself carries costs and complexity.
3. Geopolitical and Political Risks
Political instability and geopolitical conflicts are major sources of global trading risk. Any disruption in political relations impacts trade policies, supply routes, and investor confidence.
a) Trade Wars
Trade wars happen when countries impose tariffs and sanctions on each other’s imports. The US-China trade war is a clear example, with tariffs creating uncertainty for businesses and raising costs for consumers.
b) Conflicts and Wars
Geopolitical conflicts disrupt supply chains, increase commodity prices (especially oil and gas), and restrict trade routes. For example:
Middle East conflicts disrupt crude oil supply.
Russia–Ukraine conflict affected global wheat, gas, and fertilizer markets.
c) Policy Changes
Government decisions such as new taxes, export restrictions, sanctions, or regulatory reforms can abruptly change trade conditions.
d) Political Instability
Countries with unstable governments experience disruptions in production, currency fluctuations, investment losses, and lower international trust.
4. Supply Chain and Logistics Risks
Global trade depends on efficient supply chains. Any disruption can cause shortages, delays, and increased costs.
a) Shipping Delays and Container Shortages
Events such as port congestion, strikes, and logistical bottlenecks lead to delivery delays and higher freight costs.
b) Natural Disasters
Earthquakes, floods, cyclones, and pandemics can shut down ports, factories, and production hubs, affecting global supply networks.
c) Supply Chain Dependencies
Many countries depend heavily on specific nations for essential goods like semiconductors, crude oil, food, and pharmaceuticals. Disruptions in these supply hubs can impact global trade stability.
d) Transportation Risk
Breakdowns in transportation networks—such as railway issues, air cargo restrictions, or shipping route closures—cause massive trade disruptions.
5. Regulatory and Compliance Risks
International trade is heavily regulated. Countries follow trade agreements, tariffs, environmental rules, and safety standards.
a) Tariff Risk
Changes in customs duties, import taxes, and trade barriers can alter the profitability of cross-border sales.
b) Trade Agreement Risk
Countries may withdraw from agreements (like Brexit), renegotiate tariffs, or impose new conditions.
c) Compliance Risk
Businesses must follow:
environmental standards
labor laws
product quality rules
customs documentation
Non-compliance leads to fines, shipment delays, or bans.
6. Technological Risks in Global Trading Economics
Technology plays a critical role in modern trade, but it also introduces new risks.
a) Cybersecurity Threats
Hackers target:
financial transactions
supply chain software
logistics systems
digital shipping documents
A cyberattack can halt operations and compromise sensitive data.
b) Automation and AI Risks
Automation increases efficiency but also creates job losses and inequality. Over-reliance on AI systems can escalate risks if they malfunction.
c) Digital Trade Barriers
Countries sometimes restrict data transfers or impose digital taxes, affecting companies operating globally.
7. Commodity Market Risks
Global trade heavily depends on commodities like crude oil, natural gas, metals, and agricultural produce.
a) Price Volatility
Commodity prices fluctuate due to demand-supply imbalances, geopolitical tensions, weather conditions, or speculation. High volatility affects production costs and profit margins.
b) Resource Dependency
Countries dependent on a single commodity face extreme risk when prices fall (e.g., oil-exporting nations during a crude price crash).
8. Environmental and Climate Risks
Climate change is becoming one of the most significant long-term global trading risks.
a) Extreme Weather
Storms, droughts, and floods disrupt trade, damage crops, and shut down industries.
b) Carbon Taxes and Emission Rules
Global environmental regulations are changing how companies operate. Carbon taxes increase costs for exporters, especially in energy-intensive industries.
c) Sustainability Pressure
Consumers and governments demand eco-friendly production. Companies that fail to adapt face loss of market access.
9. Global Financial Market Risks
Financial markets influence trade through stock market performance, liquidity conditions, and investor sentiment.
a) Credit Risk
Companies and governments rely on global financing. Liquidity crises or credit downgrades increase borrowing costs.
b) Banking Risk
Banking collapses or regulatory failures impact trade finance, currency markets, and investor confidence.
10. Risk Management in Global Trading Economics
Companies and investors use several strategies to manage global trading risks:
Hedging using futures, options, and swaps
Diversifying markets and suppliers
Setting up supply chain redundancies
Political risk insurance
Strong financial planning
Digital security systems
Scenario analysis and stress testing
Effective risk management ensures long-term stability and profitability in global trade.
Conclusion
Global trading economics risks are unavoidable in today’s interconnected world. They emerge from economic cycles, political tensions, currency movements, supply chain disruptions, commodity volatility, and environmental changes. For traders, investors, and businesses, understanding these risks and adopting effective risk-management strategies is crucial to surviving and succeeding in global markets.

GOOGL Weekly Momentum Signal — Bullish Bias with CautionGOOGL Weekly Signal | 2025-12-09
BUY CALLS
Confidence: 58% (Low Conviction)
Risk Level: High — use small size
🔢 Options Setup
Strike: $317.50 (ATM)
Expiry: 2025-12-12 (3 days)
Entry Range: $4.25 – $4.30
Target 1: $6.38
Target 2: $7.50
Stop Loss: $2.85
Position Size: 2% of portfolio
📊 Market Conditions
Price: $317.81
Weekly Momentum: Bullish +1.15%
VWAP Support: $316.86
Volume: 0.1× normal (light)
Put/Call Ratio: 0.76 (bullish flow)
🤖 Katy AI
Trend: Neutral
Confidence: 50%
Slight upward bias to $319.58 (+0.56%)
📰 News Sentiment
Strong Google Cloud AI partnership news
Gemini user growth positive
Sector-wide tech/AI bullish momentum
⚠️ Key Notes
Low conviction → reduce size
Short expiry → fast decay
Light volume → possible whipsaws
Bitcoin is bounded by 69*Mag6The historical ceiling price of Bitcoin is 69*Mag6. Using the SMA ribbon you can see where it is historically overbought or oversold.

ESG Investing and Green Finance1. Understanding ESG: Environmental, Social, and Governance
ESG investing involves evaluating companies not only on financial performance but also on how well they manage environmental, social, and governance risks and opportunities. It helps investors identify sustainable businesses that are better positioned for long-term growth.
1.1 The Environmental Component (E)
This dimension examines how a company impacts the planet. Key factors include:
Carbon emissions and climate impact
Energy efficiency and renewable energy usage
Waste management and recycling
Water usage and conservation
Biodiversity protection
Investors focus on whether a company has strategies to reduce climate risk, comply with environmental regulations, and transition towards greener operations.
1.2 The Social Component (S)
This pillar evaluates a company's relationship with people—employees, customers, suppliers, and communities. It includes:
Labor rights, wages, and workplace safety
Diversity, equity, and inclusion (DEI)
Customer privacy and data protection
Human rights across supply chains
Community development and social welfare initiatives
Companies with strong social practices tend to have better employee retention, improved brand reputation, and lower legal risks.
1.3 The Governance Component (G)
Governance is about the ethical and transparent management of a company. Criteria include:
Board independence and diversity
Shareholder rights and protections
Anti-corruption policies
Executive compensation linked to performance
Transparent reporting and accountability
Good governance reduces the chances of scandals, fraud, and mismanagement, making the company a safer long-term investment.
2. ESG Investing in Practice
2.1 ESG Screening Methods
Investors use different strategies to integrate ESG:
Negative Screening: Excludes harmful industries (tobacco, weapons, coal).
Positive Screening: Selects companies with high ESG scores.
Best-in-Class Selection: Chooses top performers in each sector.
Integration Approach: Combines ESG data into financial analysis.
Active Ownership: Investors influence companies through voting and engagement.
2.2 ESG Ratings and Data Providers
Agencies like MSCI, Sustainalytics, Refinitiv, and S&P Global provide ESG scores. These ratings help investors compare companies and assess risks.
2.3 Why ESG Investing Is Growing Rapidly
Several forces are driving global adoption:
Climate change concerns
Government regulations and carbon policies
Demand from millennials and Gen-Z investors
Corporate transparency and pressure from stakeholders
Better long-term risk-adjusted returns
Research shows that companies with high ESG performance often deliver higher resilience during economic downturns and more stable cash flows.
3. Green Finance: Capital for a Sustainable Future
Green finance refers to financial instruments and investments specifically designed to support environmentally friendly projects. While ESG investing evaluates companies broadly, green finance channels capital exclusively toward environmental sustainability.
3.1 Key Components of Green Finance
Green Bonds
These are debt instruments where funds are used for climate or environmental projects such as solar plants, wind farms, green buildings, or pollution reduction.
They are issued by governments, corporations, and global institutions.
Green Loans
Loans provided to businesses for sustainable and energy-efficient projects.
Sustainability-Linked Bonds (SLBs)
Interest rates vary depending on a company’s achievement of sustainability targets such as emission reductions.
Climate Funds
Investment pools dedicated to renewable energy, carbon reduction, and environmental innovation.
Carbon Markets and Credits
Companies purchase carbon credits to offset emissions, promoting global decarbonization.
Green Banks
Specialized financial institutions supporting low-carbon infrastructure.
3.2 Priority Sectors in Green Finance
Green finance focuses on sectors with high environmental impact:
Renewable energy (solar, wind, hydro)
Electric mobility and battery technologies
Green buildings and energy-efficient infrastructure
Waste management and recycling
Water treatment and desalination
Sustainable agriculture
Climate adaptation and resilience projects
4. How ESG and Green Finance Work Together
While ESG investing evaluates a broad spectrum of ethical factors, green finance is narrowly targeted at environmental impact. Yet, both frameworks complement each other:
ESG encourages companies to adopt sustainable behavior, improving overall corporate responsibility.
Green finance provides funding for environmentally beneficial projects.
Together, they push global markets toward decarbonization, resource efficiency, and ethical governance.
For example, an energy company with strong ESG scores may issue green bonds to finance its transition from coal to renewable energy. Institutional investors, looking for sustainable portfolios, buy these bonds—creating a cycle of positive environmental impact and financial returns.
5. Benefits of ESG Investing and Green Finance
5.1 For Investors
Better risk management (climate, legal, and reputational).
Potential for long-term stable returns.
Alignment with future regulatory trends.
Access to innovative sectors like clean energy and sustainable tech.
5.2 For Companies
Lower cost of capital due to ESG-focused investors.
Stronger brand identity and customer loyalty.
Enhanced operational efficiency through sustainable practices.
Better compliance with environmental regulations.
5.3 For Society and the Environment
Reduced carbon emissions and pollution.
Promotion of clean energy and green technologies.
Improved labor conditions and community welfare.
More ethical and transparent corporate behavior.
6. Challenges and Criticisms
Despite rapid growth, ESG and green finance face several obstacles.
6.1 Greenwashing
Some companies exaggerate sustainability claims to attract investors. This undermines trust and calls for stricter reporting standards.
6.2 Lack of Standardization
Different ESG rating agencies use different methodologies, leading to inconsistent scores.
6.3 Data Quality Issues
Many companies do not disclose complete or accurate ESG data.
6.4 Balancing Returns vs Sustainability
Some investors believe ESG restrictions may limit short-term profits. However, long-term benefits are increasingly evident.
7. The Future Outlook
ESG investing and green finance are expected to dominate global markets.
Key trends include:
Mandatory climate disclosures by companies
Rise of sustainable index funds and ETFs
Growth in green bond markets
AI-driven ESG analytics
Government incentives for clean energy
Integration of biodiversity and natural capital into finance
Financial institutions, governments, and corporations are aligning capital flows with sustainability goals such as the Paris Agreement and UN SDGs.
Conclusion
ESG investing and green finance mark a new era where profits and purpose converge. Investors are no longer satisfied with traditional financial metrics; they want companies to deliver long-term value while safeguarding the environment and society. ESG frameworks help identify responsible businesses, and green finance mobilizes capital for sustainable projects. Together, they build a financial ecosystem that promotes resilience, ethical conduct, and environmental protection. As global challenges intensify, ESG and green finance will continue shaping the future of economic development—driving the world towards a greener, more inclusive, and more sustainable future.
The Crucial Role of Global Trade1. Economic Growth and Development
The most immediate and apparent role of global trade is its contribution to economic growth. Trade enables countries to specialize in producing goods and services in which they have a comparative advantage—a concept introduced by economist David Ricardo. Comparative advantage means that countries can produce certain products more efficiently than others. For instance, a country with abundant fertile land may focus on agriculture, while a technologically advanced nation may concentrate on electronics or software development. By exchanging these goods and services, countries can maximize efficiency and output, leading to higher GDPs and improved living standards.
Global trade also promotes industrial diversification. By participating in international markets, nations are incentivized to develop new industries, upgrade technology, and improve infrastructure. Emerging economies, such as China and India, have leveraged trade to transform their economic landscapes, moving from agrarian-based systems to industrial and service-driven economies within decades. Furthermore, trade contributes to employment generation by creating new jobs in export-oriented sectors and associated industries like logistics, finance, and technology.
2. Access to Goods and Services
Global trade allows countries to access products that may be unavailable or too expensive domestically. This enhances consumer choice and ensures that people benefit from goods that would otherwise be out of reach. For example, tropical fruits like bananas or coffee can be enjoyed in regions with cold climates because of trade. Similarly, high-tech gadgets, pharmaceuticals, and machinery are often imported from countries with advanced technological capabilities.
By facilitating access to a broader range of goods and services, global trade also promotes competition. Domestic producers must innovate and improve quality to remain competitive against international competitors, ultimately benefiting consumers through better products and lower prices.
3. Technological Advancement and Innovation
Trade is not only about goods and services; it also facilitates the transfer of knowledge and technology. When countries engage in international trade, they often adopt new production techniques, management practices, and innovations from their trading partners. This exchange fosters technological diffusion, which can accelerate industrialization and modernization.
Multinational corporations (MNCs) play a pivotal role in this process. Through foreign direct investment (FDI), MNCs bring in advanced technology, management expertise, and capital, stimulating local economies and raising productivity. For instance, the entry of foreign automotive companies into emerging markets has often led to the adoption of cutting-edge manufacturing techniques, quality standards, and research and development capabilities in those regions.
4. Enhancing International Relations
Global trade serves as a bridge between nations, fostering interdependence and cooperation. Countries that trade extensively are less likely to engage in conflict because their economies are mutually connected. This concept, often referred to as the "commercial peace theory," suggests that trade creates incentives for diplomatic resolution of disputes rather than resorting to military action.
Trade agreements and regional blocs, such as the European Union (EU), the North American Free Trade Agreement (NAFTA), now replaced by the United States-Mexico-Canada Agreement (USMCA), and the Association of Southeast Asian Nations (ASEAN), exemplify how economic interdependence can strengthen political and strategic relationships. These agreements provide frameworks for conflict resolution, promote political dialogue, and encourage harmonization of regulations and standards.
5. Global Supply Chains and Economic Resilience
In the modern global economy, trade underpins complex supply chains that span multiple continents. These supply chains allow producers to source raw materials from one country, manufacture components in another, and assemble final products elsewhere. Such interconnections increase efficiency, reduce costs, and enable countries to respond flexibly to demand fluctuations.
However, global trade also exposes economies to vulnerabilities, as seen during the COVID-19 pandemic when disruptions in supply chains caused shortages of essential goods worldwide. Despite these challenges, trade networks remain crucial for resilience, as they allow countries to diversify suppliers, maintain reserves, and adapt to changing conditions.
6. Reduction of Poverty and Inequality
Global trade has a significant role in poverty reduction, particularly in developing countries. Export-oriented growth strategies can create jobs, increase wages, and raise living standards. For instance, the export-led manufacturing boom in East Asia lifted millions of people out of poverty over the past few decades. By participating in global markets, developing nations can generate revenue to invest in education, healthcare, and infrastructure, creating a virtuous cycle of growth and development.
Moreover, trade can help reduce income inequality between nations by offering poorer countries opportunities to integrate into the global economy. While domestic inequality may persist, global trade can level the playing field by enabling developing countries to compete internationally and improve their citizens’ economic prospects.
7. Cultural Exchange and Global Understanding
Beyond economics, global trade promotes cultural exchange. The movement of goods, services, and people leads to the diffusion of ideas, lifestyles, and traditions. Products such as fashion, cuisine, music, and art often cross borders alongside commerce, fostering cultural appreciation and understanding. In a world facing global challenges such as climate change and pandemics, mutual understanding and cooperation are essential, and trade acts as a conduit for building these bridges.
8. Challenges and Considerations
While global trade offers immense benefits, it is not without challenges. Trade imbalances, protectionism, unfair competition, and exploitation of labor are pressing concerns. Additionally, overreliance on global markets can expose economies to external shocks, such as financial crises, political instability, or natural disasters in trading partner countries. Sustainable and fair trade practices, along with robust regulatory frameworks, are essential to ensure that trade remains a force for inclusive and long-term development.
Conclusion
Global trade is a fundamental driver of economic prosperity, technological advancement, cultural exchange, and international cooperation. It enables countries to specialize, innovate, and access a wider variety of goods and services. It promotes peace, enhances resilience through interconnected supply chains, and has the potential to reduce poverty and inequality worldwide. However, the benefits of trade must be balanced with policies that mitigate risks, ensure fairness, and promote sustainable development.
In the contemporary era, where globalization defines economic and social landscapes, the crucial role of global trade cannot be overstated. It remains not just an economic mechanism but a vital force shaping the trajectory of human progress, international relations, and global well-being.

Quant signals V3 GOOG Katy AI 1M Forecast: Bearish Drift AheadGOOG QuantSignals Katy 1M Prediction 2025-12-02
QuantSignals Katy AI Stock Analysis
Analyzed 1 stock(s): GOOG
GOOG Analysis:
Current Price: $318.32
Final Prediction: $316.01 (-0.73%)
30min Target: $315.65 (-0.84%)
Trend: BEARISH
Confidence: 54.9%
Volatility: 21.3%
Summary: Generated 0 trade signals from 1 successful analyses out of 1 symbols.

GOOG - Preparing to Run AgainIt would appear GOOG is finishing a corrective "B" wave and will soon turn upward for a "C" Wave toward a target of 364.
Note that there is a zone from 339 to 349 where we might see an early reversal down to a Wave 4. It appears to want to move toward its trend line though, which would require a slightly extended run. Be cautious in this zone.
GOOG Generally moves in a corrective pattern (ABC) upward and downward, which introduces volatility, but overall, I have about 70% confidence in this move once the current B wave finishes .

November's Tech Shake-Up: Google vs. Nvidia DivergenceNovember marked the widest divergence yet between Google and Nvidia NASDAQ:NVDA . Nvidia’s pullback wasn’t just routine profit-taking—markets started pricing in a strategic shift by hyperscalers potentially moving away from GPU-only AI stacks. This narrative could dilute Nvidia’s moat, while bolstering demand for diversified AI infrastructure players like Google.
📊 GOOGL Setup: Strong Fundamentals, Strategic Support
Google remains fundamentally strong and technically well-supported. With earnings resilience and infrastructure independence, NASDAQ:GOOGL may outperform if tech rotation accelerates. The stock is sitting above a clear demand zone, offering a calculated risk-reward play.
🔔 Trade Idea
Entry Zone: $252 – $256 (support area)
Take Profit 1: $292
Take Profit 2: $327
Stop Loss: $225
📌 This aligns with multi-month support and potential breakout continuation.

Risks and Opportunities in the Global MarketOpportunities in the Global Market
Market Expansion and Revenue Growth
One of the primary opportunities in the global market is access to a much larger customer base. Companies can transcend domestic limitations and tap into emerging markets where consumer demand is growing rapidly. For example, markets in Asia, Africa, and Latin America offer a burgeoning middle class eager for goods, services, and technology, presenting massive revenue potential for multinational corporations. By diversifying geographically, businesses can reduce dependence on a single economy and enhance growth prospects.
Diversification of Investments
Global markets allow investors to diversify their portfolios across countries, sectors, and asset classes. Diversification reduces exposure to localized economic shocks and political instability. For instance, investing in equities, bonds, or commodities in different regions can balance risks arising from currency fluctuations, interest rate changes, or domestic policy shifts. This strategic allocation of resources can improve the risk-return profile of investments significantly.
Access to Innovation and Technology
Global integration fosters technological exchange and innovation. Companies can leverage global research and development networks, access advanced manufacturing technologies, and adopt best practices from international competitors. For emerging economies, collaboration with global firms can accelerate industrialization, improve efficiency, and enhance product quality. Likewise, global partnerships in sectors like artificial intelligence, renewable energy, and biotechnology create opportunities for breakthrough innovations that can reshape entire industries.
Economies of Scale and Cost Efficiency
Operating in the global market enables companies to achieve economies of scale. Large-scale production and sourcing from multiple countries often reduce costs, improve margins, and increase competitiveness. For instance, technology firms may design products in one country, source components from another, and sell worldwide, optimizing both production costs and logistics. Additionally, access to cheaper labor and raw materials in developing economies can further enhance profitability.
Financial and Capital Access
Global financial markets provide businesses and governments with access to diverse funding sources. Companies can raise capital through international stock exchanges, global bonds, or foreign direct investment. Governments can finance infrastructure and development projects through international loans or aid. This access to global capital allows for ambitious projects and long-term strategic investments that would otherwise be unattainable.
Strategic Partnerships and Alliances
The global market encourages cross-border collaborations. Strategic alliances, joint ventures, and mergers allow companies to enter new markets more efficiently and share risks. Partnerships with local firms also help navigate regulatory environments, cultural differences, and logistical challenges. Collaborative ventures often drive innovation, improve market penetration, and enhance brand credibility in foreign markets.
Risks in the Global Market
Economic Volatility and Financial Crises
Global markets are highly interconnected, making them susceptible to economic volatility. A crisis in one major economy can ripple across borders, affecting trade, investment, and employment worldwide. The 2008 financial crisis and the COVID-19 pandemic demonstrated how quickly global shocks can destabilize markets. Currency devaluations, stock market crashes, and sudden shifts in capital flows are persistent risks for investors and multinational companies.
Political and Geopolitical Risks
Political instability, trade disputes, and geopolitical tensions pose significant risks. Conflicts, sanctions, or changes in government policies can disrupt supply chains, inflate costs, and limit market access. For instance, trade wars between major economies may lead to tariffs, export restrictions, and reduced demand for goods. Political risk is particularly relevant for companies investing in emerging markets, where governance structures may be less predictable.
Regulatory and Compliance Challenges
Global operations require navigating a complex web of regulations, including taxation, labor laws, environmental standards, and data protection. Non-compliance can result in legal penalties, reputational damage, or operational shutdowns. Differences in regulations across countries also make standardization difficult, increasing operational costs and complexity. Companies must continuously monitor regulatory developments to mitigate compliance risks effectively.
Currency and Exchange Rate Risks
Engaging in international trade and investment exposes companies and investors to currency risk. Exchange rate fluctuations can impact profit margins, investment valuations, and competitiveness. For example, a strengthening domestic currency can make exports more expensive, reducing sales abroad. Conversely, a weakening currency may inflate the cost of imported raw materials. Hedging strategies, while useful, do not eliminate currency risk entirely.
Supply Chain Disruptions
Global supply chains are vulnerable to natural disasters, pandemics, labor strikes, and geopolitical tensions. Disruptions can delay production, increase costs, and reduce customer satisfaction. For example, the COVID-19 pandemic revealed the fragility of just-in-time supply chains, prompting companies to reconsider sourcing strategies and inventory management. Dependence on specific regions for critical components increases operational risks.
Technological and Cybersecurity Risks
While global markets offer access to technology, they also expose businesses to cybersecurity threats. Data breaches, intellectual property theft, and cyberattacks can lead to financial loss, reputational damage, and legal liabilities. Rapid technological changes also create the risk of obsolescence; companies that fail to innovate may lose competitive advantage. Protecting digital infrastructure and continuously adapting to technological trends is critical for global operations.
Cultural and Market Risks
Entering new markets involves understanding local consumer behavior, culture, and preferences. Misreading these factors can result in product failures, marketing missteps, and brand damage. Companies must adapt strategies to local contexts while balancing global standardization. Failure to address cultural sensitivities can hinder market acceptance and growth.
Balancing Risks and Opportunities
Navigating the global market requires a careful balance between seizing opportunities and mitigating risks. Strategies for achieving this balance include:
Diversification: Spread investments across multiple countries, sectors, and currencies.
Risk Management: Implement financial hedging, insurance, and contingency planning.
Strategic Alliances: Collaborate with local partners to reduce market entry risks.
Technology and Innovation: Invest in digital infrastructure, cybersecurity, and R&D.
Compliance and Governance: Maintain robust regulatory compliance and ethical standards.
Agility and Adaptation: Be flexible in responding to geopolitical, economic, and market changes.
Conclusion
The global market is a dynamic landscape characterized by immense opportunities and significant risks. Companies and investors that can navigate these complexities stand to gain from expanded markets, innovation, cost efficiencies, and diversified revenue streams. However, economic volatility, political uncertainties, regulatory complexities, and technological risks demand careful planning, proactive risk management, and strategic foresight. The key to success lies in balancing the pursuit of growth with robust safeguards, leveraging both global connectivity and local insight. In an increasingly interconnected world, the ability to adapt and innovate while managing risk will define the long-term winners in the global market.
GOOGLHow to become successful in forex and stock trading: 1.Master fundamentals and technical analysis. 2,Build and follow a solid trading plan. 3.Apply strict risk management (1–2% rule). 4.Stay disciplined—control fear and greed. 5.Record and analyze every trade. 6.Focus on high-quality setups only. 7.Diversify across assets and markets. 8.Keep evolving—study, adapt, and grow daily.
Google (GOOGL): Bullish Reversal in Play – Eyeing $237 TargetBullish Engulfing and Fibonacci Channel Support
Last week’s green candle on the weekly chart of NASDAQ:GOOGL has engulfed the main body of the previous red candle, signaling a potential trend reversal. Moreover, the price has respected a key support level within the Fibonacci channel, further strengthening the bullish sentiment.
Key Observations:
Fibonacci Channel:
The stock is moving well within an upward Fibonacci channel, indicating a healthy uptrend.
Current support is holding at the midline, confirming buyers' interest at this level.
Bullish Candle Formation:
A clear bullish engulfing candle pattern has formed, a strong reversal signal.
Upside Potential:
Based on Fibonacci extensions and channel resistance, the next major target lies at $237, offering a ~20% upside from the current levels.
Moving Averages:
The price is trading above key moving averages (20, 50, and 200-week), reinforcing a strong bullish outlook.
What to Watch:
Volume confirmation will be crucial to validate this move.
Keep an eye on the support at $173.96 and $167.59 (short-term MAs) to manage risk effectively.
💡 Trade Idea:
A breakout above $196 could provide a clear signal to ride this uptrend. Consider trailing stops as the stock approaches $237 to lock in gains.

Google Short: 5-waves completion with Fibonacci ExtensionsOver here, I want to discuss the possibility that Google has peaked. I know that I am going against Berkshire Hathaway. But then, we can really confirm if the latest decision is really made by Warren Buffett given that he has also recently announced his retirement? And Charlie Munger is no longer with him.
Of course, I've always given my analysis based on Wester TA (chart patterns), Japanese TA (Candlesticks), and Elliott Waves. And over here, I present to you the potential 5-waves that might have completed on Google. And that is supported by 2 Fibonacci extensions:
1. From Primary Wave 1 across the entire wave, and
2. From Intermediate Wave 1 of 5 across entire Primary Wave 5.
But these are not certainties but probabilities and most importantly, risk-reward.
For this idea, the stop is most important: slightly above the All-time-high: $328.67. I would say that you can put the stop at $329 or $330. If Google goes beyond and makes new ATH, then this idea can be trashed.
The take profit is at the previous wave 4 of a higher degree, or the low made on 7th April 2025: $142.66.
Good luck!
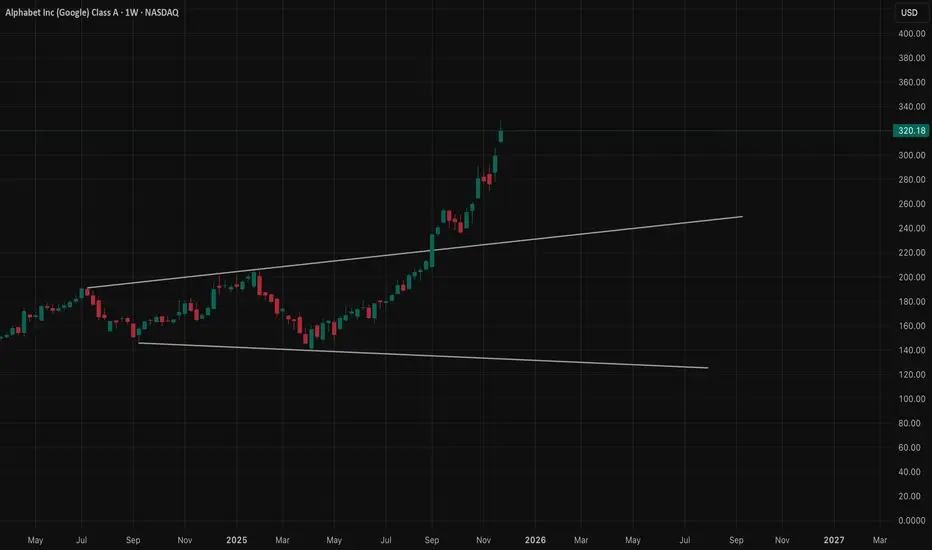
GOOGL · Dec 1–5 OutlookStretched Rally Meets Heavy Supply — Time for a Pause?
Weekly timeframe (bigger picture mood)
The weekly chart shows a monster trend. GOOGL has been riding this rising channel almost perfectly, and now price is pushing into the upper half of the channel where historically the momentum starts slowing. Candles are still green, but the bodies are getting smaller — that’s usually the market showing fatigue, not reversal.
Uptrend still intact, but the push is getting harder.
Daily timeframe (where the slowdown becomes real)
The daily chart lands right inside a clean supply zone around 323–332. Every attempt to break above that zone leaves long wicks. That’s not bearish yet — it just means sellers are active.
Volume dips here confirm one thing:
Buyers are getting tired exactly where sellers finally have the upper hand.
Whenever a strong weekly trend pushes into daily supply and stalls, that’s usually the stage before:
* a pause
* a pullback
* or a sloppy sideways grind
Not reversal… just cooling pressure.
1H timeframe (early crack in momentum)
This is where the weakness shows clearly.
Price tried to break supply, failed, and started forming lower highs directly underneath the ceiling.
That’s how uptrends slow: first the momentum dies, then structure breaks later.
There’s a small CHoCH on the 1H, meaning the market tested the bullish side and then flipped short-term control back to sellers. Trendline is still holding — but barely.
Whenever the 1H starts doing this under daily supply, the bulls usually need a “rest day.”
15m timeframe (the truth surface)
The 15m chart shows the “real” story before everyone sees it:
* Repeated rejections at the same zone
* Break of structure downward
* Retests failing
* And smaller and smaller bounces
This is the type of compression pattern that usually breaks to the downside first before anything else.
The 15m broke early.
The 1H is bending.
The daily is in supply.
The weekly is stretched.
The pieces fit.
How GEX confirms all of this
The GEX chart adds the final piece of evidence.
No need to hype — just simple cause & effect:
Major call-wall cluster: 327–335
This is thick resistance from hedging flows. Market makers get forced to hedge against upside when price enters that region, which creates downward pressure.
And guess what?
That zone lines up EXACTLY with the daily supply and the rejection levels on 1H and 15m.
Major put-magnet cluster: 312–310
Below, the heaviest put-weight sits around 312–310, which acts like a magnet if price loses 315.
So the GEX map basically says:
* “Upside is heavy and expensive near 327–335.”
* “Downside is easier if 315 breaks.”
Perfect confirmation to the TA.
Trade ideas (based on structure + GEX)
These are not signals — just how a trader would think based on the levels.
BULLISH SCENARIO (only if strength proves itself)
Trigger: Must reclaim 326 with a clean push + retest.
If that happens:
Targets:
* 330
* 332 (end of the supply zone)
* 335 (GEX wall — tough to break)
Safer call-side idea (for Dec 6 expiration):
* 325c / 330c spread
Tight risk, matches GEX resistance.
Aggressive idea:
* 330c, but only if 326 breaks with volume.
BEARISH SCENARIO (more likely unless buyers show strength)
Trigger: Break below 315
This opens the easier path where both TA and GEX want price to go.
Targets:
* 312
* 310
* 305 (if panic selling kicks in)
Put-side idea (Dec 6 expiration):
* 315p / 310p spread
Cheap, logical, and matches the GEX magnet.
Aggressive:
* 310p, aiming for the magnet flush.
NEUTRAL / SCALP IDEA (for those who don’t want directional risk)
Inside the 323–332 supply zone:
* Short calls above 332
* Short puts above 315
…because price is likely to chop until one side breaks.
This reflects the actual structure: compression between supply and short-term support.
My overall view for the week (Dec 1–5)
Everything points to a cooling week, not a runaway rally. Buyers have pushed hard for weeks, and GOOGL is finally running into an area where sellers care again.
Unless 326 breaks clean, this week favors:
* A pause
* A pullback
* Or a choppy range with bearish lean
Break of 315 = quick drop.
Break of 326 = one more push.
Disclaimer
This is not financial advice.
Educational analysis only — always manage risk according to personal trading rules.
Google still going up in wave but hit 1.618 extensionNASDAQ:GOOGL Wave III continues, price looks exhausted but just won’t stop rewarding investors. It may trap late trend-chasing investors, causing them to capitulate lower.
Wave (5) of III is likely to complete with a throw-over of the upper channel boundary. Wave IV now has an expected retracement target of the 0.236 and daily pivot, $269. The gap remains unfilled.
📈 Daily RSI has printed a bearish divergence from overbought for weeks.
👉 Continued upside has a target of the R3 pivot
Safe trading
GOOGL Stock Forming a BIG Pattern — Key Levels You MUST Watch!In this video, I break down a clear chart pattern forming on GOOGL (Alphabet) stock, using detailed technical analysis.
You’ll see exactly how the pattern developed, what levels matter right now, and where the stock could move next.
🔍 What’s Covered in This Analysis:
GOOGL’s current chart structure
Clear pattern formation (triangle / channel / flag / wedge — based on your chart)
Key support & resistance zones
Breakout / breakdown levels
Trend strength and momentum
Short-term price targets
Medium-term technical outlook
Risk levels & invalidation points
📈 Why This Matters
Alphabet (GOOGL) is showing a highly tradable technical setup, and understanding this chart pattern can help you spot the next big move before it happens.
Perfect for:
Day traders
Swing traders
Long-term technical investors
Anyone following large-cap tech stocks

Alphabet (NASDAQ: $GOOGL) Stock: 2025 Continues BullishAlphabet’s stock continues its remarkable performance in 2025, surging nearly 70% year-to-date as strong fundamentals and aggressive AI expansion fuel investor confidence. Much of the momentum comes from Alphabet’s rapidly growing cloud division and the continued rollout of Gemini, its advanced AI model powering enterprise workloads, search upgrades, and next-generation productivity tools. This expansion has pushed Alphabet’s market valuation close to $4 trillion, establishing it as one of the fastest-growing mega-caps this year.
Another major catalyst is Google’s deepening presence in India’s digital infrastructure. The Adani Group recently announced a $5 billion co-investment with Google to build a large-scale data center aimed at supporting India’s rising cloud, AI, and storage needs. This move comes shortly after Google committed $15 billion to an AI-focused data center cluster in Andhra Pradesh. Together, these investments reinforce Alphabet’s expanding footprint across one of the world’s fastest-growing markets and strengthen long-term revenue prospects.
From a technical standpoint, GOOGL remains strongly bullish after breaking above a long-held ascending trendline that acted as multi-year resistance. The breakout triggered a sharp rally, pushing the stock to the current price around $320. Momentum indicators show extreme strength, with the MACD at record highs and RSI firmly overbought—signals that suggest the uptrend remains intact but may face volatility.
The next psychological resistance sits at $350, a level traders will watch closely. On the downside, immediate support lies at $291, followed by a stronger structural zone at $255. As long as price stays above the former trendline and these supports, the broader bullish structure remains dominant.

GOOG Weekly CALL Alert — Early-Week Momentum Play ActivatedGOOG QuantSignals V3 — Weekly Signal (2025-11-28)
Expiry: 2025-12-05 (7 Days)
Instrument: GOOG
Current Price: $319.97
Direction: CALL (LONG)
Confidence: 60% (Medium)
Risk Level: ⚠️ MODERATE
📈 Signal Details
Strike Focus: $320.00 (ATM, 0.513 Delta)
Entry Range: $5.60 – $5.70 (mid $5.65)
Target 1: $9.04 (+60%)
Target 2: $12.43 (+120%)
Stop Loss: $2.83 (-50%)
Position Size: 2% of portfolio
🧠 Katy AI Analysis
Predicted Move: $319.97 → $333.48 (+4.22%) by Dec 1 afternoon
Trend: Bullish momentum building despite initial NEUTRAL label
Sustained Levels: Above $325 through Dec 2
Time Series: Clear gradual upward trajectory
AI Confidence: 60%
📊 Technical & Market Context
Weekly Momentum: +0.33% (Neutral)
Weekly Range Position: 90.2% high
VWAP: $321.97 (resistance)
Support: $315.17 (stop loss)
Resistance: $325 – $330 zone
MACD: Bullish confirmation
News Sentiment: Mixed tech headlines, AI bubble concerns, potential oversold bounce
Options Flow: Neutral PCR 1.00; unusual activity at $175 put is protective hedging
Gamma Risk: Low
⚡ Trade Setup & Strategy
Why This Trade: Katy AI reveals bullish momentum not captured in NEUTRAL summary
Timing Advantage: Entry near weekly high → early-week upside capture
Risk Mitigation: Tight 50% stop, balanced delta selection reduces gamma risk
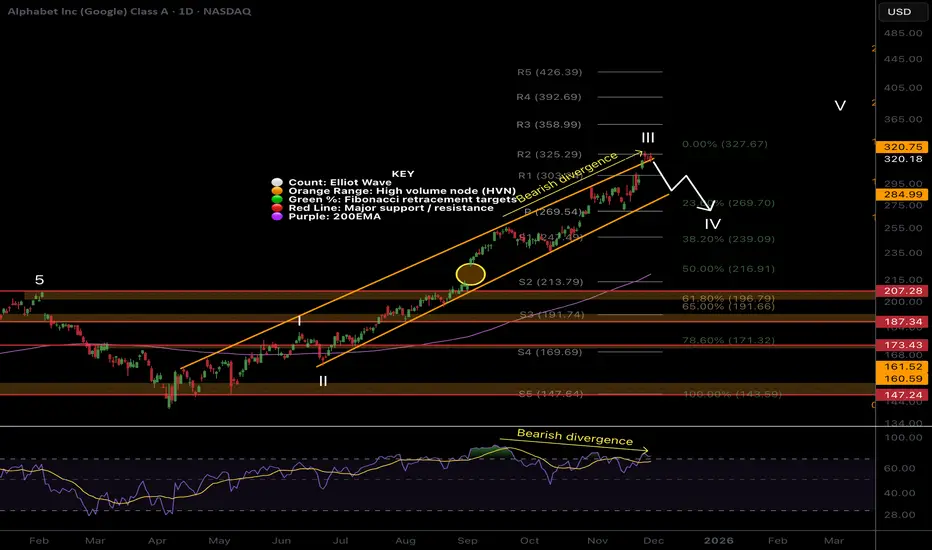
Google at record highs but Wave 3 cluster/RSI screams pullback!Alphabet is leading the Magnificent Seven, hitting record highs near $330, while most AI and growth stocks, including Nvidia, have stalled. Since launching Gemini 3 in mid-November and with news of a $4.9 billion Berkshire stake, Alphabet has rallied more than 135% off its April low, outperforming all Big Tech peers in 2025.
But Alphabet is at the 161.8% Fibonacci extension of its long-term move and long-to-medium-term move, which matches a textbook Elliott Wave 3 cluster completion. RSI is at an extreme 83 on the weekly, hinting a Wave 4 pullback to $288 could be next, even as the macro backdrop (Gemini 3 AI buzz, Fed rate cut hopes, and demand for Google’s AI chips from Meta) stays strong. Ultimately, a final Wave 5 could extend up to $380-$400.
Key drivers:
Gemini 3 launch positions Alphabet as an AI leader, topping major multimodal benchmarks.
$4.9B Berkshire stake signals major institutional confidence.
Meta seeks Google’s TPU chips, boosting Alphabet’s AI hardware story while pressuring Nvidia.
Fed rate cut odds above 80% further support growth stocks.
Elliott Wave/technical structure aligns with a potential $288 pullback before any push to $380.
Will Alphabet finally pause after eight explosive months, or does the rally have further to run?
Let us know your view and Elliott Wave count in the comments, and follow for more big-picture, technical-plus-macro trade ideas!
This content is not directed to residents of the EU or UK. Any opinions, news, research, analyses, prices or other information contained on this website is provided as general market commentary and does not constitute investment advice. ThinkMarkets will not accept liability for any loss or damage including, without limitation, to any loss of profit which may arise directly or indirectly from use of or reliance on such information.
