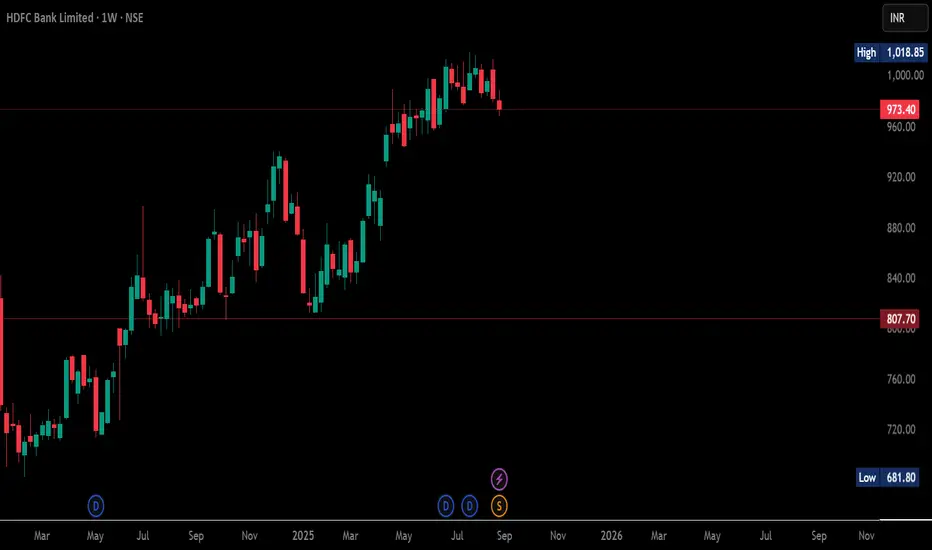
HDFC Bank: Key Upside Levels Achieved, Now Reacting at a Strong HDFC Bank has completed its major upside move and is now reacting sharply near the ₹1020 resistance zone, a level that has previously acted as a strong supply point.
Price action shows momentum fatigue at this zone, and the recent ₹91 lakh RBI penalty has added additional pressure on sentiment.
The penalty was issued for multiple compliance lapses — including inconsistent loan benchmarks, non-permitted subsidiary activities, and outsourcing KYC checks.
With the stock hitting a major barrier and news-driven sentiment turning cautious, the probability of a short-term correction or healthy pullback has increased.
The broader structure remains positive, but buyers will need fresh strength to clear the ₹1020 level convincingly.
I’ll be watching how price behaves around this zone for the next directional move.
Trade ideas

HDFC BANK LTD S/Rsanthosh
Support and Resistance Levels:
Support Levels: These are price points (green line/shade) where a downward trend may be halted due to a concentration of buying interest. Imagine them as a safety net where buyers step in, preventing further decline.
Resistance Levels: Conversely, resistance levels (red line/shade) are where upward trends might stall due to increased selling interest. They act like a ceiling where sellers come in to push prices down.
Breakouts:
Bullish Breakout: When the price moves above resistance, it often indicates strong buying interest and the potential for a continued uptrend. Traders may view this as a signal to buy or hold.
Bearish Breakout: When the price falls below support, it can signal strong selling interest and the potential for a continued downtrend. Traders might see this as a cue to sell or avoid buying.
MA Ribbon (EMA 20, EMA 50, EMA 100, EMA 200) :
Above EMA: If the stock price is above the EMA, it suggests a potential uptrend or bullish momentum.
Below EMA: If the stock price is below the EMA, it indicates a potential downtrend or bearish momentum.
Trendline: A trendline is a straight line drawn on a chart to represent the general direction of a data point set.
Uptrend Line: Drawn by connecting the lows in an upward trend. Indicates that the price is moving higher over time. Acts as a support level, where prices tend to bounce upward.
Downtrend Line: Drawn by connecting the highs in a downward trend. Indicates that the price is moving lower over time. It acts as a resistance level, where prices tend to drop.
Disclaimer:
I am not SEBI registered. The information provided here is for learning purposes only and should not be interpreted as financial advice. Consider the broader market context and consult with a qualified financial advisor before making investment decisions.

HDFC BANKHDFC Bank Ltd., incorporated in the year 1994, is a banking company (having a market cap of Rs 15,41,439.88 Crore).
HDFC Bank Ltd. key Products/Revenue Segments include Interest & Discount on Advances & Bills, Income From Investment, Interest and Interest On Balances with RBI and Other Inter-Bank Funds for the year ending 31-Mar-2025.
The Bank has reported Standalone Non Performing Assets (Gross NPAs) at .00 % of total assets and Standalone Net Non Performing Assets (Net NPAs) at .00% of total assets for the quarter ending 30-09-2025.
For the quarter ended 30-09-2025, the company has reported a Consolidated Total Income of Rs 118,560.63 Crore, down 10.89 % from last quarter Total Income of Rs 133,054.97 Crore and down 2.38 % from last year same quarter Total Income of Rs 121,456.74 Crore. The bank has reported net profit after tax of Rs 19,610.67 Crore in latest quarter.
The bank’s top management includes Mr.Atanu Chakraborty, Mr.Sashidhar Jagdishan, Mr.Kaizad Bharucha, Mr.Bhavesh Zaveri, Mr.V Srinivasa Rangan, Mr.Keki Mistry, Mrs.Renu Karnad, Dr.Harsh Kumar Bhanwala, Mrs.Lily Vadera, Mr.M D Ranganath, Mr.Sandeep Parekh, Mr.Santhosh Keshavan, Dr.(Mrs.)Sunita Maheshwari, Mr.Srinivasan Vaidyanathan, Mr.Ajay Giridharilal Agarwal, Mr.Rakesh Rajput, Mr.Sanmoy Chakrabarti. It has M M Nissim & Co. LLP as its auditoRs As on 30-09-2025, the company has a total of 1,536.37 Crore shares outstanding.

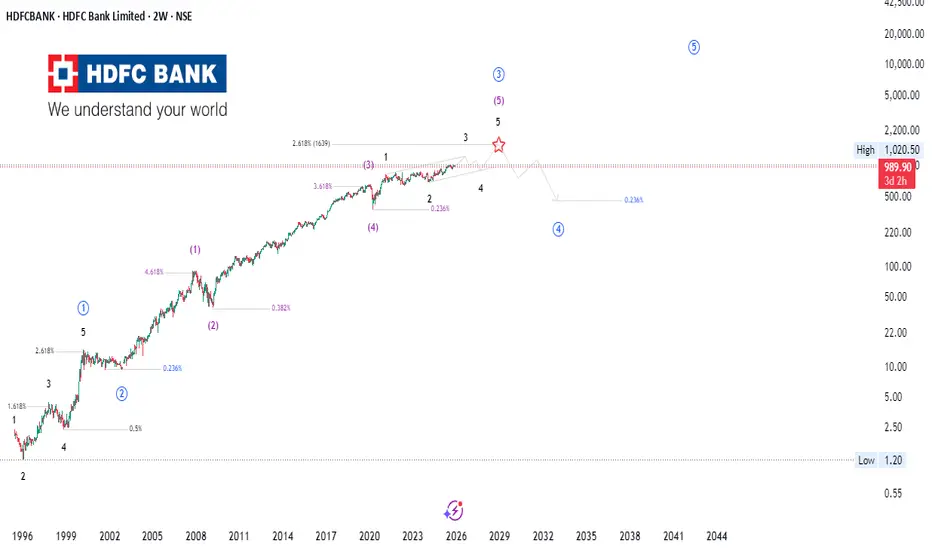
HDFC Bank | Wave-5 Exhaustion or Structural Re-Accumulation?This multi-decade chart of HDFC Bank reflects a compelling confluence of Elliott Wave Theory, Smart Money Concepts (SMC), Price Action, and Fibonacci symmetry —all signaling a maturing macro structure as the market approaches a probable Wave-5 terminal zone.
📈 Institutional Market Structure Outlook
The long-term advance appears to be unfolding within a clean 5-wave impulsive cycle , with the current structure showing:
Wave 3 projecting into the 2.618 extension zone—typical of strong institutional momentum.
A developing Wave-5 that aligns closely with prior impulse proportions, indicating possible trend exhaustion .
Clear structural higher highs and higher lows , yet momentum divergence around the projected terminal region (marked with ⭐), hinting at distribution.
🧠 Smart Money & Price Action Confluence
Price is entering a region historically associated with premium pricing —an area where Smart Money prefers to offload positions.
Multiple internal liquidity grabs near the highs suggest engineered wicks before a potential macro correction.
Market behavior resembles a buy-side liquidity sweep , followed by early signs of distribution on lower-timeframe structures.
🔢 Fibonacci Confluence & Market Cycle Alignment
Long-term impulses consistently respect 1.618 / 2.618 extension geometry.
The projected corrective leg ( Wave 4 ) aligns with the 0.236–0.382 retracement cluster, forming a probable demand re-accumulation zone.
Broader cycle rhythm hints at a transition from growth > distribution > mean reversion before Wave-5 completion.
🔮 What to Monitor Next
Reaction at the terminal Wave-5 zone
Breakdown of internal structure (SMC CHoCH/ BOS)
Volume profile shifts indicating institutional distribution
Retracement into the 0.236–0.382 macro demand zone for long-term opportunities
🚀 Stay Ahead of the Curve
For more institutional-grade analysis, follow our TradingView profile and turn on alerts 🔔 to never miss actionable insights on market structure, macro waves, and smart-money footprints.
⚠️ Disclaimer
This is not financial advice . The analysis is for educational purposes only. Markets are unpredictable—always conduct your own research before taking positions.
HDFC Bank Approaching a Major Monthly BreakoutHDFC Bank is testing a long-term resistance zone on the monthly chart, around 1000–1030. This level has rejected the price multiple times in the past, so a clean breakout on the monthly candle carries weight.
The chart shows a rising trendline from 2020 acting as support, and price is currently squeezing between the trendline and the horizontal resistance. This type of compression usually leads to a decisive move.
A monthly close above 1070 will confirm the breakout and open space for higher levels. If the candle rejects again, it can slip back into the range.
Breakout Confirmation: Above 1070 monthly close
Upside Zones: 1200, then 1350
Invalidation / Stop Zone: Below the rising trendline (approx 920–940 zone)
Why It Matters: Breakouts on higher timeframes (like 1M) tend to lead to multi-month trends.
This is not a buy/sell call — simply highlighting a major structure shift developing on the long-term chart.

HDFCHdfc chart analysis as it has major suport and the Value of stock is it a good price and in the long-term version it is a brilliant stock to keep in mind

HDFC Bank – Inverse Head & Shoulder (Preemptive Setup)🏦 HDFC Bank – Inverse Head & Shoulder (Preemptive Setup)
HDFC Bank has been extremely low on momentum and stuck in a sideways zone for many weeks.
While Bank Nifty continues to hit new highs, HDFC Bank hasn’t participated — but the structure is now hinting at a potential inverse head & shoulder breakout.
📌 Why This Setup Looks Interesting:
• Clear Inverse H&S pattern forming on Weekly
• Stock severely underperformed — mean reversion possibility
• Breakout can bring slow but steady upside
• Momentum still weak → requires patience
📈 Trade Plan (Preemptive):
• CMP: ₹997
• Stop Loss: ₹965
• Target: ₹1100
• Low pace expected — positional patience needed
⚠️ Clarification:
This is an independent analysis based purely on technical & market study.
Religare Broking Limited is not involved in this view or recommendation.
📝 Important:
I am not responsible for any profit or loss. No fees are charged — purely educational.
📉 Disclaimer:
Not SEBI-registered. Please do your own research.

HDFC BANK ( MEDIUM-LONG TERM ANALYSIS )After long consolidation, HDFC Bank is looking steady on charts, and we can expect it to cross the long-term trendline. And in the upcoming year ,we can expect levels up to 1150-1175 . As of now, downside risk is limited to the 900 range.
ALL LEVELS ARE MARKED IN THE CHART POSTED.
NOT A BUY/SELL RECOMMENDATION.
DISC- I'M INVESTED IN THIS STOCK.
#stockmarketsindia #Nifty #Banknifty #Stock #HDFCBANK

HDFCBANK - RISING WEDGE PATTERN BREAKOUT [ SELL SIDE ]I am not a SEBI-registered investment advisor. The information provided here is for educational and informational purposes only and should not be construed as financial or investment advice. Please do your own research or consult with a SEBI-registered financial advisor before making any investment decisions. Investments in the securities market are subject to market risks. Read all the related documents carefully before investing.

NIFTY WEIGHTAGE STOCKS INDEX..Support and Resistance Levels: In technical analysis, support and resistance levels are significant price levels where buying or selling interest tends to be strong. They are identified based on previous price levels where the price has shown a tendency to reverse or find support.

BANKNIFTY WEIGHTAGE STOCKS INDEX..Support and Resistance Levels: In technical analysis, support and resistance levels are significant price levels where buying or selling interest tends to be strong. They are identified based on previous price levels where the price has shown a tendency to reverse or find support.

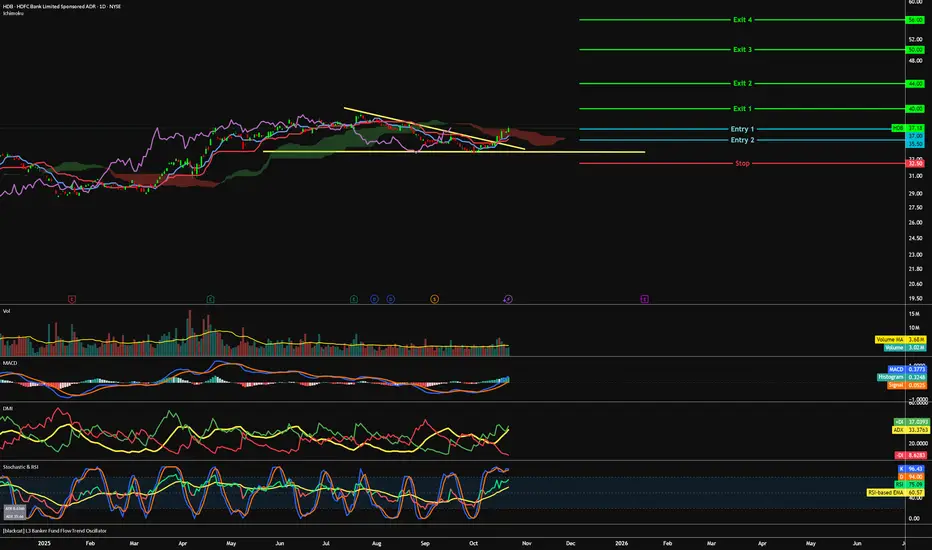
HDB - Banking on uptrend continuation=======
Volume
=======
- slight increase
==========
Price Action
==========
- Broken out of latest downtrend
- Supported at $34
=================
Technical Indicators
=================
- Ichimoku
>>> price above cloud
>>> Green Kumo Budding
>>> Tenken - Within clouds & piercing up
>>> Kijun - Below clouds & piercing up
>>> Chiku - Below clouds & piercing up
=========
Oscillators
=========
- MACD bullish
- DMI bullish
- StochRSI, bullish, crossed and near overbought region
=========
Conclusion
=========
- short to long term breakout swing
- price may reverse at current level, to enter spot or wait for pullback at entry 2.
- Entry and exits depends on your time horizon and risk management.
=========
Positions
=========
Entry 1 - $37
Entry 2 - $35.50
Stop - $32.50
Exit 1 - $40
Exit 2 - $44
Exit 3 - $50
Exit 4 - $56
Exit 5 - $66
HDFC Bank: Major Red Band Resistance LevelHDFC Bank: Major Red Band Resistance Level.
( Not a Buy / Sell Recommendation
Do your own due diligence ,Market is subject to risks, This is my own view and for learning only .)

HDFC Bank Ltd for 6th Oct #HDFCBANK HDFC Bank Ltd for 6th Oct #HDFCBANK
Resistance 970 Watching above 971 for upside momentum.
Support area 960 Below 960 gnoring upside momentum for intraday
Watching below 957 for downside movement...
Above 970 ignoring downside move for intraday
Charts for Educational purposes only.
Please follow strict stop loss and risk reward if you follow the level.
Thanks,
V Trade Point

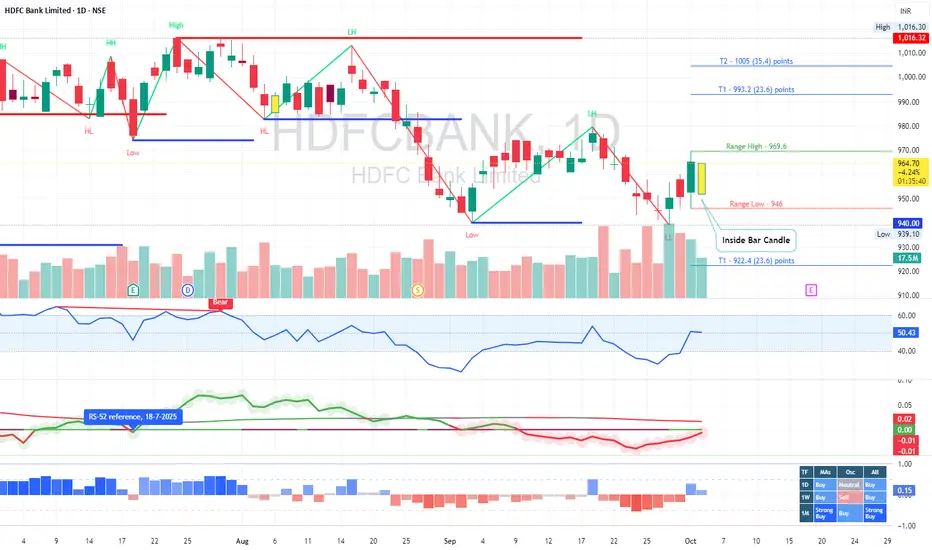
HDFC BankHDFC Bank forming Inside Bar Candle
Means BNF will bullish if Resistance has been crossed
this is before closed market level after we need to check level
Resistance 965
support 952
Expected level 979 / 983 / 993 / 1005

HDFCBANK, 1D, Support, LongHDFCBANK has taken a good support at this level. If it closes above 360 then it may go upto 370 and 390.
Entry : 960
Target1: 970
Target2: 990

New High is Coming In HDFCbank ??Hdfcbank taken support and pushing upside. Seem like new high is coming in few days

HDFC Bank BuyHDFC Bank bounced back from its trend line. also break above a consolidating range. Buy @CMP (2015) with SL of 1960 and a target of 2500.

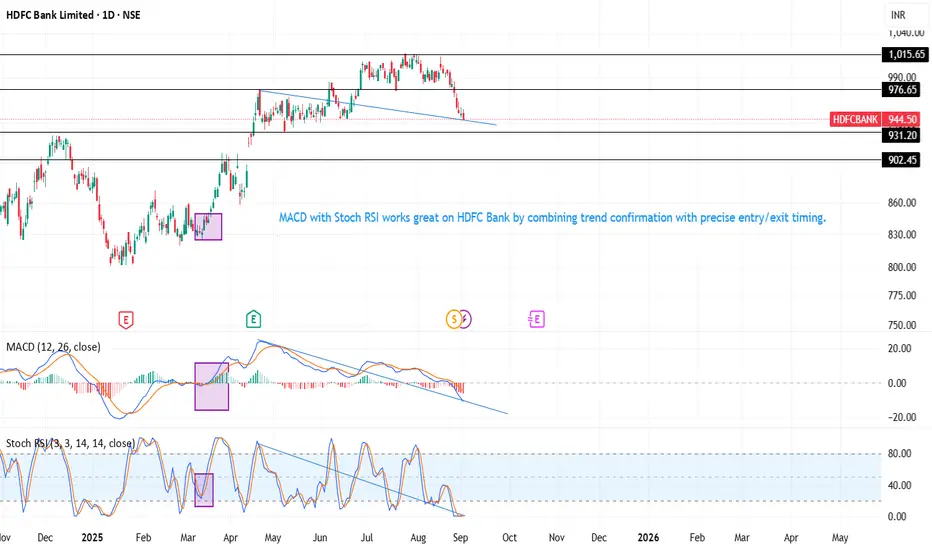
HDFC Bank Looks Interesting Here: Oversold with Signs of DivergeHDFC Bank: Watching for a Bounce
The stock has been sliding for a while but it’s now sitting right on a key support zone around ₹902–931.
MACD is hinting at a possible bullish divergence.
Stoch RSI is in oversold territory and trying to turn up.
Price action shows repeated support tests, which could turn into a base.
If this level holds, a bounce toward ₹976–1015 looks likely. I’ll be keeping a close eye on how it reacts here.
(Just sharing my view, not financial advice)

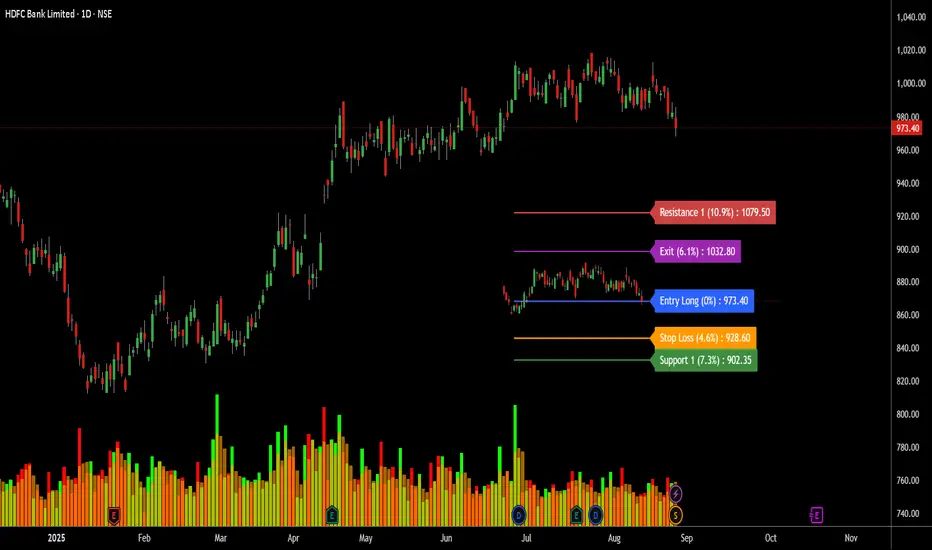
HDFC – Trade Setup & Key Levels🏦 HDFC – Trade Setup & Key Levels 📊
Analyzing HDFC on current chart structure with clear entry, exit, stop loss, support, and resistance zones.
📌 **Entry Price (Long):** 973.40
🔑 Key Levels to Watch:
🔹 **Exit Target:** +6.1% → 1032.80
🔹 **Stop Loss:** -4.6% → 928.60
🔹 **Support Zone:** -7.3% → 902.35
🔹 **Resistance Zone:** +10.9% → 1079.50
HDFC is trading close to its support area. Entry is positioned at 973.40, with a favorable risk-to-reward ratio targeting 1032.80 first. Resistance remains higher at 1079.50, while downside risk is capped by the stop loss at 928.60.
**Bullish View:** If momentum sustains above 973.40, price can aim for 1032.80 and later 1079.50.
**Bearish View:** Breakdown below 928.60 may drag price lower toward 902.35 support.
⚠️ **Note:** If 928.60 breaks, expect further downside risk. ⚠️
🔔 **Be sure to follow updated ideas for HDFC!** 🔔
⏰ **Timeframe:** Daily & 4H chart-based analysis.
⚖️ **Always apply a Stop Loss** to protect capital.
💡 **This is just my trading idea — follow your own strategy.**
✅ Don’t forget to hit the 'Like' ✅ 🙏😊 & Share with fellow traders if this setup helps!
Mostly on HDFC vs SBI..So, just to be sure, HDFC bank trading at p/e multiples of 22, at a market cap of 15 lakh cr valuation is somehow a larger company than SBI trading at multiples around 9, with a market cap of 7.6 lakh crore. Actually, not only large, Mr. Market is of the strong opinion, that HDFC with its 2.2 lakh employees working in 9500 of is branches operating a customer base of 12 crore is TWICE-IN-SIZE than SBI's 2.5 lakh employees working (beyond lunch breaks..😅) in 23,000 branches operating a customer base of 50 cr. Now my finance & banking bros might chip in that number of branches and employees, or customer bases have little to do with a bank's core fundamentals, numbers or its growth trajectory.
Well let's crunch some numbers too then.
So as of last year, HDFC brought home a net profit of 60k Cr on a revenue of 3 lakh Cr in FY24, growing at a solid 26% YoY. Meanwhile, a relatively smaller SBI (half to be precise..), posted 61k Cr in net profit on 4.5 lakh Cr revenue, with a 20% profit growth. HDFC's 9,500 branches and 12 crore customers somehow make it worth 15 lakh Cr, while SBI's 23,000 branches, 50 crore customers, and larger deposit base of 49.2 lakh Cr (vs. HDFC's 27.7 lakh Cr) can bite dust at 7.6 lakh Cr. HDFC's return on equity at ~17% shines brighter than SBI's ~14%, and its post-merger efficiency and digital push does justify a premium valuation in it's own might. And also in matters of operational efficiency, HDFC's a clear winner as reflected in margins and other ratios, but does that really justify the current market cap and multiple? More of a narrative luxury if you ask me, rather than a value play.. But 'valuable price' and 'pricey value' are often separated only by a faint line, and sometimes it gets really difficult to contemplate which is which. Is HDFC overhyped bordering on "irrational exuberance" or is SBI just another cheap "Sarkari Bank" and hence ignored? But with SBI's 22.5% deposit share vs. HDFC's 10.5%, and advances of 37.7 lakh Cr vs. HDFC's 25.6 lakh Cr, I can't help but form a bias with SBI. Not investment advice but just me preferring scale & absolute profit at a sensible multiple over efficiency & low credit risk at 2× earnings premium, I relate and resonate better with the position on that perspective..no, I won't tattoo the blue logo on my arm anytime soon, but fresh longs will be initiated on dear Sarkari Bank with fair valuation. Maybe glam doesn't suit me..