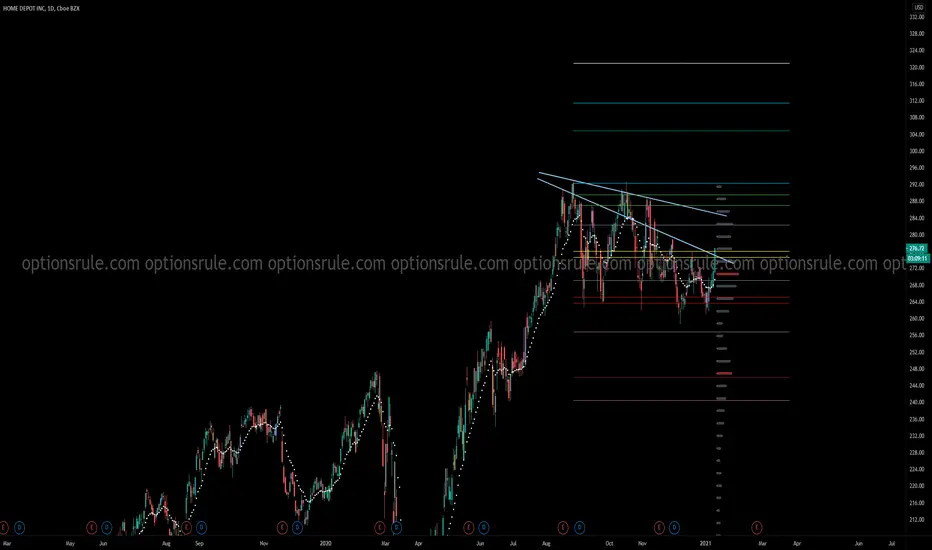
HDHD 2-4+ Week horizon
I see 2 channels on this chart. A main downward trend channel (blue) and the past month or two price action bounced from the 200ema and seems to have created a new upward channel (purple).
For the 2nd time now, price action seems to be respecting the purple uptrend channel and hopefully it will remain this way for the next couple of weeks. Additionally price seems to be moving at the EMAs.
Key area is 282-285 area. Around this area is where I see a resistance from 61.8% fib and the upper boundary for the downward channel (blue). If Price action breaks this area, there is a good chance of a target 2 hit and possibly reaching target 3.
MACD histogram on the daily and weekly seems to be losing downward momentum for a possible bullish move. Stochastics on the daily time frame is at oversold level for a possible bullish move while around the 40 level on the weekly time frame.
Also, summer is around the corner and with interest rates at at its lowest, I anticipate a lot of home buying, renovations, and new home constructions.
Disclaimer
I am not a registered investment advisor and do not offer investment advice and recommendation. All my post is not a recommendation, advise nor a suggestion and should not be used as a replacement for investment advice from a qualified licensed professional. All my post is for, information and entrainment purposes only. You, the reader, bear full responsibility for your own investment and trade decisions and should seek the advice of a qualified securities professional before making any investment or trade.
Trade ideas


Short Home Depot - CLASSIC Wyckoff DistributionThis chart is displaying a classic wyckoff distribution pattern. Keep a tight stop at $284. Targets 1-3 are on the .618, .5, and .382 retracement levels. Keep a cool head, this one will play out over the next couple months.
Entry - $269
SL - $284
Target 1 - $235
Target 2 - $216
Target 3 - $198
R/R - 2 (T1)

the b[AI]te's weekly insights -- HD 2021-02-01center stage image
stock
our system found that HD received the best image over the course of last week.
comment image
we see a week positive correlation with our image indicator. We therefore assume that prices are driven by facts rather than emotions and reflect an accurate picture of the companies current state of affairs.
new free tool
we launched our new free analysis tool. Check our website and test it out!
new free and powerful data API
you can now access our data via our free API. Check our website and test it out!
FAQ
ATTENTION
our algorithms define ATTENTION as the overall number of stories and opinions that appear for a given security each day.
IMAGE
our algorithms define IMAGE as the averaged sentiment value extracted from all opinions received for a given security per day.


HD golden zone opportunity?Recently broke out of daily downtrend line. Might be retracing into golden zone.


Home Depot catching the trend short HD has been a short idea due to macro situation and continues to trend short. Having the right Reward to Risk ratio and Money management remains paramount. Since we are not extremely late to the trend but still are late, one would be advised to take a smaller position size of maybe 1% - 2% of your trading portfolio.
It also isn't the highest score trade as it lacks MACD confluence but it has a decent chance of turning out well.


$HD - perky!Green zone might get activated in anticipation of scheduled protest this upcoming weekend!
Going Long HD for a 5 day swing tradeHD is looking very strong against the NAS100 and confirms with LOW. Looking to go long on the open in the am.

HD Starting the year strong with a bounce off support zoneHD lagged the last few months, just like AMZN and ITB, but the overall chart still sports a bullish configuration. Stock hit new highs in August and is above rising 200-day. Decline from high retraced 1/2 to 2/3 and formed a falling wedge, both of which are typical for corrections within a bigger uptrend. Stock is finding support from the lows extending back to late September. Expect a breakout and continuation of bigger uptrend. Re-evaluate on close below 260.


Home Depot Earnings Play Good support line. Consolidation almost complete and ready for earnings rally.

$HD looks great this week, targeting 278HD bouncing off that demand, tight, ihs, whatever confirms ur bias its bullish.


HD over 272.05Swing pick. Bullish falling wedge and consolidation ready for breakout. Basing above the VPOC dating back to the last impulse move in late June. Fib levels shown have good confluence with fib extensions. One target provided above ATH as well. S/L 268.53.

Traditional|HD|Long and shortLong and short HD
TA:
The idea is for both scenarios, the activation of one and the scenarios will serve as a pinning/breakdown of the blue zones (Screenshot attached).
I have identified two regression trends, the first trend is upward, the second trend can be either consolidation for further price rise, or unloading for further fall (Screenshot attached).
In the second regression trend, i highlighted a triangle consisting of the formed support and resistance lines, the result of working out this figure may also be an unobvious scenario, so both options are considered (Screenshot attached).
The entry zone to Long is determined by the breakdown of the triangle resistance level and fixing in this zone (or its breakdown).
The take zone in this case is the green zone formed by the fibo level to determine the price and the local fibonacci level.
The stop zone can be a return to the support level (the former resistance level of the triangle and consolidation in it).
The red arrow also indicates a possible alternative growth scenario with a retest of the support line (Screenshot attached).
The short entry zone is determined by the breakdown of the previous local minimum and fixing in this zone (or breaking it).
The take zone is 2 green zones at once, it may be better to use this to close the deal in parts. The first take zone is determined by the support level of the triangle and will be relevant both when working out the support level and when it breaks through. The second take level was selected using the fibonacci level to determine the price.
The stop zone can be in the first case a return to the blue zone where the trade was opened, in the second case a return to the triangle and fixing in it.
The red arrow also indicates a possible alternative growth scenario with a retest of the resistance line. (Screenshot attached).
There is also a discrepancy with the RSI indicator (Screenshot attached).
