$225 Short Target for Home DepotFirst off, please don't take anything I say seriously or as financial advice. As always, this is on opinion basis. That being said, let me get into a few of my insights. Home Depot has been recently bullish in terms of analyst calls, and obviously as a short pattern the next target for a quick turn over should be around the $225 mark. Yes, this may have long potential but there are much higher growth stocks and I am simply looking at this from a day trading perspective.
Trade ideas


HD Bounce off 200smaHD just ran into its 200 sma as resistance, i believe this will cause a bounce back to the 207 range within this week. 207 is where the rest of the moving averages are converging and where a potential pullback will go to.

HOME DEPOT - Possible 2nd day Opportunity! Quick recapTicker:
$HD
Notes:
HD has entered a zone which is above a nice price level. It also entered this zone with strength. Possible opportunity for continuation here!!!
xeenos trading - sending positive energy to all those watching

WHEN A PLAN COMES TOGETHER!! MUST WATCH $HD Home DepotFollow up to the watchlist chart I posted yesterday.
Absolutely beautiful intraday pattern around our key levels and BOOM - LOVELY TRADE!
Yesterdays Watchlist video also referenced below


HD - swing puts - watch price and RSI on dailyThe 20 SMA shows a downtrend on the weekly and 30min chart. Price has come up to 10 SMA on the weekly, and in a strong trend the price may not rally back up to the 20 SMA. I am looking for price to head lower, back to yellow support line, maybe lower.
Right now I am only taking a small position because on daily chart the 20 SMA is still upward, so I am watching for this to turn down and RSI will also head back below 50. Then I might add more puts. Otherwise price could head a higher (towards weekly 20 sma).
I bought 5/15 expiry 180 strike. Support (yellow line) is around 186. Remember that time matters. If stock takes too long to move lower, you can exit position and reenter later. Another strategy is to take profits if stock moves towards support, and then open a later expiry if it breaks lower.

home sweet home: Home DepotHello People,
the price movement of Home Depot shows a normal three waves correction. It ends at the 61% Fibonacci.
There is a chance to catch the next big downwards movement.
May the force be with you

$HD -- Possible bearish ascending wedge/bearflag$HD -- looks like a nice bearish ascending wedge/bearflag on the daily

May challenge historic lowsAlgorithms are soaring with new sales
Buying after a crash
no trade
wait long
historic lows and crash


HD puts, unless stock goes over 192.80On the weekly chart, you see a bullish engulfing candle, technically that signal triggers when the high is broken. This week the high is 192.80, same as last week. Stock has to trade at 192.81 or higher for candle pattern to trigger calls.
Based on daily chart, I am looking for stock to move lower since it has risen up to touch 20 SMA. You will see RSI go below 50 today or tomorrow on daily, and you can also look for signs on 30min chart.

Symmetrical TriangleThis can go either way, just follow it. 170c for breakout, 150p for breakdown, use triangle apex as SL. Will post PTs once it breaks


i think $HD is oversold. still open. people still going there.I think home depot is overdone here. home depot is still open and hopefully remains open. seeing people on twitter updating their houses


HDHD, spreads look weird on this one but im watching it below 212.5 with confirmation to 198 being 207.5


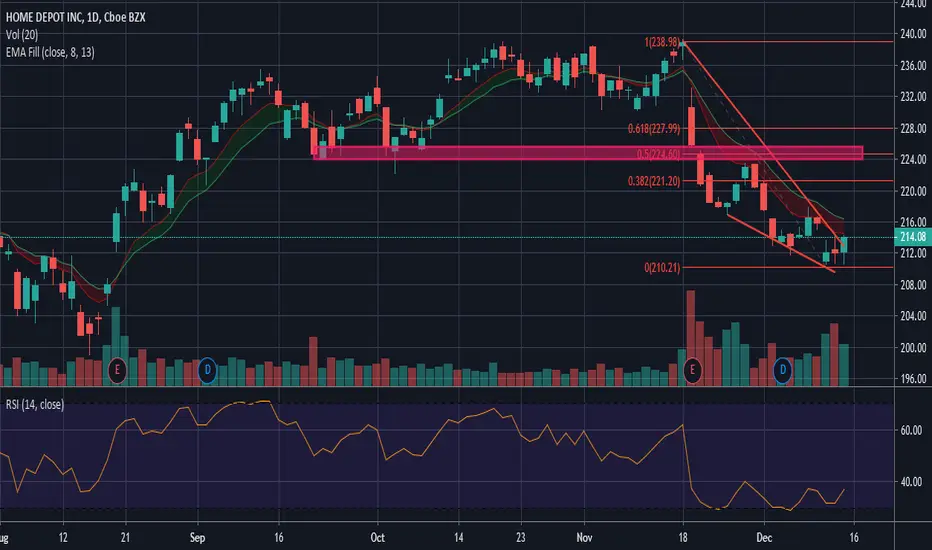
$HD reversalIf it can hold range looking for reversal after dump. Currently hanging on to 50MA and the .5 retracement - bottom of support range lines up with the 618 retracement level as well.

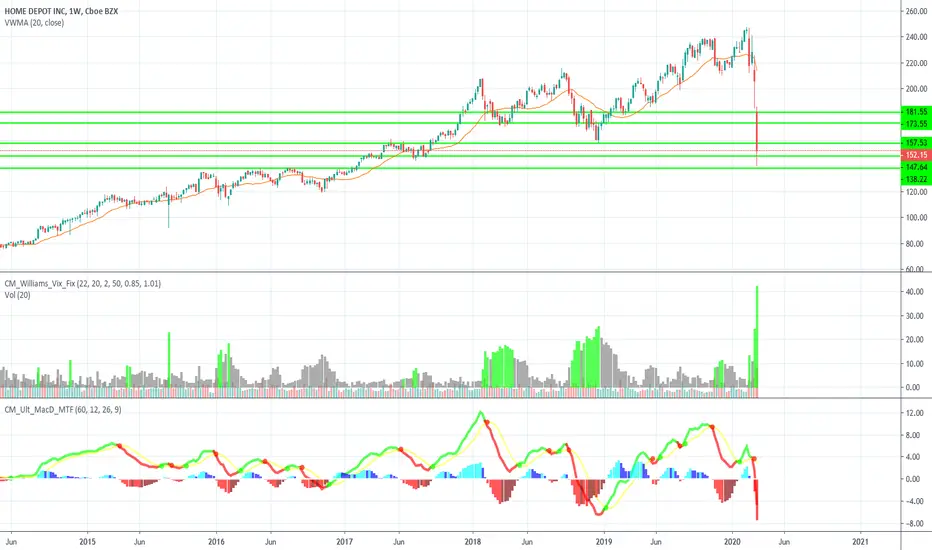
Home Depot (HD) LT Upside Targets Home depot long-term targets are the black rays. Red rays below the are old support levels that HD has either already tested or that will not be retested. There is no timing analysis here, so these are only upside targets with no regard to timing or additional downside pressure. Red lines are support lines, and the large red horizontal line at the bottom of the chart at $207 will not be broken.
NYSE:HD
