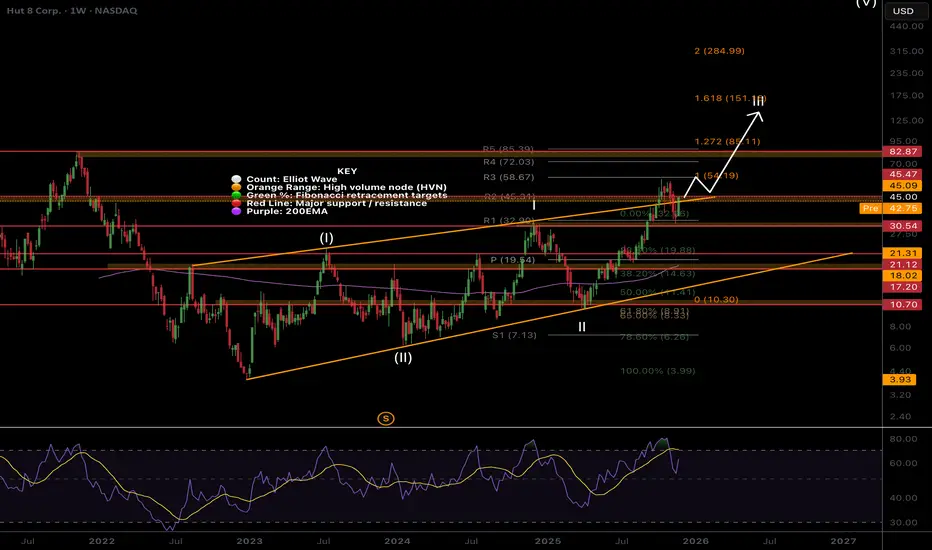
HUT Uptrend intactNASDAQ:HUT A large bearish engulfing candle at major resistance saw the price drop back into the range. It is now attempting break-out once more.
Price remains in a firm uptrend at major resistance with not much to add.
🎯 Terminal target for the business cycle could see prices as high as $135 based on Fibonacci extensions
📈 Weekly RSI hit overbought and reset back to the EQ.
👉 Analysis is invalidated if we close back below the weekly 200EMA
Safe trading
Hut 8 Corp. Shs Cert Deposito Arg Repr 5 Sh
No trades
Trade ideas
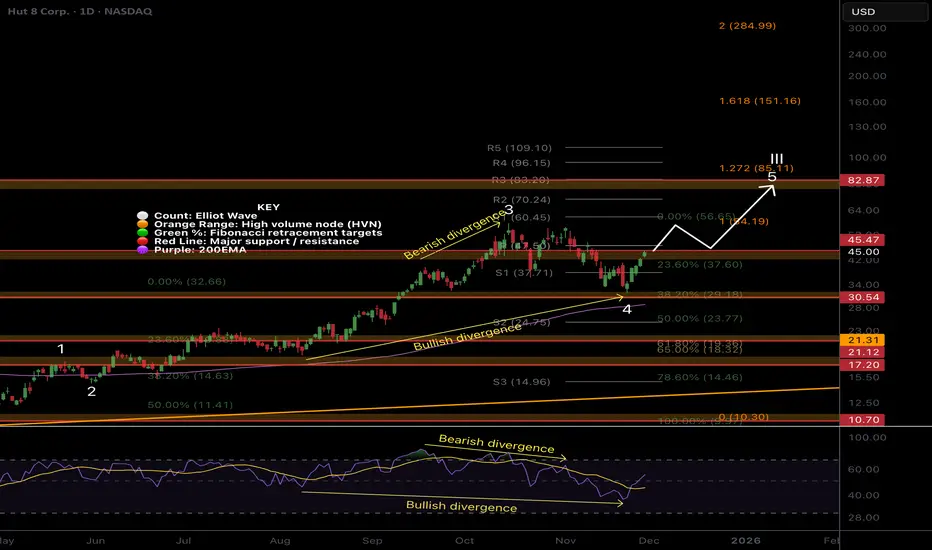
HUT ready for higher?NASDAQ:HUT Wave 4 appears complete at the 0.382 Fibonacci retracement and High Volume Node just above the daily 200EMA, proving its value by holding up better than the other assets.
Daily bearish divergence played out into bullish divergence as price caught a huge bid in the bullish, 3 white knights pattern. Resistance looms directly ahead, and a breakout above the daily pivot should see price head towards the $80 target High Volume Node.
📈 Daily RSI has printed a bullish divergence
👉 Continued downside has a target of the daily 200EMA, $28
Safe trading
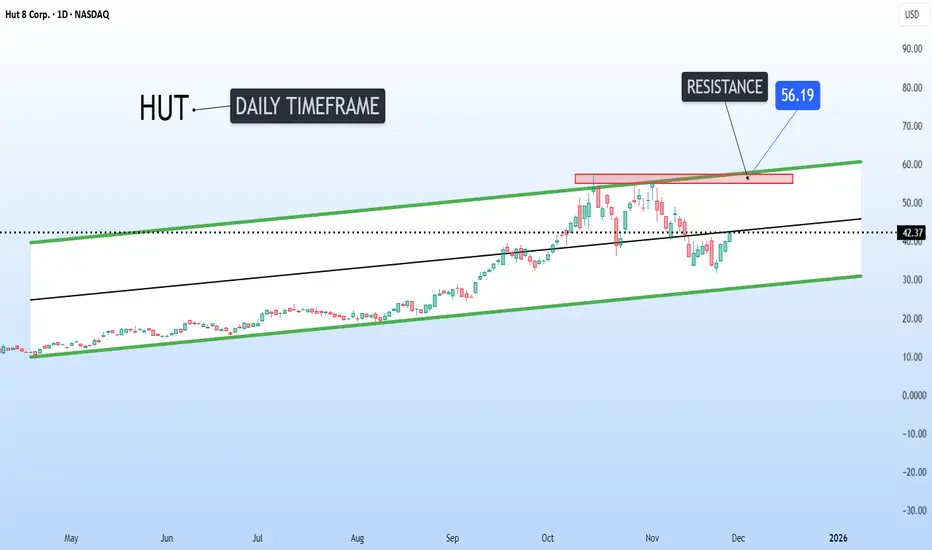
Strong upside potential for HUT 8 CorpIf the price breaks the ascending channel's mid-range, I see minimal resistance until the top of the channel around 56 for NASDAQ:HUT
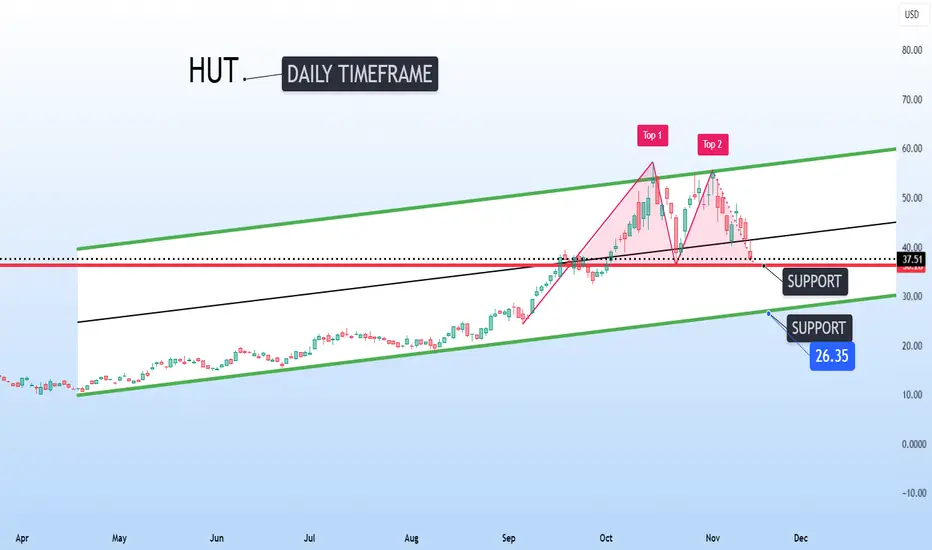
HUT is approaching a make-or-break zone on the chartHut 8 NASDAQ:HUT is approaching a make-or-break zone on the chart.
A clear double top has formed at the upper channel, and price has now fallen back to retest the neckline. This level needs to hold if the larger trend is going to stay intact.
A failure here could trigger a move toward the lower channel support near 26.35, where the broader structure would get its next real test.
If buyers step in and defend this neckline, momentum can shift back in their favor. If not, the chart may need a deeper reset before any real recovery begins.
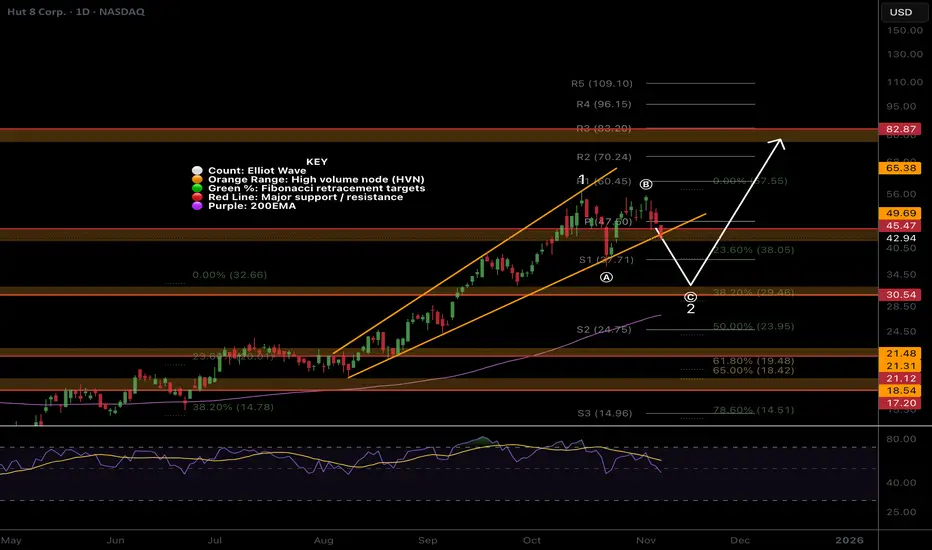
HUT Within channel boundary, all fine locallyNASDAQ:HUT Wave 1 appears complete at the channel upper boundary on bearish divergence.
For now the probability is to the upside and the trend is in tact. However, wave (B) of 2 looks complete. Wave C is expected to be strong and scary, capitulating many. Price is expected to terminate at the 0.382 Fibonacci retracement, High Volume Node support and rising daily 200EMA.
Daily RSI has printed bearish divergence from overbought but also bullish divergence at the EQ. This is ambigous.
Continued upside has a target os the $82 High Volume Node resistance.
HUT, ready for more upsideHuge daily candles are perfectly normal behaviour and nothing to be afraid of, we stay zoomed out to observe the larger trend to keep our emotions check.
Price has broken out of the channel upper boundary and a test of the boundary took place as expected, quickly catching a bid. We are now looking for continuation to trigger a long.
The next target is the High Volume Node resistance at $82 just under the R5 weekly pivot. Fibonacci extension 2 has a terminal target of $252, achieved with momentum and tailwinds only.
📈 Weekly RSI is oversold with no divergence and can remain here for months as price keeps increasing.
👉 Analysis is invalidated if we close back below the weekly 200EMA
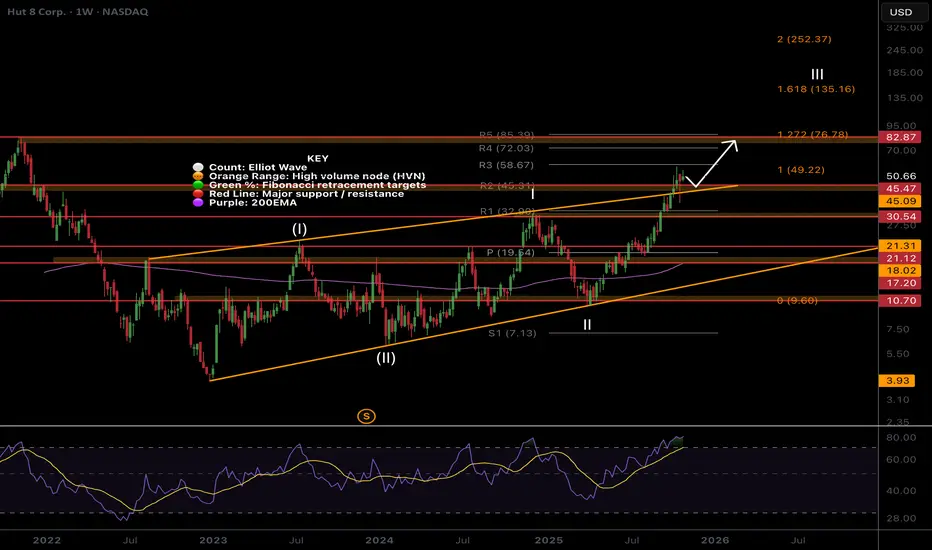
$HUT Breaking out, test of channel done and dusted!Hut has broken out of the channel upper boundary and a test of the boundary took place as expected, quickly catching a bid and recovering 17% Friday, producing a long signal for me.
The next target is the High Volume Node resistance at $82 just under the R5 weekly pivot. Fibonacci extension has a minimum target of the 1.618, $135.
The Elliot wave count suggests a very bullish move come in wave III of (III) which would overextend the 1.618 target above, $200+.
RSI is overbought but can remain here for months.
Safe trading
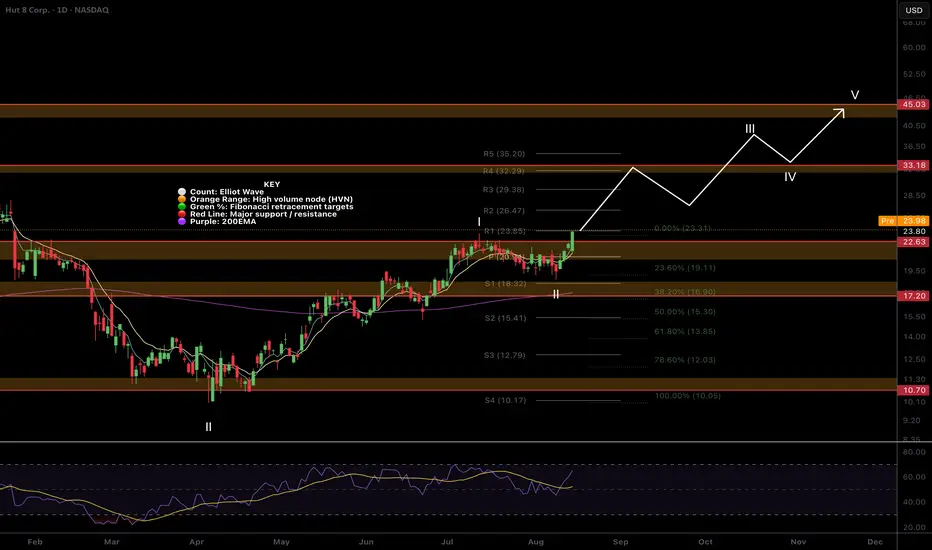
HUT downside still to come?NASDAQ:HUT has had a great rally finally being subdued by the macro channel upper boundary resistance sending price back to the High Volume Node support on overbought RSI.
RSI has reset to the EQ but has room to fall (or grow again). The next target is the High Volume Node resistance and R4 pivot at $44 with a terminal target of $65
If price loses the support node the next support target is the pivot and wave 1 high $24 and I would look out for a long here if we get it.
Safe trading

$HUT Clear for take off?NASDAQ:HUT bounced strongly off the weekly pivot retest above the major resistance High Volume Node flipped support.
Path is clear for the weekly R1 pivot target resistance at $33 and a poke above the previous swing high.
Long term cyclical targets remain at the R3 weekly pivot at $61. Weekly RSI is in an uptrend but not yet overbought while weekly RSI is pointing upwards.
Analysis is invalidated below $10.7
Safe trading
$HUT is Blasting Off Again!NASDAQ:HUT pull backs continue to be shallow making an accurate Elliot wave count difficult but this is a characteristic of a strong wave 3.
The next target is $33 major High Volume Node resistance at the R4 daily pivot.
RSI is printing daily bearish divergence but this will be offset soon if price continues upwards.
Safe trading
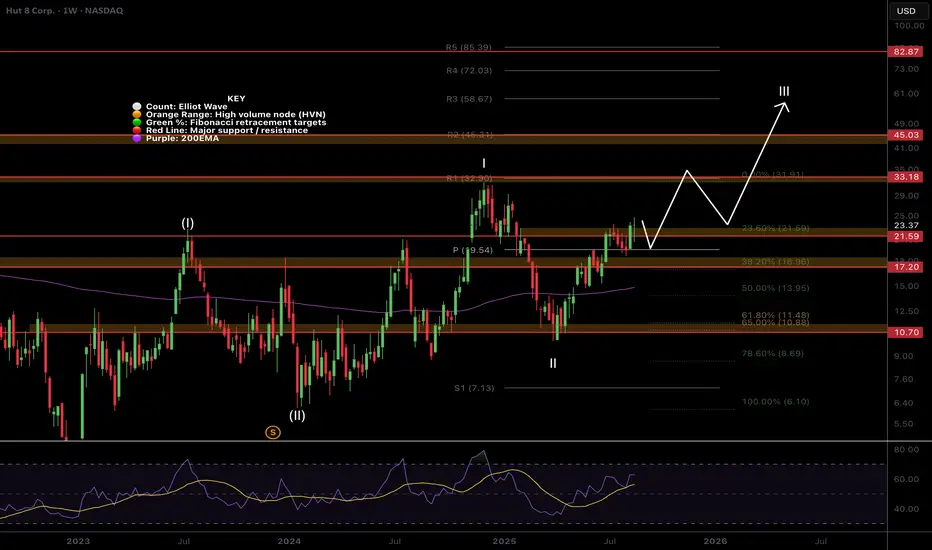
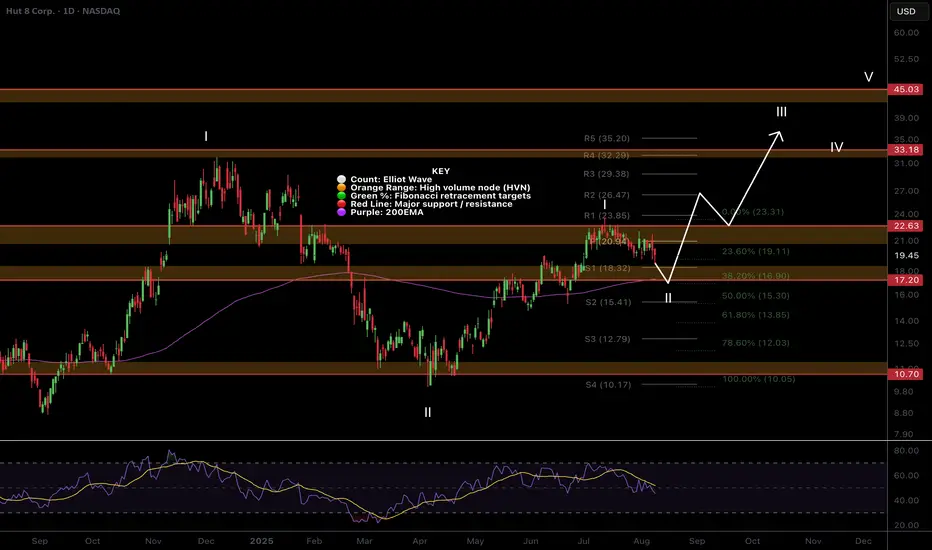
$HUT Pulling back to daily 200EMANASDAQ:HUT appears to have complete a larger degree wave 1 of 3 with wave 2 underway.
Looking at the support below we may have a shallow wave 2 targeting the daily 200EMA, major support High Volume Node at the .382 Fibonacci retracement, $17. A shallow wave 2 often happens in strong trending markets as participants are excited and can't wait to buy!
Daily RSI has plenty of room to fall. $19.5 is also the weekly pivot point where price is also expected to find strong support so we may see a reversal from here at the start of next week but these assets are volatile so i would lean towards lower first.
Bitcoin stocks have all had a decent retracement causing me to upgrade my Elliot Wave count to a completed macro wave 1 with wave 2 now underway, suggesting the best returns are still to come over the next months for this category asset class in wave 3!
Analysis is invalidated if we go to new local highs above $23.46 or lose $9.98.
New long signals are certainly building in the DEMA PBR and Price Action strategies so keep an eye out on the Trade Signals Substack as we have made very food profits lately in these markets!
Safe trading
$HUT Clear for Further Upside?NASDAQ:HUT is having a great time clearing resistances, the weekly 200EMA and the weekly Pivot point did not prove challenging.
It is currently sitting in a High Volume Node (HVN) where price is likely to reject and retest the weekly pivot as support before continuing upwards towards $32 and beyond in wave 3.
Wave 2 tested the 'alt-coin' golden pocket between 0.618-0.782 Fibonacci retracement giving me confidence in the count.
Safe trading

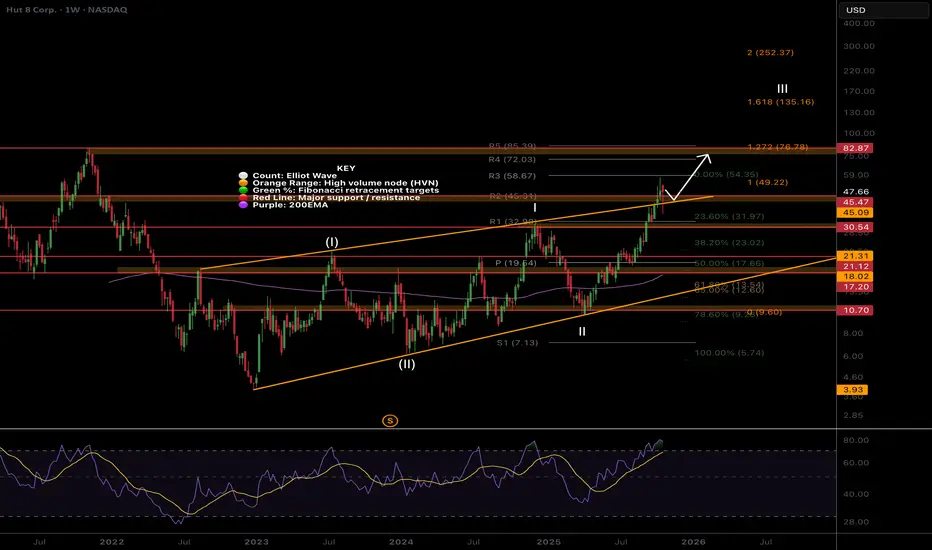
$HUT Macro Chart Preparing for Breakout?NASDAQ:HUT looks poised for a strong breakout with a wave 3 long term target of $58 and a short term resistances of $21 and $33
HUT is moving strong almost up 100% from the recent swing low, overcoming its weekly 200EMA with ease. A test of the 200EMA as support is likely before continuation.
Price is consolidating under major resistance High Volume Node (HVN) and the weekly pivot point. Consolidation under resistance often leads to a breakout.
A series of 1-2s appears to be taking place on the Elliot Wave count finding support at the 'BTC-Miners golden pocket' of 78.6 Fibonacci retracement.
Analysis is invalidated below $10.10
Safe trading

$HUT springboard longNASDAQ:HUT with a beautiful chart looks ready to springboard through a volume gap. Support from all long term SMAs and great looking MACD, RSI, and volume profile. Targeting the .5 and then .618 fib retracement levels. NASDAQ:CORZ acquisition catalyst for many of these btc miners.

Hut 8 Corp (HUT) From Miner to Digital Infrastructure PowerhouseCompany Overview:
Hut 8 NASDAQ:HUT is transforming into a next-gen digital infrastructure leader, blending Bitcoin mining, AI compute, and cloud services for diversified, long-term growth.
Key Catalysts:
Major Operational Upgrades ⛏️
79% QoQ jump in deployed hashrate and 37% fleet efficiency gain in Q1 2025.
Positions HUT for cost-effective BTC production as crypto markets rebound.
Massive Bitcoin Reserves ₿
10,264 BTC on balance sheet (~$847M as of Mar 31, 2025).
Acts as a digital asset custodian + infrastructure operator, offering leveraged upside to BTC.
Diversification into Compute & AI Infrastructure 🧠
Q1 Digital Infrastructure + Compute revenue tops $21M.
Reduces mining dependency and captures tailwinds from AI and HPC demand.
Investment Outlook:
Bullish Case: We remain bullish on HUT above $15.00–$16.00.
Upside Target: $30.00–$32.00, driven by crypto exposure, AI-driven growth, and operational scaling.
⚙️ Hut 8 – Mining the Future of Digital Infrastructure.
#HUT #Bitcoin #CryptoMining #DigitalInfrastructure #AICompute #HPC #Web3 #BTCExposure

Hut 8 - could this give you heart ache instead ?This is in the crytocurrency space and I am not familiar with this asset class. That is why I only advocate 1% of my capital for speculative trade.
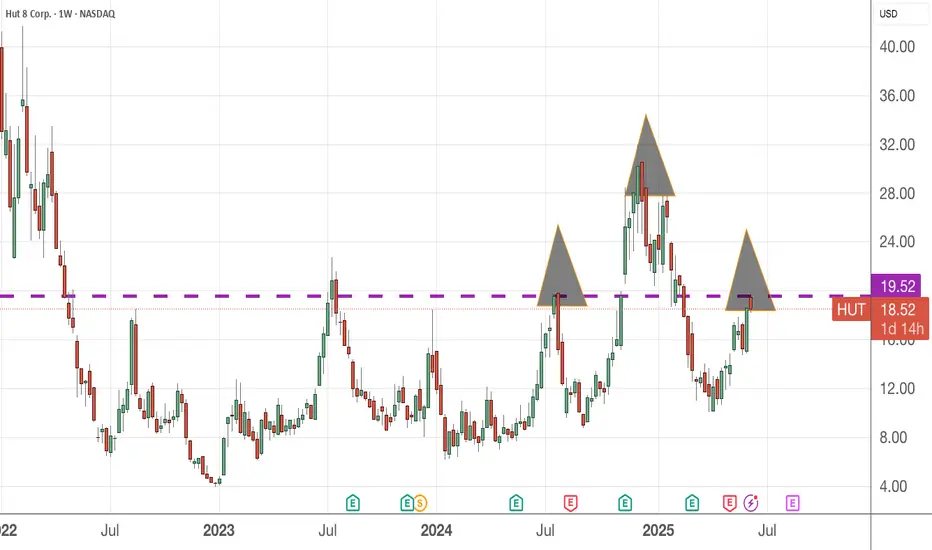
From the weekly chart, it appears a H&S pattern is formed and the dotted line represent the resistance level that the price action is attempting to break above since Aug 2022.
For those who bought at 24 price level, I guess your option is to wait out for it revisit this level or higher. And for those who wish to go LONG, wait for the breakout with a bullish sign first. Alternatively, seek for better asset class/companies to invest in.
crypto bull play if you are bullish crypto this appears like a good stock for a break out. already broken out of an adam and eve, looks like it is confirming trend on shoulder line post earnings report, if the market reacts positively should test historical highs imo. NFA

Hut8Mining Flirting With DangerThe Bitcoin miner is hanging by a thread, if price goes below $20.34 then we know that we are in for a deeper correction, bulls would have to defend that price with all their might, but it seems bears will win the day and possibly some few weeks to come.

Hut8 2025Bitcoin mining companies set to take off in 2025 huge upside with hut8 various targets posted

67R Trade Hut 8 Mining67R Trade on Hut.
Coming into a key support level here.
Good opportunity to get in.
High risk trade.
30% chance of success.

Trading JournalThis was a tiny position on a chart pattern that looked good.
Once it broke out, sold all as it is tiny position, no need to keep it at 1.25% of the account

$HUT one of the most bullish minersBTC has been on a tear the past couple of weeks and the miners are set to follow.
The two most bullish miners are HUT and RIOT for this next move.
I think the most probable scenario from here is to break above the trendline into one of the first two resistances. Then we consolidate before a final move up into the $64 resistance.
Let's see how it plays out over the coming weeks.

HUT - Oct 24 Opening Sustainable Momentum30 Oct Entry:
HUT’s price surged and triggered our stop-limit order. I feel conflicted about this entry; although we were still above BTCUSD's key support and there was a momentum signal in HUT from the strong morning session, BTCUSD movement was weak.
29 Oct Entry (Limit Order Not Activated):
BTCUSD broke the $70K milestone for the first time since 19 Jul and is now approaching another key level not breached since 14 Mar. As BTC rises, crypto miners benefit, with their crypto holdings increasing in value. A strong BTC day typically influences crypto miners' stock movement. With this milestone breakthrough, I expect a larger, sustained run.
HUT shows an H2 opening momentum signal.
Trade idea
BTCUSD hasn’t broken $70,000 since 19 Jul. Surpassing this milestone should drive optimism and excitement into related assets. Trading crypto-related assets driven by BTC reaching new highs is ideal during these two weeks of high-impact macroeconomic, earnings, and election events.
Price could surge further if it breaks $73,931, surpassing the previous high from 14 Mar.
Crypto miners benefit as their crypto holdings increase in value when BTC rises. I’ve noticed that a strong BTC day typically reflects in their stock price movement. Given this key milestone breakthrough, I expect a larger, sustained run.
I’ve shortlisted the following crypto miners, as they’re already in an uptrend and show straightforward price movement.
- Riot Platforms (RIOT)
- Hut 8 corp (HUT)
- Cleanspark Inc (CLSK) - This has my least favourite price movement.
Opening Sustainable Momentum 🧑🏻🚀
Strategy
Signals identify market opening H2 candles through momentum and behaviour change that potentially could indicate a shift in the current price overall structure (Price gaps and ADR %).
Risk
We use the signal candle's highs and lows for entry and stop loss. If price hits the stop loss, it is clear that the shift we expected did not come to fruitation.
Current SL is at 0.25Fib
Focus
Focus is never on the signal candle alone, but it's role in the larger structure and the direction it is inclined towards with a minimum Risk & Reward of 2R.
Stock must be in a pull back or consolidation area waiting for a broad market momentum to ignite it forward.
Character
Trend, Positive Skew
