Short on Icici bankA Failed breakout goes the other way. Thus I am short on this. Stop loss is in the chart.
ICICI Bank Limited ADR
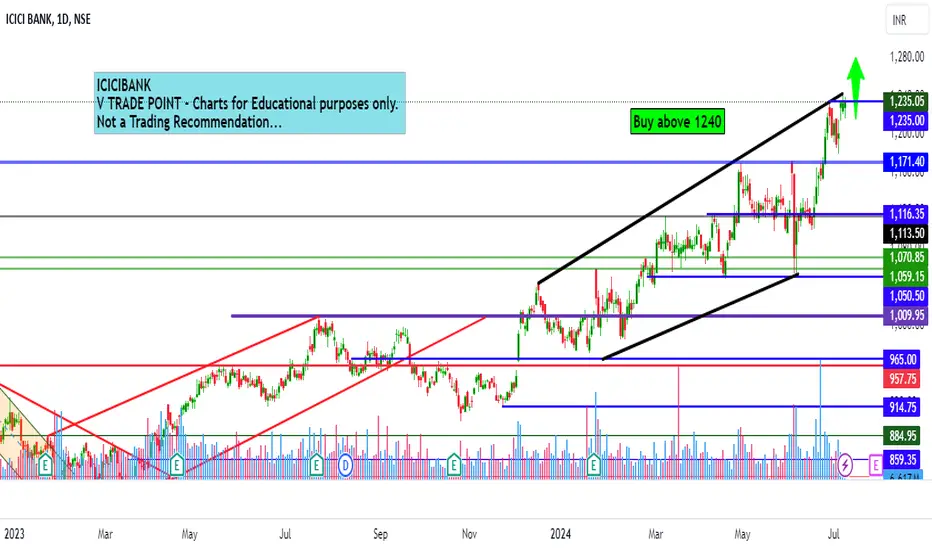
No trades
Trade ideas

ICICI Bank Intraday level for 9th July #ICICIBANK ICICI Bank Intraday level for 9th July #ICICIBANK
Buying opportunity above 1240
Support area 1225-1228. Below ignoring buying opportunity
Charts for Educational purposes only.
Please follow strict stop loss and risk reward if you follow the level.
Thanks,
V Trade Point
Icici bank reversal dueA big reversal due in ICICI bank and can just begin in matter of few dyas. Look out for the reversal.
Just a view.

ICICI BANK S/R for 5/7/24Support and Resistance Levels: In technical analysis, support and resistance levels are significant price levels where buying or selling interest tends to be strong. They are identified based on previous price levels where the price has shown a tendency to reverse or find support.
Support levels are represented by the green line and green shade, indicating areas where buying interest may emerge to prevent further price decline.
Resistance levels are represented by the red line and red shade, indicating areas where selling pressure may arise to prevent further price increases. Traders often consider these levels as potential buying or selling opportunities.
Breakouts: Breakouts occur when the price convincingly moves above a resistance level (red shade) or below a support level (green shade). A bullish breakout above resistance suggests the potential for further price increases, while a bearish breakout below support suggests the potential for further price declines. Traders pay attention to these breakout signals as they may indicate the start of a new trend or significant price movement.
20 EMA: The yellow line denotes 20 EMA, to interpret the 20 EMA, you need to compare it with the prevailing stock price. If the stock price is below the 20 EMA, it signals a possible downtrend. But if the stock price is above the 20 EMA, it signals a possible uptrend.
Disclosure: I am not SEBI registered. The information provided here is for learning purposes only and should not be interpreted as financial advice. It is important to consult with a qualified financial advisor before making any investment decisions. Tweets neither advice nor endorsement.

IBNEducational purpose and not a recommendation
INDIA based bank, election completed, the same govt. (with allied parties) has won the elections. Market will get around and start going up after this settles. Expecting this stock to do well, 4 to 5% in few weeks.

ICICI BANK Downtrend #icicibank
CMP : 1199.60
May be show some downtrend from here.
T1 : 1169
T2 : 1124
SL : Above Trendline

ICICI Bank's Global Ranking Ascends: A Bullish Trading SignalICICI Bank has climbed to become the 18th most valuable lender globally, signaling a bullish outlook for traders. The technical analysis of its stock reveals a recent breakout supported by an ascending trendline, indicative of strong buying momentum and potential for further gains. This key milestone underscores ICICI Bank's robust market presence and offers a promising trading opportunity in the financial sector.

ICICI bank chart analysisICICI bank chart analysis on daily time frame. Please share your feedback and follow for more such analysis

icici Bank channel support Long entryNSE:ICICIBANK icici Bank channel support Long entry above 1135 target 1170

ICICIBANK Intraday Levels: 24-Jun-24Stock closed near at Resistance Zone & Trendline support
Bullish > 1170
Bearish < 1150
Wait for proper rejections at zones, for entry add your strategy or indicator combination.

ICICI Bank u turn ICICI Bank might take a U TURN and give a good swing to positional trade opportunity with a decent stoploss and good Targets
ENTRY - 1115
STOPLOSS - 1105
TARGETS - 1130, 1145, 1160++
Note- if any trade or value that's gone from the marked levels then that's not our trade just let it go or wait for it to come back
I'm not sebi registered this is my personal view
Please like or boost my idea if you like it or traded it
Thankyou

ICICI: 8 Years ChannelIt has gone through the worst a bank can go through
Still its victorioius. It reported its best quarter in Mar 24. Actually it has given 16 quarters of sequential growth.
the PER has dropped to 18 from 16x 5 years back.

ICICI Bank 4H Timeframe Projection ICICI Bank 4H Timeframe Projection
Allover trend is Bullish
Expanding Flag Formed here.

ICICI BANK 1DAY1. nice pattern is observed
2. wait for the potential breakout.
.
.
.
.
.
.
.
I Am Not SEBI Registered Analyst. All Post and Levels Posting is only for educational and knowledge purpose. I Am not responsible for your any kind of loss or profit.
No Claim, All Rights Reserved.‼️

sell at zone ~ intradayexpecting small fall from the zone . look for confirmation inside zone in smaller tf.
- good for intraday trade
- entry inside zone
- sl is day close above zone
- for target draw fib retracement from C to latest swing high , use 0.236 fib as tgt 1 (safe place for intraday), 0.382 as tgt 2 (risk takers).
- don't trade , if u didn't get selling confirmation inside zone
- if day close is above this zone , this pattern becomes invalid.


ICICIBANK POTENTIAL REVERSAL AHEAD WITH THIS PATTERNICICIBANK has experienced a bullish breakout followed by a pullback within the confines of a bull flag pattern. The recent reversal, respecting the upper boundary, suggests a potential retracement within the current bullish trend. Should the breakout occur as anticipated on the chart, a price decline towards the highlighted key level is conceivable.

ICICI Bank 1D Timeframe ProjectionICICI Bank 1D Timeframe Projection
The overall trend is bullish but here I share my view for ICICI Bank.
Upon analyzing the market trends, it has been observed that the overall trend for ICICI Bank is currently bullish. However, to provide you with a detailed perspective, I would like to share my view on the 1D timeframe projection of the stock. By analyzing the past performance of ICICI Bank in the 1D timeframe projection, I can provide you with valuable insights on its future performance.

ICICI BANKAfter 2 months base formation we had a strong breakout candle (Marubozu) & stock is taking a breathe from past 3 days.
Also as per Fib extension we had a pullback exactly from 1.618 level
Looks good till we are trading well above the breakout & targets can be 1180-1200 in short term

ICICI BANK S/R Support and Resistance Levels: In technical analysis, support and resistance levels are significant price levels where buying or selling interest tends to be strong. They are identified based on previous price levels where the price has shown a tendency to reverse or find support.
Support levels are represented by the green line and green shade, indicating areas where buying interest may emerge to prevent further price decline.
Resistance levels are represented by the red line and red shade, indicating areas where selling pressure may arise to prevent further price increases. Traders often consider these levels as potential buying or selling opportunities.
Breakouts: Breakouts occur when the price convincingly moves above a resistance level (red shade) or below a support level (green shade). A bullish breakout above resistance suggests the potential for further price increases, while a bearish breakout below support suggests the potential for further price declines. Traders pay attention to these breakout signals as they may indicate the start of a new trend or significant price movement.
Disclosure: I am not SEBI registered. The information provided here is for learning purposes only and should not be interpreted as financial advice. It is important to consult with a qualified financial advisor before making any investment decisions. Tweets neither advice nor endorsement.

ICICIBANK Bullish trend ContinuationContinuation in the bullish trend formed under the daily timeframe. Once again we witness a bullish breakout on the bull flag formed where we see a potential rally to the upside. This trend remains strong and valid with a perfect bullish setup.

ICICI BANK S/R Support and Resistance Levels: In technical analysis, support and resistance levels are significant price levels where buying or selling interest tends to be strong. They are identified based on previous price levels where the price has shown a tendency to reverse or find support.
Support levels are represented by the green line and green shade, indicating areas where buying interest may emerge to prevent further price decline.
Resistance levels are represented by the red line and red shade, indicating areas where selling pressure may arise to prevent further price increases. Traders often consider these levels as potential buying or selling opportunities.
Breakouts: Breakouts occur when the price convincingly moves above a resistance level (red shade) or below a support level (green shade). A bullish breakout above resistance suggests the potential for further price increases, while a bearish breakout below support suggests the potential for further price declines. Traders pay attention to these breakout signals as they may indicate the start of a new trend or significant price movement.
Disclosure: I am not SEBI registered. The information provided here is for learning purposes only and should not be interpreted as financial advice. It is important to consult with a qualified financial advisor before making any investment decisions. Tweets neither advice nor endorsement.

[Positional] ICICIBank Buy IdeaNote -
One of the best forms of Price Action is to not try to predict at all. Instead of that, ACT on the price. So, this chart tells at "where" to act in "what direction. Unless it triggers, like, let's say the candle doesn't break the level which says "Buy if it breaks", You should not buy at all.
=======
I use shorthands for my trades.
"Positional" - means You can carry these positions and I do not see sharp volatility ahead. (I tally upcoming events and many small kinds of stuff to my own tiny capacity.)
"Intraday" -means You must close this position at any cost by the end of the day.
"Theta" , "Bounce" , "3BB" or "Entropy" - My own systems.
=======
I won't personally follow any rules. If I "think" (It is never gut feel. It is always some reason.) the trade is wrong, I may take reverse trade. I may carry forward an intraday position. What is meant here - You shouldn't follow me because I may miss updating. You should follow the system I share.
=======
Like -
Always follow a stop loss.
In the case of Intraday trades, it is mostly the "Day's High".
In the case of Positional trades, it is mostly the previous swings.
I do not use Stop Loss most of the time. But I manage my risk with options as I do most of the trades using derivatives
