ICICI Bank Ltd for 17th Oct #ICICIBANK ICICI Bank Ltd for 17th Oct #ICICIBANK
Resistance 1420 Watching above 1422 for upside momentum.
Support area 1400 Below 1400 gnoring upside momentum for intraday
Watching below 1398 for downside movement...
Above 1420 ignoring downside move for intraday
Charts for Educational purposes only.
Please follow strict stop loss and risk reward if you follow the level.
Thanks,
V Trade Point
Trade ideas

ICICI BANK🏦 ICICI BANK – MTF TRADE PLAN
Trend: 🔼 UP across all TFs
Bias: Long / Demand Alignment
🔹 HTF (Yearly–Qtrly)
Yearly Demand: 1043–970 (Avg 1007)
6M Demand: 1362–1153 (Avg 1258)
Qtrly Demand: 1281–1153 (Avg 1217)
➡️ HTF Avg: 1229–1092 (Avg 1160)
🔹 MTF (Monthly–Daily)
Monthly BUFL: 1293–1186 (Avg 1240)
Weekly DMIP: 1325–1265 (Avg 1295)
Daily DMIP: 1325–1265 (Avg 1295)
➡️ MTF Avg: 1282–1212 (Avg 1247)
🔹 ITF (240–60M)
Demand: 1325–1265 (Avg 1295)
➡️ ITF Avg: 1325–1265 (Avg 1295)
⚙️ Trade Setup
Entry-1: 1325
Entry-2: 1227
Avg Entry: 1276
Stoploss: 1186
Target: 1641
R:R: 4.05 : 1
Risk: 7% Reward: 29%
💰 Capital Plan
Qty: 1000 Buy Value: ₹13.25L
Own Capital: ₹2.65L MTF: ₹10.6L
Brokerage: 0.49% ≈ ₹6,495
Net Profit (Target Hit): ₹11.79L
Net Loss (SL Hit): ₹12.82L
Interest (4M @9.69% p.a.): ₹33,769
Final Net Profit: ₹11.46L
ROI (4M): ≈ 432%
📊 Summary
✅ All TFs UP
✅ Strong Demand Confluence 1325–1265
✅ Entry Zone: 1227–1325
✅ SL Below 1186 🎯 Target 1641

“ICICI Bank: Where Smart Money Steps InICICI Bank has been trading inside a long-term uptrend channel for the past 3 years. Within this structure, two clear zones are visible:
Higher Value Area (Supply Zone): Sellers dominate → price faces rejection here.
Lower Value Area (Demand Zone): Buyers dominate → price consistently bounces from here.
👉 Every time price approaches the Lower Value Area around 15 times :
(1) Buyers step in aggressively,
(2) Price reverses strongly,
(3) Risk–Reward becomes highly favorable.
(4) This makes the current setup a good accumulation point.
Now once again, price is testing the Strong Demand Zone (₹1340–1320).
Risk–Reward Setup
Buy Zone: ₹1340–1320
Immediate Resistance: ₹1390–1400
Upside Target: ₹1500–1550 (upper channel boundary)
Risk: Breakdown below ₹1320 may lead to ₹1200.
Fundamental Strength
✔️ Healthy Balance Sheet: Strong capital adequacy, well-managed NPAs.
✔️ Consistent Profit Growth: Strong momentum in NII & PAT over the years.
✔️ Retail & Digital Leadership: Leading share in retail loans + strong digital adoption.
✔️ Sector Tailwind: Indian banking credit growth projected at 14–16%, a positive for ICICI.
✔️ Valuation Comfort: Reasonable PE & PB compared to peers (HDFC Bank, Axis Bank).
ICICIBANK: Support Zone & Hidden Setup UnfoldingICICI Bank – Technical Outlook
On the daily and 1-hour charts, ICICI Bank is showing strength near a key support zone of 1370–1390.
On the 1-hour timeframe, the stock is forming a diamond pattern around the 1380–1400 range.
A sustained move above this support zone may trigger upside momentum and lead to higher price levels in the coming sessions.
Conclusion: ICICI Bank is currently at a crucial support area with a developing bullish structure. Traders and investors should monitor these levels closely for potential opportunities.

icici bank chartTrend
Stock recently tested around ₹1500 (resistance zone) and retraced.
Currently at ₹1394, down ~1.2%.
Structure looks like a sideways-to-weakening uptrend; higher highs were made earlier, but now price is slipping towards a support zone.
Key Levels:
Immediate Support: ₹1380 – 1400 zone (currently testing).
Strong Support: ₹1320 – 1340 (if current support breaks).
Major Support: ₹1250 & then ₹1180.
Immediate Resistance: ₹1450 – 1475.
Major Resistance: ₹1500 (recent swing high).
Chart Pattern:
Price is consolidating after an uptrend.
A break below ₹1380 may trigger a short-term bearish move.
If it holds above ₹1380, sideways consolidation can continue with chance of re-testing ₹1450/1500.
Stop Loss & Targets (Short-Term Swing):
If Long (Bullish bias):
Entry near: ₹1390 – 1400 (only if it holds this support).
Stop Loss: ₹1365.
Targets: ₹1450 → ₹1500.
If Short (Bearish bias):
Sell if closes below ₹1380.
Stop Loss: ₹1415.
Targets: ₹1340 → ₹1300.
📊 Fundamental View
Business Strength: ICICI Bank is one of India’s leading private sector banks with strong retail & corporate lending.
Financial Performance (latest trends till FY25):
NII (Net Interest Income): Steady double-digit growth.
Asset Quality: GNPA and NNPA at record lows compared to past years.
ROA / ROE: Among the best in private banking space.
Credit Growth: Strong in retail & SME segments.
Valuation: Fairly valued compared to peers like HDFC Bank, Axis Bank, and SBI.
Outlook: Fundamentally strong for medium-to-long term investors, but short-term volatility linked to RBI rate stance, credit growth, and NIM pressure.
🧭 Verdict
Short-Term (1–4 weeks): Neutral-to-slightly bearish unless ₹1380 holds strong. Break below = bearish move.
Medium-Term (3–6 months): Still bullish as long as price stays above ₹1250; stock may retest ₹1500–1550.
Long-Term (1+ year): Fundamentally strong; good hold for investors.
this is only learning purpose not any buy sell recommendation. analyses your self its good for you

ICICI BANKMulti Time Frame Analysis
HTF (Yearly → Quarterly): All UP. Demand zones 970 – 1362, avg ≈ 1160. Price currently trading well above = bullish.
MTF (Monthly → Daily): All UP. Strong cluster demand 1186 – 1325, avg ≈ 1250.
ITF (240m → 60m): Exact same demand band 1186 – 1325, avg ≈ 1256.
Takeaway:
Strong confluence demand at 1186–1250 zone.
Trend across all frames = UP ✅.
🔹 Trade Plan
Entry: 1325
Stop Loss (SL): 1186 (–139 pts, ~10%)
Target: 1639 (+314 pts, ~24%)
Risk-Reward Ratio: ~2.11 → very favorable ✅
Position Sizing Example (as per your plan):
Qty: 1000
Capital: ₹13.25 Lakh
Risk (if SL hit): ₹1.39 Lakh
Reward (if Target hit): ₹3.14 Lakh
Net Profit after brokerage: ₹3.07 Lakh
🔹 Key Technical Levels
Support: 1186 (clustered across MTF & ITF, must hold)
Resistance Levels:
1500 (recent high, partial booking zone)
1639 (full target)
Intermediate Gann Levels:
Likely swing resistance bands fall around 1430–1450 before 1500.
🔹 Capital Efficiency / ROI
You’ve smartly added ROI calculation if trade runs 4 months:
Net profit after funding cost (interest @ 9.69% p.a.): ₹2.73 Lakh
Real ROI in 4 months = 103% 🚀
That means even with borrowed capital, trade is extremely efficient.
🔹 My View
Setup is very strong: UP trend, confluence demand zone, RR > 2.0.
Price has good buffer from SL (1186) to entry (1325).
Execution suggestion:
Stagger entry between 1293–1325 to lower avg. cost.
Book partial near 1500, trail SL to cost, let rest ride toward 1639.

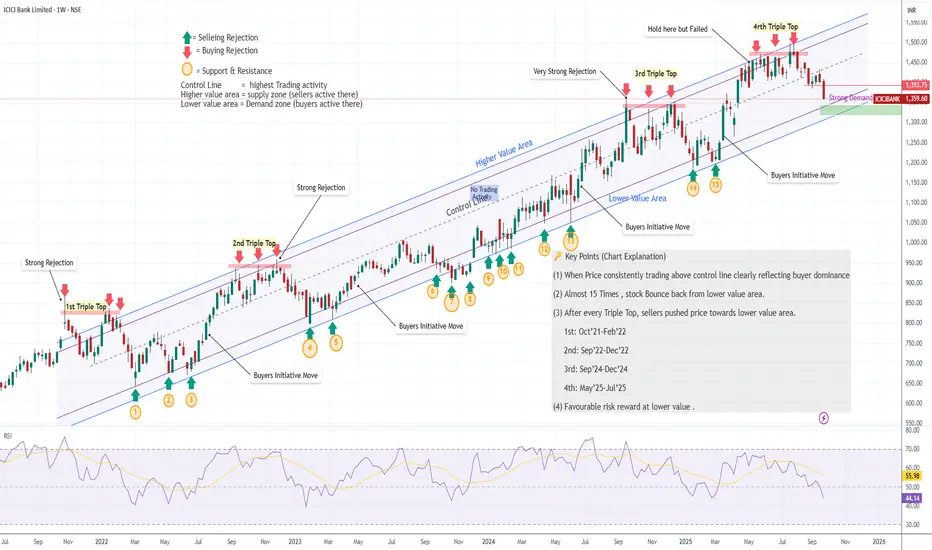
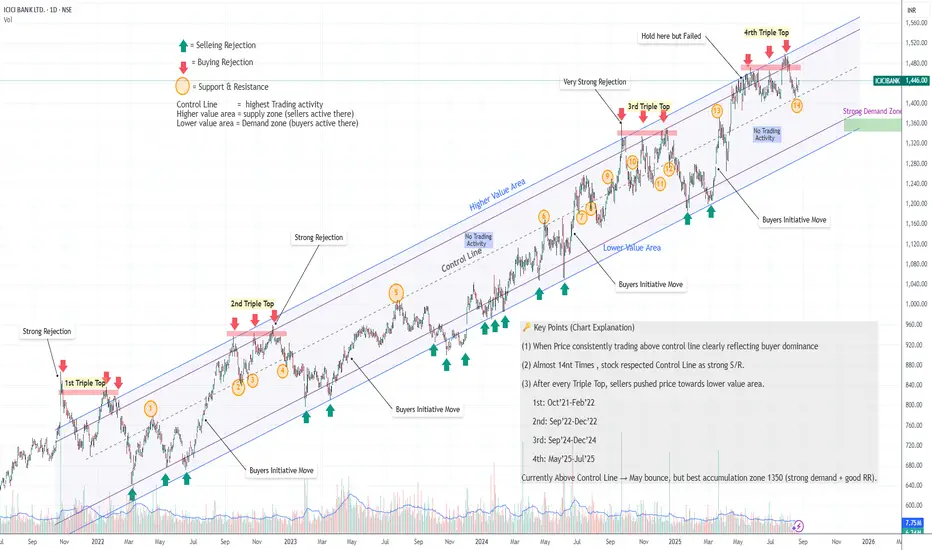
“ICICI Bank – Triple Tops Rejected, Demand Zone in Focus”🔑 ICICI Bank – Key Technical Points
📌Multiple Times → Control Line acted as S/R (around 14nth Times)
price respected the Control Line – price took support & resistance near Control Line → confirms its importance.
📌 Repeated Triple Tops → Seller Pressure
Every time the stock formed a Triple Top, sellers pushed it down towards the lower value area.
🔺 1st: Oct’21 – Feb’22
🔺 2nd: Sep’22 – Dec’22
🔺 3rd: Sep’24 – Dec’24
🔺 4th: May’25 – Jul’25
📌 Current Situation
Price is trading near the Control Line → short-term bounce is possible here but Don't forget Triple top recently forming here.
📌 Demand Zone (Near 1350 or Lower Vale area)
The strongest buying opportunity lies in this zone at 1350 – historically a key demand area offers the best risk–reward setup.
No indicator, no oscillator, No Moving Average, No Fundamental factor included: - Theory is just based on Price action breakdown.
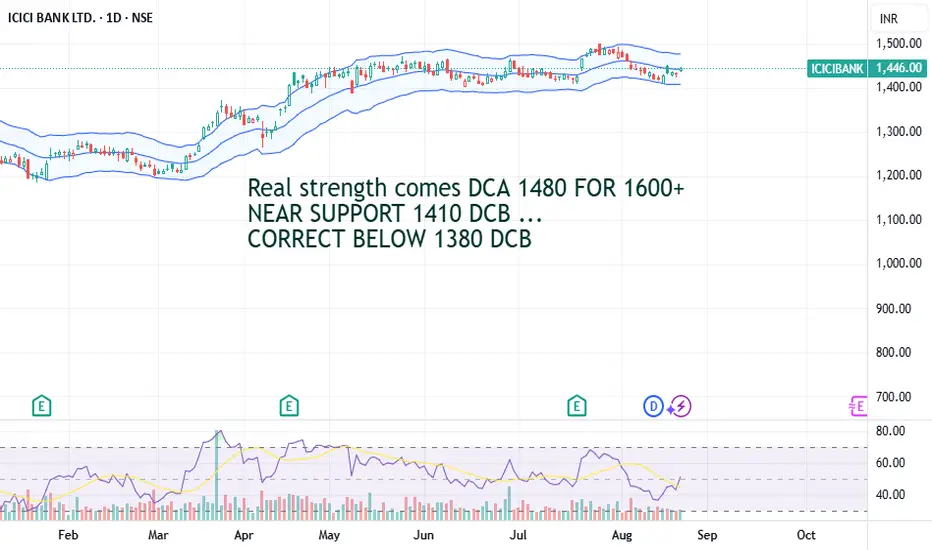
PROFITABLE ICICI READY TO CROSS ATH OR BE IN RANGE 1380-1500 ??Profitable Pvt. ICICI bank is in consolation 120 point since 40 days once this phase over and success to daily close above 1480 try to touch ATH and easily shift to 1600+ .
Keep near term DCB SL1410 and long hold SL DCB 1380 ....
ICICI Bank on the move! A strong buy opportunity spotted.There are two charts of ICICI Bank—one on the 1-hour timeframe and the other on the 4-hour timeframe.
On the 4-hour chart, ICICI Bank is trading within a well-defined parallel channel, with strong support in the 1400–1410 zone.
“On the 1-hour chart, ICICI Bank is forming a Symmetrical Triangle pattern with support near 1424. The weekly pivot level at 1423 may also act as strong support, while the monthly pivot at 1450 is acting as resistance. The pattern breakout indicates a potential target of 1465.
If this support level holds, the stock may witness higher price levels.
Thank You !!

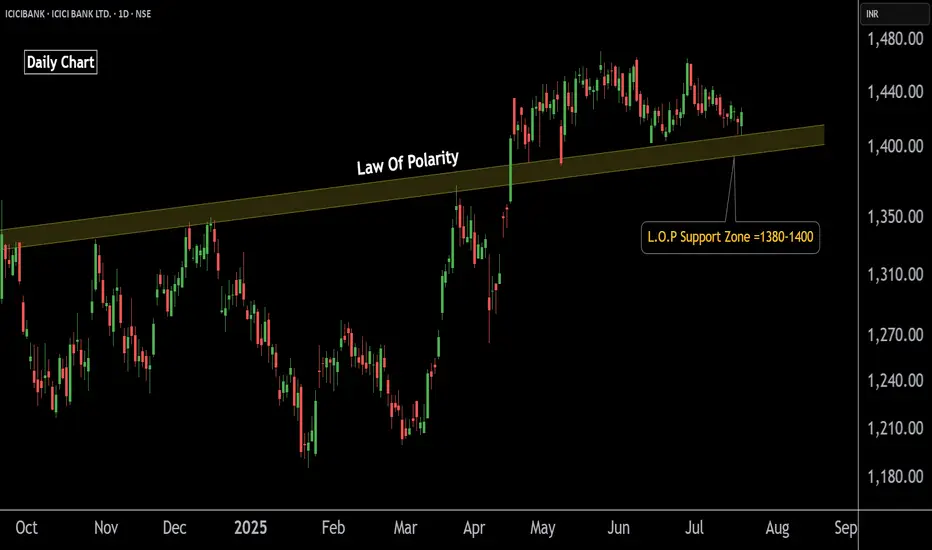
ICICI Bank Poised for Upside – Buy OpportunityThis is the daily chart of ICICIBANK.
ICICIBANK having a good law of polarity at 1380-1400 level .
If this level is sustain then we may see higher prices in ICICIBANK.
Thank You !!
ICICI Bank_Key Resistance Area/ All time HighICICI Bank - Price near all time high or key resistance area. Although the price is making a big green candle, volume doesn't support the breakout momentum (or atleast Breakout momentum is not created yet). Good part is - Price takes support at 20 DEMA and all other price structure looks good for potential breakout.
Watch the key area and how tomorrow going to be.

ICICI Bank Ltd view for Intraday 22nd May #ICICIBANKICICI Bank Ltd view for Intraday 22nd May #ICICIBANK
Resistance 1450 Watching above 1452 for upside momentum.
Support area 1420 Below 1430 ignoring upside momentum for intraday
Watching below 1417 for downside movement...
Above 1430 ignoring downside move for intraday
Charts for Educational purposes only.
Please follow strict stop loss and risk reward if you follow the level.
Thanks,
V Trade Point

ICICI BANK showing bearish patternICICI BANK SHOWING clearly bearish signal as market is having some of its own issue of india pak- and stock is also at its high with profit booking face the level of 1400 is the support once it break it highly possible to reach 1350 or more down

ICICI Bank Ltd view for Intraday 5th May #ICICIBANK ICICI Bank Ltd view for Intraday 5th May #ICICIBANK
Resistance 1435-1438 Watching above 1438 for upside movement...
Support area 1420 Below 1420 ignoring upside momentum for intraday
Watching below 1417 for downside movement...
Above 1435 ignoring downside move for intraday
Charts for Educational purposes only.
Please follow strict stop loss and risk reward if you follow the level.
Thanks,
V Trade Point
ICICI Bank Ltd view for Intraday 29th April #ICICIBANK ICICI Bank Ltd view for Intraday 29th April #ICICIBANK
Resistance 1430-1435 Watching above 1435 for upside movement...
Support area 1420 Below 1420 ignoring upside momentum for intraday
Watching below 1417 for downside movement...
Above 1430 ignoring downside move for intraday
Charts for Educational purposes only.
Please follow strict stop loss and risk reward if you follow the level.
Thanks,
V Trade Point

ICICI Bank Ltd view for Intraday 28th April #ICICIBANK ICICI Bank Ltd view for Intraday 28th April #ICICIBANK
Resistance 1420 Watching above 1422 for upside movement...
Support area 1400 Below 1400 ignoring upside momentum for intraday
Watching below 1397 for downside movement...
Above 1420 ignoring downside move for intraday
Charts for Educational purposes only.
Please follow strict stop loss and risk reward if you follow the level.
Thanks,
V Trade Point

ICICI Bank Ltd view for Intraday 23rd April #ICICIBANK ICICI Bank Ltd view for Intraday 23rd April #ICICIBANK
Resistance 1420-1425 Watching above 1430 for upside movement...
Support area 1400 Below 1400 ignoring upside momentum for intraday
Watching below 1397 for downside movement...
Above 1420 ignoring downside move for intraday
Charts for Educational purposes only.
Please follow strict stop loss and risk reward if you follow the level.
Thanks,
V Trade Point

ICICI Bank Ltd view for Intraday 22nd April #ICICIBANK ICICI Bank Ltd view for Intraday 22nd April #ICICIBANK
Resistance 1420-1425 Watching above 1430 for upside movement...
Support area 1400 Below 1400 ignoring upside momentum for intraday
Watching below 1397 for downside movement...
Above 1430 ignoring downside move for intraday
Charts for Educational purposes only.
Please follow strict stop loss and risk reward if you follow the level.
Thanks,
V Trade Point

Review and plan for 22nd April 2025 Nifty future and banknifty future analysis and intraday plan in kannada.
This video is for information/education purpose only. you are 100% responsible for any actions you take by reading/viewing this post.
please consult your financial advisor before taking any action.
----Vinaykumar hiremath, CMT

icici bank 1620 or 1380icici bank 1620 or 1380
ICICI Bank recently announced its Q4 FY25 results, showing an 18% increase in net profit to ₹12,630 crore. The bank also declared a ₹11 per share dividend, reflecting strong financial performance. Analysts expect stable net interest margins (NIMs) and encouraging credit growth, though some margin pressure may arise due to the recent repo rate cut by the RBI.

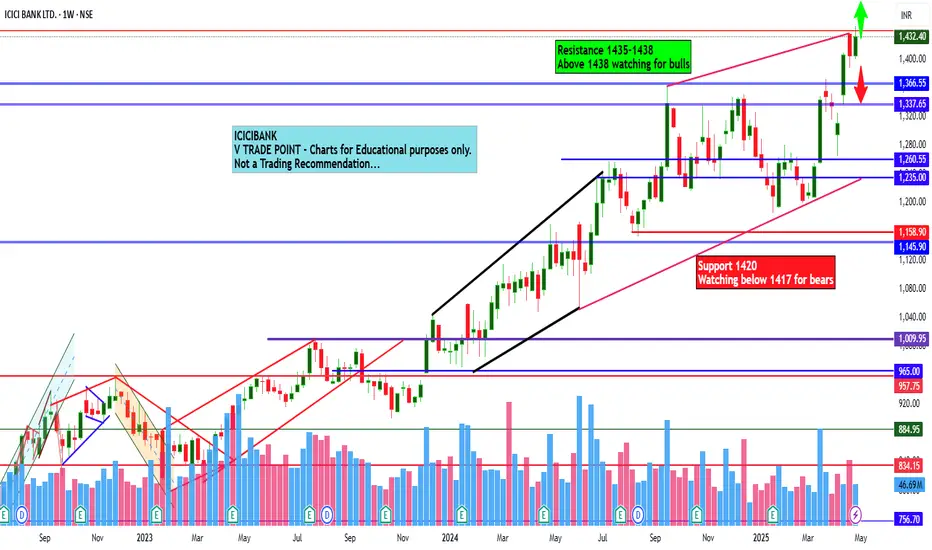
Positional Trade Setup: ICICI Bank Ltd (NSE: ICICIBANK)Key Technical Observations
Current Price: ₹1,406.70 (Near key resistance)
Key Levels:
Support: ₹1,350 (Strong Base) → ₹1,300 (Major Swing Low)
Resistance: ₹1,500 (Psychological Level) → ₹1,600 (2024 High)
Trend Indicators:
TEMA (5,9,20): Bullish alignment (short-term momentum intact).
SuperTrend (10,3): Green line → Uptrend confirmation.
Price Action: Consolidating near ₹1,400; breakout above ₹1,420 could trigger next rally.
Fundamental Checks (Screener.in Recommended)
Sector: Banking (Private Sector Leader)
Growth Drivers:
Loan book expansion (+15% YoY)
Stable NIMs (~4-4.5%)
Consistent ROE (~16-18%)
Valuation: P/B ~2.5 (Fair for sector).
Trade Execution Plan
✅ Entry Zone:
Conservative: ₹1,380-1,400 (Dip near support)
Aggressive: Above ₹1,420 (Breakout confirmation)
🛑 Stop-Loss: ₹1,320 (Below recent swing low)
🎯 Targets:
₹1,500 (7% upside)
₹1,600 (14% upside – Trail SL)
⏳ Holding Period: 1-3 months (Banking stocks trend with Nifty).
Confirmation Signals
Volume: Surge above 20-day avg on breakout.
Sector Trend: Monitor Bank Nifty (support at 46,000).
Earnings Date: Next quarterly results (check Screener.in).
Risk Management
Avoid if RBI hikes rates unexpectedly.
Exit if price closes below SuperTrend line.
Final Verdict: Strong technical structure + sector tailwinds = High-probability trade. Pair with fundamentals for conviction.

Icici Bank trend directionIcici bank 1311 has a W patteren and is trying to hold the confirmation line. If it could hold the confirmation line could move higher. If not , It would test target 1215
News : ** HSBC identifies five Indian stocks — Reliance Industries
RELIANCE1!, ICICI Bank ICICIBANK , TVS Motor TVSMOTOR, Shriram Finance SHRIRAMFIN, and Adani Ports ADANIPORTS — as its top picks offering profit visibility
in.tradingview.com/symbols/NSE-ICICIBANK/forecast/
What is ICICIBANK stock forecast?
We've gathered analysts' opinions on ICICI BANK LTD. future price: according to them, ICICIBANK price has a max estimate of 1,710.00 INR and a min estimate of 1,290.00 INR. Watch ICICIBANK chart and read a more detailed ICICI BANK LTD. stock forecast: see what analysts think of ICICI BANK LTD. and suggest that you do with its stocks.

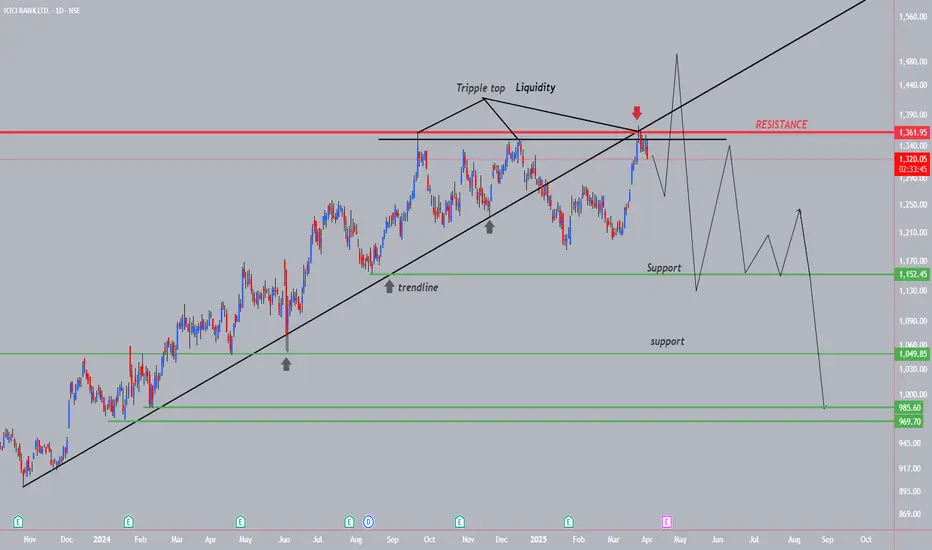
ICICIBANK--Tripple Top Liquidity+Down??This banking sector stock has broken the trendline strongly...
recently price taken the double top liquidity, creating an another liquidity....
do not make any attempt of short from this levels, still we don't have a sign of bearishness....
wait for one more liquidity on topside with strong upside move as exhaustion
then will observe a strong fall, after the liquidity...
then will go for short side...
on the bottom side we have a lot of trendline liquidity lies at support levels.
we have to look for buy at these levels for an investing point of view.