Trade ideas

INFY – Reversal Setup in Making?📲 INFY – Reversal Setup in Making?
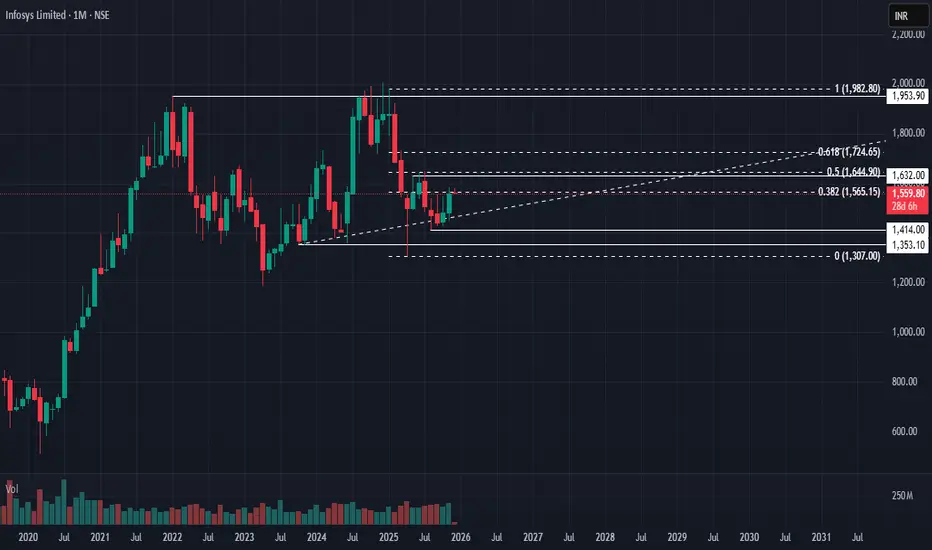
With most of the global negativity already priced in, the IT sector is showing early signs of stability. INFY is forming a structure that can lead to a trend reversal, provided key levels are reclaimed.
📌 Trade / Investment Plan
• CMP: ₹1562
• Stop Loss: ₹1390
• Targets: ₹1644 / ₹1724 / ₹1953
📍 Structure & Logic
• Global slowdown & US concerns already factored into price
• IT basket showing relative strength vs fear
• Higher stability forming at base
• Above ₹1650, an Inverse Head & Shoulder pattern gets invalidated, which often leads to strong upside
• ₹1645–₹1650 = Major resistance zone
• Break & hold above this zone can accelerate momentum
⚠️ Buying Strategy
Start with small position sizing and follow a staggered accumulation strategy. Increase position only after targets start getting achieved or after a strong breakout above resistance.
⚠️ Clarification:
This is an independent analysis based purely on technical and market study. No part of Religare is involved in this view or recommendation.
📝 Important:
I am not responsible for any loss or profit incurred. I am not taking any fees for these views – just sharing my analysis for educational and informational purposes.
📉 Disclaimer: Not SEBI-registered. Please do your own research or consult a financial advisor before taking any investment decision.
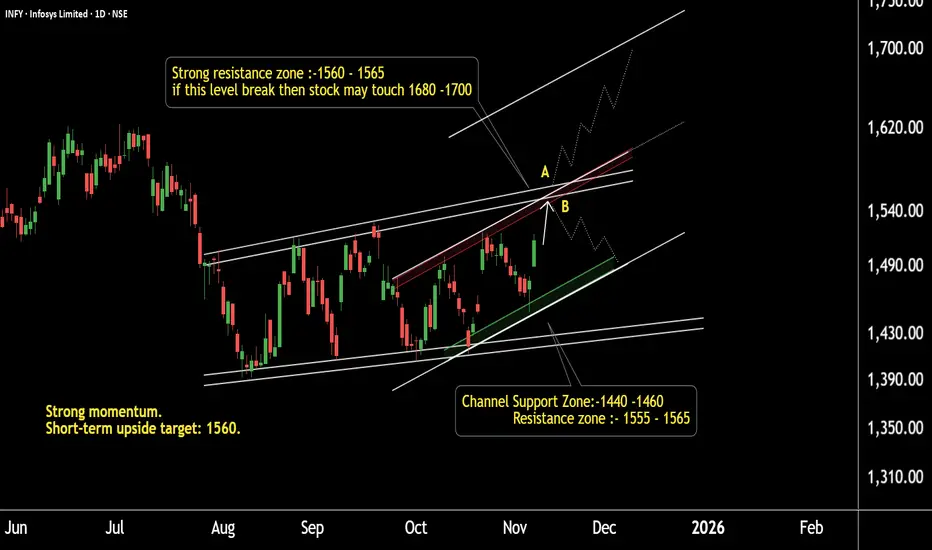
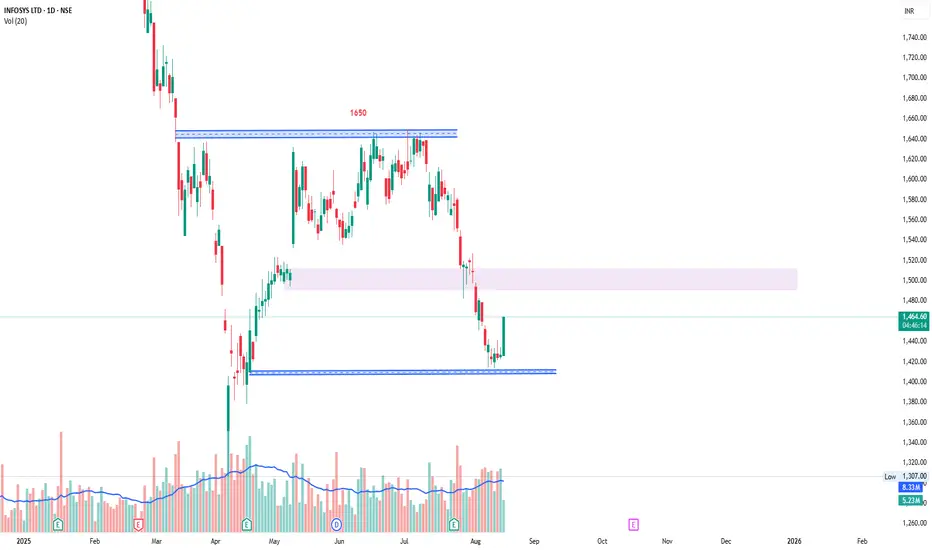
INFY Battle Zone: Levels That Decide the TrendThis is the daily timeframe chart of INFY.
The stock has a strong support zone near 1410 and 1440.
It is facing major resistance within the short-term and mid-term channel around 1555–1565.
Currently, INFY is trading near 1520, and the ongoing move may extend toward 1560.
If the stock fails to break this resistance, a short-term decline may occur.
However, if the resistance is decisively broken, INFY has the potential to rally toward 1680–1700 based on the channel trend.
Thank You !!
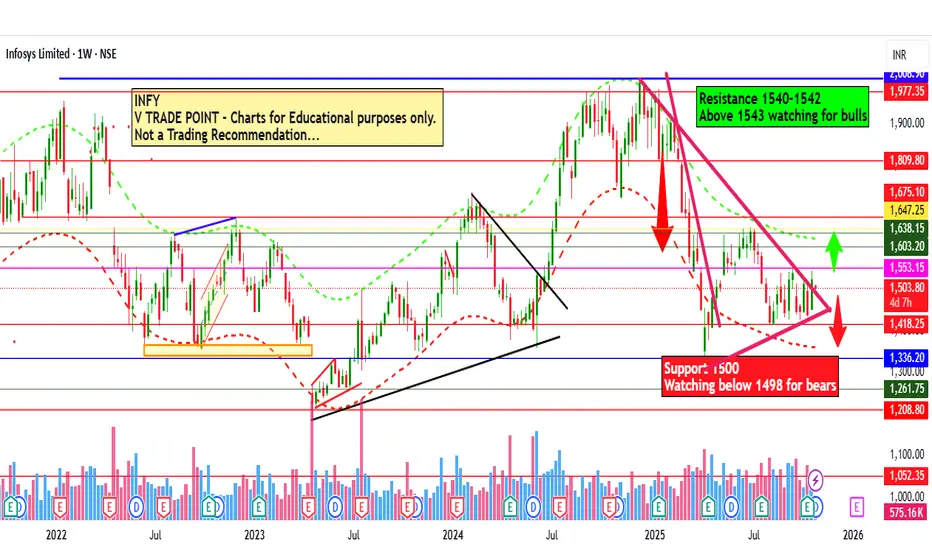
Infosys Ltd for 27th Oct #INFY Infosys Ltd for 27th Oct #INFY
Resistance 1540 Watching above 1542 for upside momentum.
Support area 1500 Below 1520 gnoring upside momentum for intraday
Watching below 1498 for downside movement...
Above 1520 ignoring downside move for intraday
Charts for Educational purposes only.
Please follow strict stop loss and risk reward if you follow the level.
Thanks,
V Trade Point
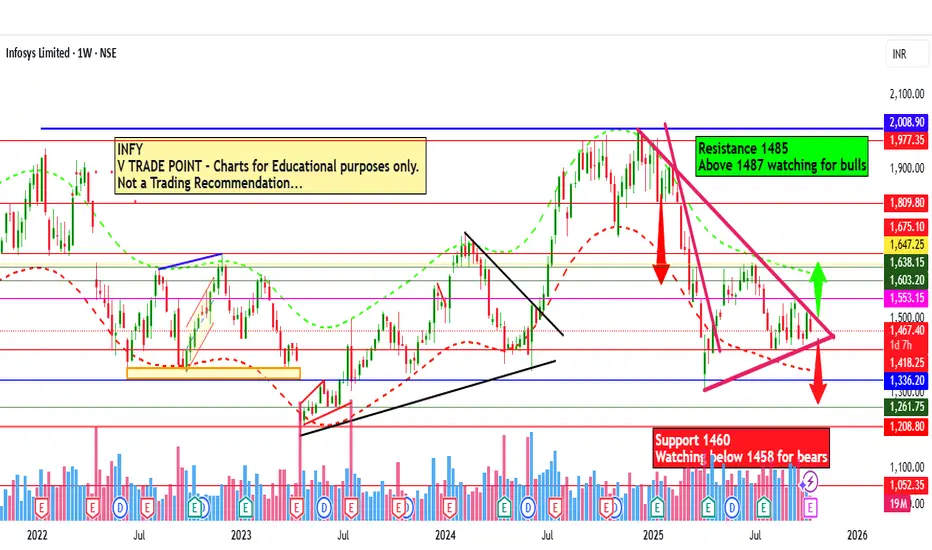
Infosys Ltd for 16th Oct #INFY Infosys Ltd for 16th Oct #INFY
Resistance 1485 Watching above 1487 for upside momentum.
Support area 1460 Below 1460 gnoring upside momentum for intraday
Watching below 1458 for downside movement...
Above 1480-1485 gnoring downside move for intraday
Charts for Educational purposes only.
Please follow strict stop loss and risk reward if you follow the level.
Thanks,
V Trade Point
Infosys Ltd for 13th Oct #INFY Infosys Ltd for 13th Oct #INFY
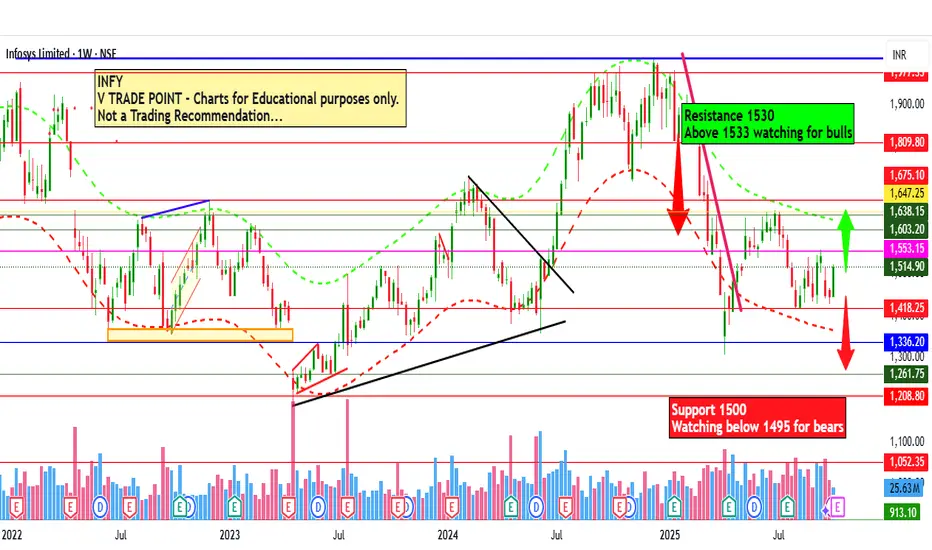
Resistance 1530 Watching above 1533 for upside momentum.
Support area 1500 Below 1515 gnoring upside momentum for intraday
Watching below 1495 for downside movement...
Above 1520 ignoring downside move for intraday
Charts for Educational purposes only.
Please follow strict stop loss and risk reward if you follow the level.
Thanks,
V Trade Point
Infosys Ltd for 9th Oct #INFY Infosys Ltd for 9th Oct #INFY
Resistance 1500 Watching above 1503 for upside momentum.
Support area 1480 Below 1480 gnoring upside momentum for intraday
Watching below 1478 for downside movement...
Above 1500 gnoring downside move for intraday
Charts for Educational purposes only.
Please follow strict stop loss and risk reward if you follow the level.
Thanks,
V Trade Point

INFY Turning Bullish: IT Giant Ready for the Next Leg UpINFOSYS — 1 Hour Timeframe Analysis
INFY is showing strong momentum after respecting its support zone around 1400–1420. The stock has rebounded well and is now approaching its resistance zone near 1580–1590.
The Supertrend indicator is displaying a positive bias, while the MACD has confirmed a bullish crossover in the positive zone, further validating the ongoing strength in momentum.
Any buy-on-dip opportunity near the Supertrend support around 1450–1460 could offer another round of bullish momentum. The stock is currently maintaining a Higher Low – Higher High (HL–HH) structure, indicating a healthy uptrend continuation.
If the support zone holds firmly, we may witness higher prices in INFY in the coming sessions.
Thank You !!

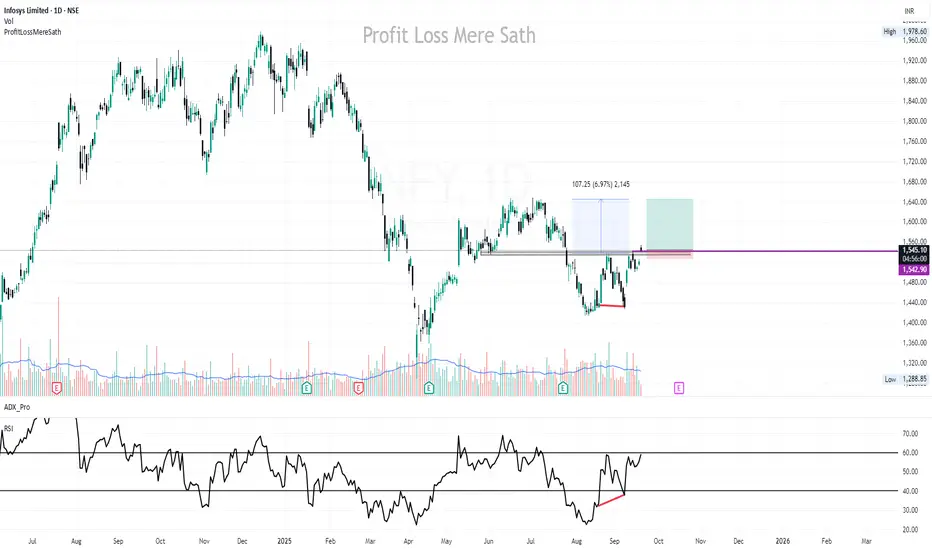
INFY | Buy @LTP | RSI Divergence & Dbl Bottom |Buy @ LTP | RSI Divergence & Dbl Bottom | SL below 1535 on closing basis | 1st Target 1650
Disclaimer:
This is not financial advice. Please do your own research or consult with a financial advisor before making any investment decisions. Investments in stocks can be risky and may result in loss of capital.
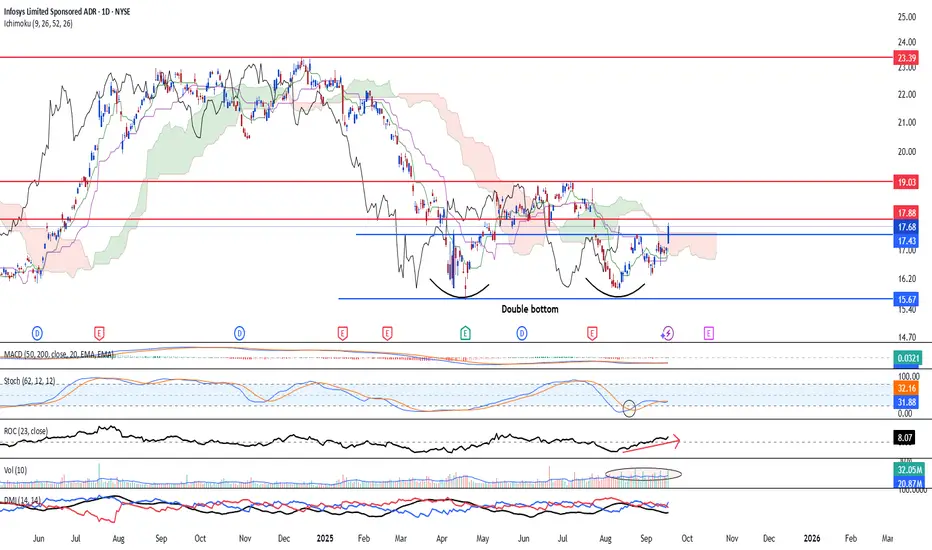
Double bottom in play potentially for InfosyNYSE:INFY has formed a double bottom formation and on the 2nd bottom, the stock has formed an internal pair of higher high and low, indicating bullish pressure may be back. Ichimoku has shown two out of three bullish crossover and candle has closed above leading span A, just pending a kumo twist to the upside. Stochastic shows an oversold crossover and 23-period ROC is rising and positive. Volume remain strong and healthy.
A further break up above 17.88 will signal more stronger upside confirmation. Near-term target will be at 19.03 and long term target at 22.00
Review and plan for 11th September 2025Nifty future and banknifty future analysis and intraday plan.
Stock ideas for intraday.
This video is for information/education purpose only. you are 100% responsible for any actions you take by reading/viewing this post.
please consult your financial advisor before taking any action.
----Vinaykumar hiremath, CMT

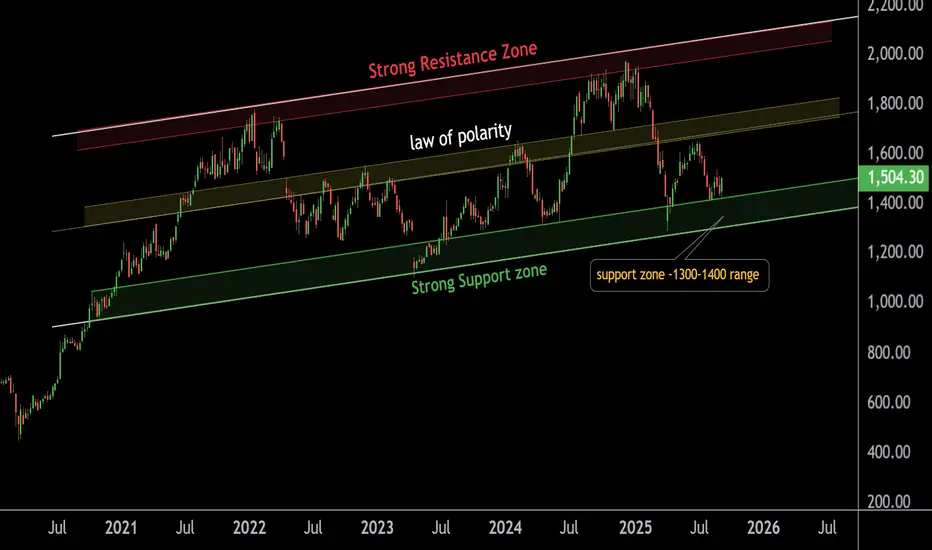
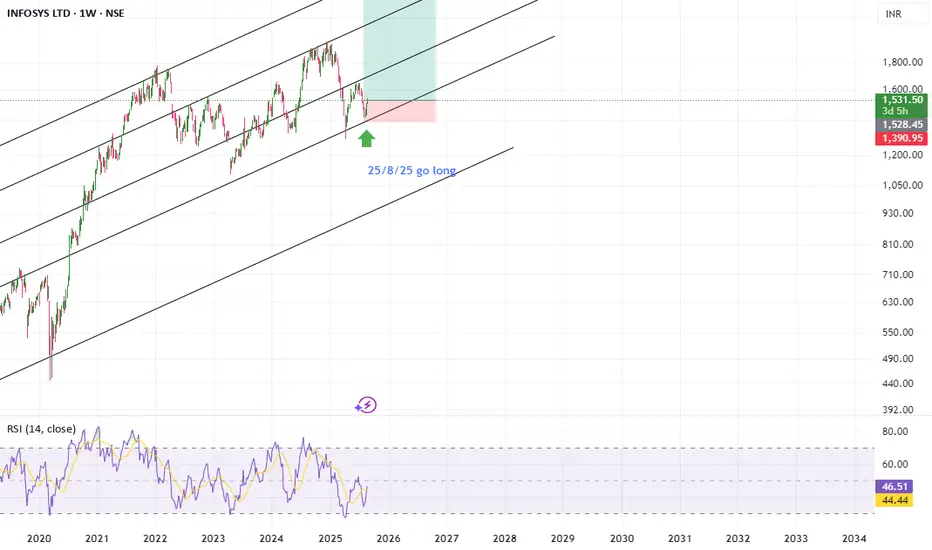
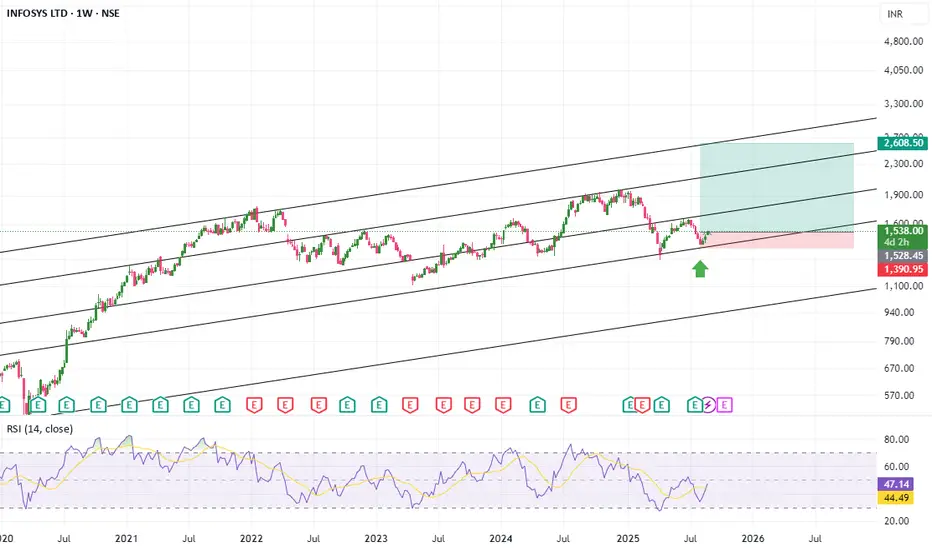
Infosys Holding Strong at Powerful Support – Big Move AheadThis is the weekly chart of Infosys (INFY).
INFY is currently trading within an ascending parallel channel, with a strong support zone in the ₹1300–₹1400 range.
The stock has shown a bounce from this level, offering traders and investors a favorable opportunity to accumulate.
If this support sustains, the next potential upside targets are around ₹1750–₹1800, with the upper boundary of the channel positioned near ₹2100–₹2200.
Thank you.
Infosys, Strong Support, 1D, LongInfosys has a strong support at 1400 and it has show a strong buying from this level. There is good opportunity for it to reach 1500 and above from here.
Entry:
1450-1460
Target: 1500
Target2: 1550-1600.
done retest on weekly frame chart analyse says it have done retest of trend line, now it have much space to go down in it
good chart patern , easy to understand infosys is bullish at momemetum and will stay bullish , taking spot on trendlines and look at RSi as well , is bullish
INFOSYS 1D TIME FRAME ANALYSISINFOSYS HAS DONE A GOOD OB,HERE IT CAN GO UPSIDE
Let's see what's next

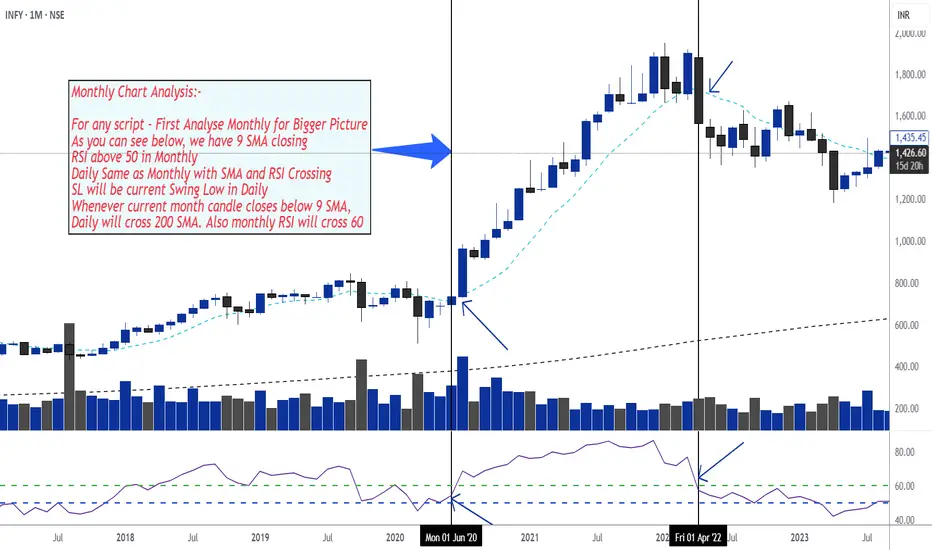
Swing Trading Setup - RSI and SMA 9 & 200🔍 Step-by-Step Monthly Chart Analysis
1. Start with the Monthly Chart – The Bigger Picture
9 SMA (Simple Moving Average)
→ Check if the current monthly candle is closing above the 9 SMA.
This indicates a bullish trend and acts as confirmation for strength in the longer term.
RSI (Relative Strength Index)
→ RSI should be above 50.
This suggests momentum is on the bullish side.
2. Align Daily Chart with Monthly
On the daily chart, confirm the following:
Price is also closing above the 9 SMA
RSI is also above 50 and crossing upward
✅ When both monthly and daily charts are aligned with these indicators, this is a strong confirmation for entry.
3. Stop-Loss Strategy
Use the most recent swing low on the daily chart as your Stop Loss.
This keeps your risk defined and close to your entry level.
4. Exit or Red Flag Condition
If the monthly candle closes below the 9 SMA, this is your major signal to:
Watch out for a trend reversal
Expect that the daily chart might cross below the 200 SMA
Also, watch for monthly RSI potentially crossing below 60, indicating waning momentum
📌 This acts as a signal to either exit the trade or tighten your stop loss.
Swing & Positional Trading - Cash & Stock Options EntryThis trading guide outlines a simple and effective setup for both positional and swing trades, focused on high beta, highly liquid stocks. Follow the rules strictly for better consistency and profitability.
🔹 Positional Trade Setup
• Open the Monthly Chart of the stock.
• Add the RSI (Relative Strength Index) indicator.
• Uncheck all levels (30, 50, 70) and only keep one level at 60.
• Edit the level from 70 to 60 and highlight it in green.
Entry Criteria:
• Stock must cross the 60 RSI level on the monthly chart.
• Entry is only triggered if the price breaks the previous month's high.
Stop Loss:
• Place the initial stop loss below the previous month's low.
Trailing Stop Loss:
• Trail the stop loss to the current month’s low, but only after the monthly candle closes.
• Continue trailing the stop loss every month using this method until exit.
Exit Rule:
• Exit the positional trade only if the current month’s candle closes below the previous month’s low.
⚡ Note: The RSI 60+ setup is a powerful momentum strategy with high reward probability.
🔹 Swing Trade Setup
• Precondition:
• Monthly RSI must cross above the 60 level.
• Switch to the Daily Chart of the stock.
Entry Criteria:
• Identify the current swing high on the daily chart.
• Entry is triggered only when the stock breaks the swing high.
Stop Loss:
• Place the stop loss below the current swing low.
• If unsure how to mark swing low, then use a daily close below RSI 60 as your stop.
Trailing Stop Loss:
• If the trade moves in your favor, trail the stop loss to each day’s low.
Exit Rule:
• Exit the swing trade only if RSI crosses back below 60 with a daily candle close.
📝 Conclusion
This is the final and simplified setup designed for traders looking for clarity and consistency in trading. No complicated indicators or confusing rules—just clean chart action with momentum logic.
🔥 Stock Options Trading Strategy – Built on Core Swing/Positional Principles (75% Win Rate Setup)
As a continuation of my last post on Swing and Positional Trading Setup with 75% Win Rate, I’m now sharing a Stock Options Trading Concept that follows the same core principles but is tailored specifically for liquid stock options.
You’ve already been provided with a list of 100+ high-beta, liquid stocks. For this strategy, you will strictly focus only on those stocks.
✅ Strategy Setup
🔹 Timeframe Filters:
• Monthly RSI > 60 (RSI has crossed and is holding above 60)
• Daily RSI: RSI must be crossing 60 or on the verge of crossing
Now, on the Daily Chart, mark the current swing high and swing low.
📌 Two Entry Approaches:
Approach 1: Breakout Entry
• Entry: When swing high is broken.
• Stop Loss (SL): Swing low or previous week’s low.
Approach 2: Pullback Entry
• Wait for a retracement from swing high (should not exceed 50% retracement).
• Confirmation of pullback weakness: Volume bars should be shrinking/decreasing.
• Entry: On breakout of the last candle high of the pullback.
• Stop Loss: Swing low or previous week’s low.
Once in the trade, trail your stop loss to cost after 3 consecutive bullish candles.
📤 Exit Rules
• Exit the Stock Options position only if the Daily RSI close below 60.
⚠️ Important Guidelines for Stock Options
• 💡 Trade with only 1 lot. Never exceed your lot size.
• 📅 Enter after 2 days of the monthly expiry and exit before 2 days of next monthly expiry to avoid smart money manipulation.
• 🎯 Choose strike prices in multiples of 25, 50, 75, or 100 for better liquidity.
• Example: If stock is at 1564, choose 1550 ITM or 1575 ATM.
• ⏱️ For quick exits, always place exit orders at round numbers like 5 or 10 levels.
• Example: If you entered at ₹70 and the option is at ₹144, place an exit at ₹140 or ₹145—not any random price.
For PE buying-
Monthly RSI < 40
Weekly RSI < 40
Daily RSi crossing 40 or below
Same process for PE with 2 approach as you like but in reverse form.
📊 75 High-Beta, Highly Liquid NSE Stocks
These stocks are liquid, fundamentally strong, and mostly traded in the F&O segment — giving you both flexibility and depth.
🚗 Auto
• Bajaj Auto
• Bosch Ltd
• Eicher Motors
• Hero Motocorp
• Maruti Suzuki
• TVS Motors
• Tata Motors
🏦 Banking & Financial Services
• Bank of Baroda
• Kotak Mahindra Bank
• Axis Bank
• ICICI Bank
• HDFC Bank
• IndusInd Bank
• Bajaj Finserv
• Bajaj Finance
• SBI
🧪 Chemicals
• Aarti Industries
• Atul Ltd
• Navin Fluorine
• UPL
• Tata Chemicals
🍫 FMCG
• Britannia Industries
• Godrej Consumer
• Tata Consumer
• DMart
• Hindustan Unilever
• Dabur
💊 Pharma & Healthcare
• Apollo Hospitals
• Alkem Labs
• Biocon
• Divis Labs
• Dr. Reddy’s
• IPCA Labs
• Laurus Labs
• Lupin
• Aurobindo Pharma
• Sun Pharma
• Cipla
💻 IT Sector
• HCL Technologies
• Infosys
• LTIMindtree
• TCS
• Tech Mahindra
• Wipro
⛓️ Steel & Metals
• APL Apollo Tubes
• JSW Steel
• Jindal Steel
• Tata Steel
• Hindalco
• L&T
🛢️ Oil & Gas
• Reliance Industries
• Gujarat Gas
• Indraprastha Gas (IGL)
• Mahanagar Gas (MGL)
• Tata Power
🏢 Realty
• DLF Ltd
• Godrej Properties
• Lodha (Macrotech Developers)
• Oberoi Realty
• Phoenix Mills
🛋️ Durables & Others
• Sona BLW (Sona Comstar)
• Amber Enterprises
• Bata India
• Crompton Greaves
• Dixon Technologies
• Titan Company
• ACC Cement
• Ambuja Cement
• Ultratech Cement
• Voltas Ltd
• Polycab India
• Mazagon Dock (Mazdock)
• Asian Paints
• Berger Paints
📝 Final Thoughts
This is not just a strategy — it’s a framework to reprogram your trading mindset. Use higher timeframes, respect structure, and focus only on high-probability setups. You’re not here for noise. You’re here for moves that matter.
If this helped you, prepare a trading journal based on this strategy. Stay focused. Be consistent. Trade less, but trade right.
Infosys strong bearish weekly candle !INFOSYS (INFY) – Weekly Ascending Triangle Breakdown | Trendline Retest & Deeper Support
CMP: ₹1,469.60 (as of Aug 1, 2025)
Infosys has broken below an ascending triangle pattern on the weekly timeframe. The upper resistance at ₹1,560 repeatedly rejected price, while higher lows built pressure from below. Eventually, price lost the rising trendline support around ₹1,500–₹1,510, signaling weakness.
The current move suggests a likely retest of the broken trendline. A rejection near ₹1,500–₹1,510 would confirm it as resistance, reinforcing bearish momentum. Immediate horizontal support lies at ₹1,450–₹1,430. A breakdown here may extend the fall toward ₹1,380.
However, there’s a long-term trendline from COVID lows (2020), now nearing ₹1,370–₹1,350. This area may offer strong support and could trigger a bounce, even if short-term structure remains weak.
Key Levels:
Resistance: ₹1,500–₹1,510 (retest zone)
Support: ₹1,450–₹1,430 (immediate), ₹1,380 (swing), ₹1,370–₹1,350 (long-term trendline)
Breakdown trigger: Weekly close < ₹1,430
Invalidates bearish setup: Close > ₹1,515
52W High: ₹2,006.80 | Drawdown: ~27%
Setup Summary:
Bearish bias post ascending triangle breakdown. Watching for rejection on retest near ₹1,510. Break of ₹1,430 opens path to ₹1,380, with possible bounce from ₹1,370–₹1,350 long-term trendline.
Swing & Positional Trading and Stock Options Setup _ High Beta✅ Final Setup for Positional and Swing Trades (High Beta Liquid Stocks for Cash and Options)
This trading guide outlines a simple and effective setup for both positional and swing trades, focused on high beta, highly liquid stocks. Follow the rules strictly for better consistency and profitability.
🔹 Positional Trade Setup
Chart Setup:
• Open the Monthly Chart of the stock.
• Add the RSI (Relative Strength Index) indicator.
• Uncheck all levels (30, 50, 70) and only keep one level at 60.
• Edit the level from 70 to 60 and highlight it in green.
Entry Criteria:
• Stock must cross the 60 RSI level on the monthly chart.
• Entry is only triggered if the price breaks the previous month's high.
Stop Loss:
• Place the initial stop loss below the previous month's low.
Trailing Stop Loss:
• Trail the stop loss to the current month’s low, but only after the monthly candle closes.
• Continue trailing the stop loss every month using this method until exit.
Exit Rule:
• Exit the positional trade only if the current month’s candle closes below the previous month’s low.
⚡ Note: The RSI 60+ setup is a powerful momentum strategy with high reward probability.
🔹 Swing Trade Setup
Precondition:
• Monthly RSI must cross above the 60 level.
• Switch to the Daily Chart of the stock.
• Entry Criteria:
• Identify the current swing high on the daily chart.
• Entry is triggered only when the stock breaks the swing high.
Stop Loss:
• Place the stop loss below the current swing low.
• If unsure how to mark swing low, then use a daily close below RSI 60 as your stop.
Trailing Stop Loss:
• If the trade moves in your favor, trail the stop loss to each day’s low.
Exit Rule:
• Exit the swing trade only if RSI crosses back below 60 with a daily candle close.
🔥 Stock Options Trading Strategy – Built on Core Swing/Positional Principles (75% Win Rate Setup)
I’m now sharing a Stock Options Trading Concept that follows the same core principles but is tailored specifically for liquid stock options.
For this strategy, you will strictly focus only on those High Beta Liquid Stocks provided below-
✅ Strategy Setup
🔹 Timeframe Filters:
• Monthly RSI > 60 (RSI has crossed and is holding above 60)
• Weekly RSI > 60 (same condition as above)
• Daily RSI: RSI must be crossing 60 or on the verge of crossing
Now, on the Daily Chart, mark the current swing high and swing low.
📌 Two Entry Approaches:
Approach 1: Breakout Entry
• Entry: When swing high is broken.
• Stop Loss (SL): Swing low or previous week’s low.
Approach 2: Pullback Entry
• Wait for a retracement from swing high (should not exceed 50% retracement).
• Confirmation of pullback weakness: Volume bars should be shrinking/decreasing.
• Entry: On breakout of the last candle high of the pullback.
• Stop Loss: Swing low or previous week’s low.
Once in the trade, trail your stop loss to cost after 3 consecutive bullish candles.
📤 Exit Rules
• Exit the Stock Options position only if the Daily RSI closses below 60 level.
⚠️ Important Guidelines for Stock Options
• 💡 Trade with only 1 lot. Never exceed your lot size.
• 📅 Enter after 2 days of the monthly expiry and exit before 2 days of next monthly expiry to avoid smart money manipulation.
• 🎯 Choose strike prices in multiples of 25, 50, 75, or 100 for better liquidity.
Example: If stock is at 1564, choose 1550 ITM or 1575 ATM.
• ⏱️ For quick exits, always place exit orders at round numbers like 5 or 10 levels.
• Example: If you entered at ₹70 and the option is at ₹144, place an exit at ₹140 or ₹145—not any random price.
For PE buying-
Monthly RSI < 40
Weekly RSI < 40
Daily RSi crossing 40 or below
Same process for PE with 2 approach as you like but in reverse form.
📊 75 High-Beta, Highly Liquid NSE Stocks
These stocks are liquid, fundamentally strong, and mostly traded in the F&O segment — giving you both flexibility and depth.
🚗 Auto
• Bajaj Auto
• Bosch Ltd
• Eicher Motors
• Hero Motocorp
• Maruti Suzuki
• TVS Motors
• Tata Motors
🏦 Banking & Financial Services
• Bank of Baroda
• Kotak Mahindra Bank
• Axis Bank
• ICICI Bank
• HDFC Bank
• IndusInd Bank
• Bajaj Finserv
• Bajaj Finance
• SBI
🧪 Chemicals
• Aarti Industries
• Atul Ltd
• Navin Fluorine
• UPL
• Tata Chemicals
🍫 FMCG
• Britannia Industries
• Godrej Consumer
• Tata Consumer
• DMart
• Hindustan Unilever
• Dabur
💊 Pharma & Healthcare
• Apollo Hospitals
• Alkem Labs
• Biocon
• Divis Labs
• Dr. Reddy’s
• IPCA Labs
• Laurus Labs
• Lupin
• Aurobindo Pharma
• Sun Pharma
• Cipla
💻 IT Sector
• HCL Technologies
• Infosys
• LTIMindtree
• TCS
• Tech Mahindra
• Wipro
⛓️ Steel & Metals
• APL Apollo Tubes
• JSW Steel
• Jindal Steel
• Tata Steel
• Hindalco
• L&T
🛢️ Oil & Gas
• Reliance Industries
• Gujarat Gas
• Indraprastha Gas (IGL)
• Mahanagar Gas (MGL)
• Tata Power
🏢 Realty
• DLF Ltd
• Godrej Properties
• Lodha (Macrotech Developers)
• Oberoi Realty
• Phoenix Mills
🛋️ Durables & Others
• Sona BLW (Sona Comstar)
• Amber Enterprises
• Bata India
• Crompton Greaves
• Dixon Technologies
• Titan Company
• ACC Cement
• Ambuja Cement
• Ultratech Cement
• Voltas Ltd
• Polycab India
• Mazagon Dock (Mazdock)
• Asian Paints
• Berger Paints
📝 Final Thoughts
This is not just a strategy — it’s a framework to reprogram your trading mindset. Use higher timeframes, respect structure, and focus only on high-probability setups. You’re not here for noise. You’re here for moves that matter.
If this helped you, prepare a trading journal based on this strategy. Stay focused. Be consistent. Trade less, but trade right.
Midcap and Small cap stocks are only used for Positional Trading Long Setup for longer periods ex 6 months to a year.
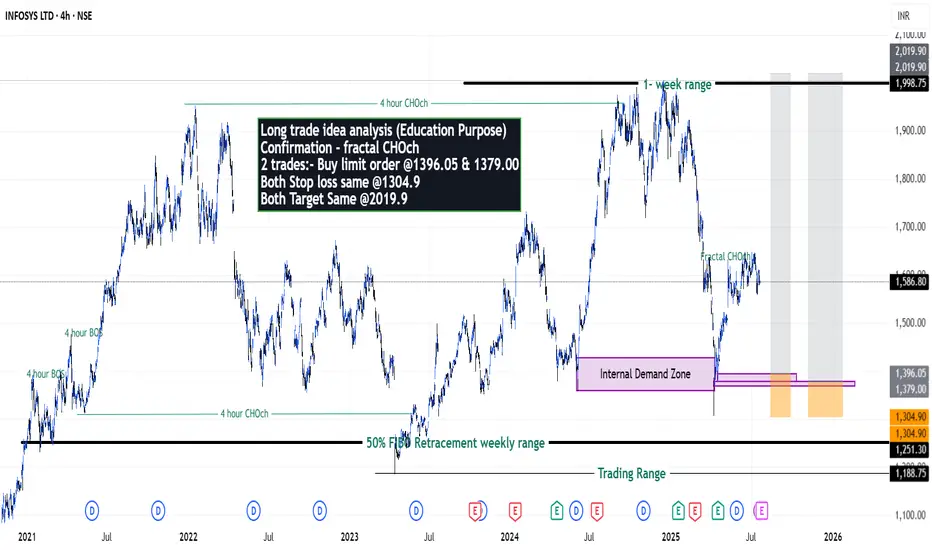
Infosys on getting ready for new high? - {20/07/2025}Educational Analysis says that Infosys (Indian Stock) may give trend Trading opportunities from this range, according to my technical analysis.
Broker - NA
So, my analysis is based on a top-down approach from weekly to trend range to internal trend range.
So my analysis comprises of two structures: 1) Break of structure on weekly range and 2) Trading Range to fill the remaining fair value gap
Let's see what this Stock brings to the table for us in the future.
DISCLAIMER:-
This is not an entry signal. THIS IS FOR EDUCATIONAL PURPOSES ONLY.
I HAVE NO CONCERNS WITH YOUR PROFITS OR LOSS on trades you take from my setup educated analysis.
My Analysis is:-
Short term trend may be go to the Internal demand zone.
Long term trend breaks the creates all time new high.
Long trade idea analysis (Education Purpose)
Confirmation - fractal CHOch
2 trades:- Buy limit order @1396.05 & 1379.00
Both Stop loss same @1304.9
Both Target Same @2019.9
Happy Trading,
Stocks & Commodities TradeAnalysis.
Gan Fan analysis of InfyGan Fan Line for infy the Gan Fan analysis for the infy has become so much important at this stage to make a long term decision watch the video till end

