IREN - when the band dont playBias: Cautiously bullish
Two trades:
Long call targeting $65–70.
Bull call spread (50/65) for cheaper, controlled risk.
Trade ideas

$IREN Fib projectionsNASDAQ:IREN has found support at the Fibonacci 1.0 level as well as the 55 EMA.
The next target to watch for is the 1.382 Fibonacci ratio, or potentially even the 1.618 Fibonacci extension.
So far, this could still be considered an ABC correction. However, if we surpass these targets in a five-wave downward movement, we might see even lower prices.
I do not currently hold a position in this stock, but I hope this information helps someone.

IREN - Strike while the Iren is hotIren is finishing a full correction cycle, as indicated by the A, B, C waves. Wave C is currently looking for the bottom. After wave C should come a fresh wave 1, or a wave X for an extended correction.
If it's a wave 1, the market is bullish. If it's a wave C, the market is bearish. Either way, Iren is a once in a life time stock. You'll rarely find others that have high long-term gains month over month.
The perfect time to get in is after wave C finishes sub 50. Strike while the iron is hot or you'll miss your chance.

TradeUSAsignals RecommendationsThe daily chart shows a strong upward trend controlled by Time traders (brown arrow), with a rebound from the lower boundary of the price channel.

IREN is breaking down of the channel.After months of climbing inside a clean ascending channel, price has now broken down from that structure and is pulling back toward the 𝗯𝗿𝗲𝗮𝗸𝗼𝘂𝘁 𝘇𝗼𝗻𝗲 𝗮𝗿𝗼𝘂𝗻𝗱 $𝟱𝟱.𝟳𝟬.
If the decline continues, the 𝗻𝗲𝘅𝘁 𝗺𝗮𝗷𝗼𝗿 𝘀𝘂𝗽𝗽𝗼𝗿𝘁 𝘀𝗶𝘁𝘀 𝗻𝗲𝗮𝗿 $𝟰𝟵, a level that could act as the reset point before momentum attempts to rebuild.

IREN / WeeklyNASDAQ:IREN — Technical Analysis (Weekly Chart)
As depicted in the Quantum Model, since early April, NASDAQ:IREN has advanced to Intermediate Wave (3) within a possible extension of Primary Wave ⓷, forming the top of Int. Wave (3) and consolidating within Intermediate Wave (4) over the past five weeks — potentially develops into a Triangle correction.
The projected target for this corrective phase lies near $50.63–$47.77 , positioned at the apex of the convergent equivalence lines and aligning with the 0.236–0.272 Fibonacci retracement zone.
Upon completion of Intermediate Wave (4), an impulsive extension into Int. Wave (5) could advance toward $431🎯, likely materializing by April 2026 — marking the 1.618 Fibonacci extension of the Leading Diagonal that formed Primary Wave ⓵.
📑The development of this Leading Diagonal in Primary Wave ⓵ — a potentially bullish structure originating in December 2022 — indicated an early-stage transition into a bullish accumulation phase. Such motive patterns often precede strong impulsive advances, reinforcing the broader bullish narrative as the trend unfolds at the Cycle degree.
🔖 It’s worth noting that the equivalence lines form a core component of my personal framework, which I apply through my Quantum Models methodology.
#MarketAnalysis #TechnicalAnalysis #ElliottWave #WaveAnalysis #TrendAnalysis #FibLevels #FinTwit #TradingView #Investing #IREN #IRENStock #TechStocks #DataCenter #AIDatacenter #BitcoinMining #HPC #CryptoMining #BTC #Bitcoin #BTCUSD CRYPTOCAP:BTC BITSTAMP:BTCUSD #RenewableEnergy NASDAQ:IREN

a bullish bet for year end?Similar to my idea about NBIS, this one use the Fibonnacci extension to bet on a uptrend EoY rally for IREN Energy. That 143$ level will do +130% uptrend for Dec 31st.
Can this occur?

IREN QuantSignals V3 Weekly 2025-11-09IREN QuantSignals V3 Weekly 2025-11-09
IREN Weekly Signal | 2025-11-09
• Direction: BUY CALLS | Confidence: 70%
• Expiry: 2025-11-14 (6 days)
• Strike Focus: $64.00
• Entry Range: $3.48
• Target 1: $5.22
• Stop Loss: $2.09
• Weekly Momentum: BULLISH (+3.13% 1W)
• Flow Intel: Bullish (Low P/C Ratio) | PCR 0.52
• ⚠️ MODERATE RISK WARNING: Consider reducing position size due to moderate confidence level.
⚖️ Compliance: Educational commentary for QS Premium members only. No financial advice.
🎯 TRADE RECOMMENDATION
Direction: BUY CALLS
Confidence: 70%
Conviction Level: MEDIUM
🧠 ANALYSIS SUMMARY
Katy AI Signal: NEUTRAL with price prediction showing early weakness followed by recovery to $68.18 target. Katy shows initial bearish pressure Monday-Tuesday turning bullish Wednesday-Friday with 7-9% upside potential.
Technical Analysis: Current price $63.61 trading above session open with 5.86% gain. Weekly momentum BULLISH +3.13%, VWAP $68.63 provides resistance target. Price at 64.2% of week range suggests room for upside.
News Sentiment: Mixed - Q1 results recently reported with analyst revisions. HC Wainwright maintains SELL but raised target to $56 (below current price). Stock dominating investor buzz indicates retail interest.
Options Flow: Bullish bias with Put/Call Ratio 0.52 indicating more call buying. Max volume at $54 call suggests institutional bullish positioning.
Risk Level: MODERATE - Katy's neutral confidence (50%) requires careful strike selection and tight risk management.
💰 TRADE SETUP
Expiry Date: 2025-11-14 (6 days)
Recommended Strike: $64.00
Entry Price: $3.48
Target 1: $5.22 (50% gain from entry)
Target 2: $6.96 (100% gain from entry)
Stop Loss: $2.09 (40% loss from entry)
Position Size: 3% of portfolio
⚡ COMPETITIVE EDGE
Why This Trade: Combines Katy's bullish recovery prediction with strong weekly momentum and bullish options flow. Ba
Image
QS Analyst
APP
— Yesterday at 10:20 PM
lanced delta (0.513) provides optimal risk/reward.
Timing Advantage: Entering early in weekly cycle allows capture of predicted Wednesday-Friday bullish move. Current price below VWAP provides upside potential.
Risk Mitigation: Conservative position sizing with clear technical levels for stop placement. Katy's $62.66 stop level provides additional confirmation.
🚨 IMPORTANT NOTES
Katy shows initial weakness Monday-Tuesday - consider scaling entry if early pullback occurs
Analyst sentiment mixed with SELL rating despite price target increase
Monitor early week price action for confirmation of bullish bias
Weekly options require active management - consider taking profits at Target 1
⚠️ KATY CONFLICT EXPLANATION: While Katy shows NEUTRAL overall trend, the detailed time series reveals a clear bullish recovery pattern from Wednesday onward with 7-9% upside. My analysis weighs this recovery trajectory more heavily than the initial neutral classification, supported by bullish weekly momentum and options flow.
📊 TRADE DETAILS 📊
🎯 Instrument: IREN
🔀 Direction: CALL (LONG)
🎯 Strike: 64.00
💵 Entry Price: 3.48
🎯 Profit Target: 5.22
🛑 Stop Loss: 2.09
📅 Expiry: 2025-11-14
📏 Size: 3.0
📈 Confidence: 70%
⏰ Entry Timing: N/A
🕒 Signal Time: 2025-11-09 01:20:55 EST
⚠️ MODERATE RISK WARNING: Consider reducing position size due to moderate confidence level.

$IREN 1. Executive Summary:
Iris Energy ( NASDAQ:IREN ) is exhibiting a constructive technical structure within a defined bullish trend observed on August 1st. The immediate catalyst is the company's recent earnings release, which typically induces significant volatility. The primary expectation is for a positive price movement; however, a retracement to a key support zone is a standard and healthy reaction post-event. The chart suggests the potential early-stage formation of a head and shoulders pattern, which is a bullish continuation signal in this context. Key Fibonacci retracement levels provide a clear roadmap for potential support at $59.94 (0.236), $49.47 (0.382), and $41.00 (0.50). A successful hold at these levels, coupled with strong market performance, could pave the way for a significant upward move, with a long-term target exceeding $80.
2. Market Context & Catalyst Analysis:
Prevailing Trend: The stock is operating within a broader bullish trend, indicating that the underlying market sentiment has been positive.
Earnings Catalyst: The earnings release on the same day is a fundamental catalyst that can override short-term technicals. The statement "we expect it to rise or hit the support zone" accurately captures the two most probable outcomes:
Bullish Reaction: The earnings report exceeds market expectations, fueling a direct price rise as new buyers enter.
"Buy the Rumor, Sell the News" Reaction: Even with good earnings, a short-term pullback to a key support level is common as traders take profits. This is not inherently bearish but rather a mechanism to build a stronger foundation for the next leg up.
3. Technical Pattern Analysis: Head and Shoulders
Clarification on Pattern Type: The mention of a "head and shoulders pattern" in a bull market likely refers to the Inverse Head and Shoulders pattern. This is a classic bullish reversal or continuation pattern.
Pattern Structure: It is characterized by three troughs: a left shoulder (decline), a deeper head (lower low), and a higher right shoulder, all formed at a support level. The pattern is confirmed when the price breaks above the "neckline" resistance.
Implication: The potential formation of this pattern aligns with the bullish thesis, suggesting that any current consolidation or pullback is likely a period of accumulation before a potential breakout.
4. Fibonacci Retracement & Strategic Support Levels:
The Fibonacci retracement tool, applied to the most recent significant upward wave, provides objective levels for potential buyer entry during a pullback.
Shallow Support (0.236 - $59.94): This is the first and strongest level of support. A bounce from here indicates very robust bullish momentum and suggests the pullback is merely a minor pause.
Moderate Support (0.382 - $49.47): A retracement to this level is considered a healthy and deep correction within a bull trend. It offers a potential high-probability entry point for buyers who missed the initial move.
Deep Support (0.50 - $41.00): This represents a 50% retracement of the prior up-move and is a critical "line in the sand" for the bullish trend. A failure to hold here would call the short-term bullish structure into question.
5. Price Projection & Risk Management:
Upside Target ($80+): The $80+ target is feasible if the stock successfully defends one of the key Fibonacci support levels and subsequently breaks above its recent highs (likely the "neckline" of the potential inverse Head and Shoulders pattern). This would project a measured move higher, potentially fueled by the positive earnings momentum.
Risk Management: The identified support levels ($59.94, $49.47, $41.00) also serve as logical areas for strategic stop-loss orders. A decisive break below the $41.00 (0.50) level, especially on high volume, would invalidate the immediate bullish setup and signal a potential for a deeper correction.
Conclusion:
In summary, the outlook for NASDAQ:IREN is bullish, supported by a positive earnings catalyst and a constructive technical chart showing a potential inverse Head and Shoulders formation. While a move higher is expected, a retracement to the Fibonacci support zone between $59.94 and $41.00 would be a normal and potentially opportunistic event. The bullish thesis, culminating in a run towards $80+, remains contingent upon the stock maintaining its core support structure and capitalizing on the positive fundamental news.

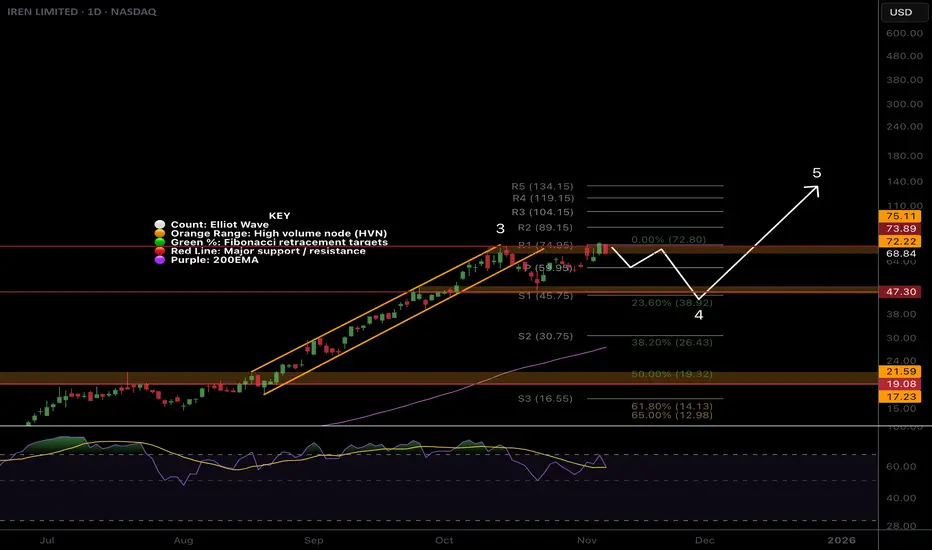
IREN pullback on the cardsNASDAQ:IREN is breaking out again on huge candle spread, though I am skeptical of continued rally from here without a pullback first. For now the trend is up.
Price has broken out of its momentum channel and formed a range so I am expecting the excitement to trap late comers and traders with a swift reversal in wave 4. Initial downside target is $47 at the High Volume Node and .0236 Fibonacci retracemenet. Stronger downside momentum could test the rising daily 200EMA at the 0.382 Fibs.
Daily RSI has printed unconfirmed bullish divergence at the EQ.
Continued upside keeps us looking at the pivot targets.
IREN 5M Short Conservative Trend DayTradeConservative Trend Trade
+ short impulse
+ unvolumed T2
+ resistance zone
- before 1/2 correction
+ strong approach
+ volumed 2Ut+
+ weak test
+ first bullish bar close entry
Calculated affordable virtual stop loss
1 to 2 R/R take profit within 5M range
Bought put
1D Trend
"- short balance
+ volumed T2
+ resistance zone
+ 1/2 correction
- strong approach
+ biggest volume 2Ut-"
1M CounterTrend
"- long impulse
+ volumed T1
+ resistance zone
+ weak approach
+ biggest volume Ut
+ test"
1Y CounterTrend
"- long impulse
= neutral zone
+ exhaustion volume?"

Breaking: Watch This REN Limited (NASDAQ: $IREN) Price LevelREN Limited (NASDAQ: NASDAQ:IREN ) saw a its stock price surge 5% in early Tuesday trading amidst positive fundamentals. The asset is up 2.44% as of the time of writing, with a bullish RSI of 65 making it poise for a move to the $100 resistant point.
Should the asset break the ceiling of the $72 resistant, a bullish campaign will envelope. Similarly, failure to pull that stunt could resort to a move to the 38.2 and 50 % Fib. retracement levels respectively.
In another news, REN (IREN) shares jumped to an all-time high Monday after the Australian Bitcoin miner and data center company said it inked a $9.7 billion deal with Microsoft (MSFT).
Shares of IREN were up over 8% near $66 in recent trading after reaching an intraday high of $75.73 earlier in the session. Shares of Microsoft were little changed.
The company said the deal would give Microsoft access to Nvidia (NVDA) chips in its data centers over five years. IREN also said it struck a deal to purchase related Nvidia chips and ancillary equipment from Dell Technologies (DELL) for about $5.8 billion.
IREN said it plans to pay for all the capital expenditures involved by “a combination of existing cash, customer prepayments, operating cashflows and additional financing initiatives.”
About IREN
IREN Limited operates in the vertically integrated data center business in Australia and Canada. The company owns and operates computing hardware, as well as electrical infrastructure and data centers. It also mines Bitcoin, a scarce digital asset that is created and transmitted through the operation of a peer-to-peer network of computers running the Bitcoin software.

IREN: MSFT pop fades—watch $56–58 support, $76 breakout lineBig picture: the Microsoft $9.7B/5-yr GPU cloud contract is a real validator, but the tape is still sorting through funding/margin math. Intraday we’re +6–7% around $64–65, well off the $75.7 high printed on the headline. That long upper wick says “sold-the-news / price discovery.”
Chart tells:
The $56–58 zone is the recent selling climax / LPS area from October. That’s now first support.
Resistance is the $74–76 supply shelf (multiple rejections). A daily close back above ~70 starts to absorb that supply; a clean breakout needs a strong candle through $76 on rising volume.
Volume ~57M today = genuine effort; RSI ~60 (room to run, not overbought). MACD is still below its signal but curling—bullish if it crosses up this week.
If we lose 63–64 into the close, expect a fade toward 60, then the $56–58 demand band. Hold that and the uptrend remains intact; lose it and you’re back inside the prior range.
Macro tape: BTC is -~2.7% on the day and UST 10Y is a touch higher (~4.12%). Slight headwind for anything “capex + risk,” but not thesis-breaking.
What the market is pricing right now: the contract proves demand; investors now want mechanics—deployment cadence, gross margin after power/PUE, prepay vs. debt mix, and any added equity. That’s why the pop faded: people are running the cash flow model, not just cheering the logo.
My near-term checklist (into and after earnings 11/6):
Funding slide – confirm the 20% prepay (~$1.9B), timing of the rest, and whether additional equity is needed (and how much).
Commencement cadence – 200MW (H1–H4) at Childress in 2026 is the anchor; Street wants quarterly MW that go from “booked -> live.”
Unit economics – price/GPU-hour, utilization targets, power cost/PUE; any guide to segment gross margin.
Backlog disclosure – if they frame this as contracted AI ARR with milestones, the multiple holds; if it’s “trust us, it’s coming,” expect chop.
Trading plan logic (not advice):
Bull path: strong close ≥ $70 → shot at a $76 breakout retest this week; clear it and measured move targets low-80s.
Base path: churn $60–70 while the street digests financing; constructive as long as $56–58 holds.
Bear path: close < $60 on heavy volume → likely revisit $56–58.
Bottom line: the logo is elite, but the stock now trades on execution math. Above $70 into earnings = momentum back; between $60–70 = healthy digestion; below $58 = respect risk until new buyers show up.

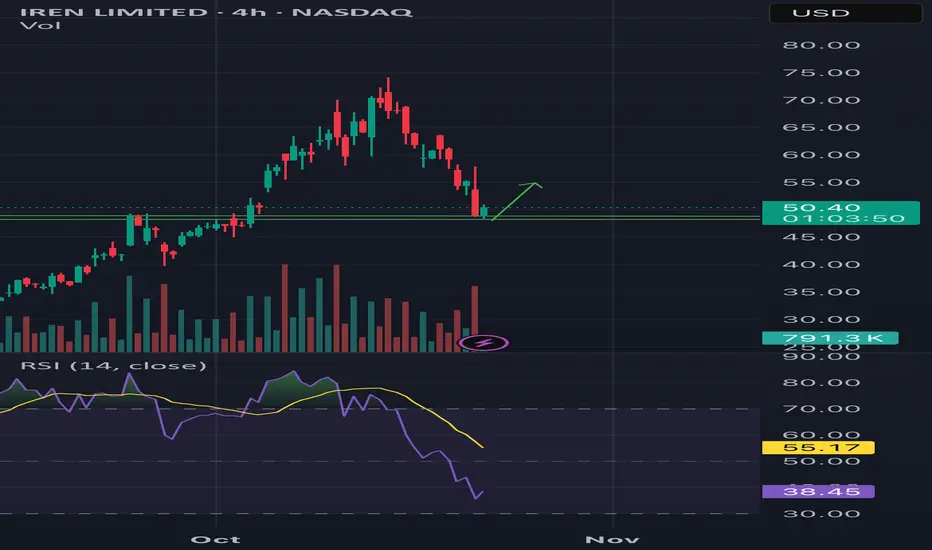
$IREN – First 20 SMA Retest + Flag Breakout SetupIris Energy ( NASDAQ:IREN ) is setting up a powerful flag breakout after its first real pullback of this entire move — and it’s happening right as crypto momentum heats up again.
🔹 The Setup:
After a strong rally from $50 → $75, NASDAQ:IREN pulled back in a controlled, low-volume correction.
Price undercut the 20 SMA, quickly reclaimed it, and now sits back above the 9 EMA — a perfect base reset.
Tight flag pattern forming, primed for expansion once momentum kicks in.
🔹 Crypto Sector Strength:
CRYPTOCAP:BTC and CRYPTOCAP:ETH both popped this weekend — that’s classic risk-on behavior.
The entire crypto stock basket is running hot, with leaders like NASDAQ:CIFR and NASDAQ:IREN showing clean technical setups.
This is the first 20 SMA test of the move — historically the most powerful retest in trending names, as late buyers finally get their chance to enter.
🔹 My Trade Plan:
1️⃣ Entry Zone: Watching dips Monday or Tuesday to build a position near the 9 EMA / 20 SMA zone.
2️⃣ If It Gaps Up: I’ll skip swing entries and just day trade the strength — no chasing.
3️⃣ Stop: Below the 20 SMA — tight, logical risk level.
Why I Like This Setup:
First 20 SMA test after a big run = high probability continuation.
Crypto momentum is back — strong sector correlation.
Technical structure is perfect: shallow pullback, rising EMAs, and a clear trigger.

IREN ready for pullback?Price has overextended in a macro wave 3, the strongest and most powerful move described as a “wonder to behold” by Ellioticians. Novice investors are likely to get over-confident in these conditions, enter without risk management and keep chasing price upwards only to be underwater when it turns around.
Profit taking appears to be taking place, I have closed my positions waiting for re-entry. The weekly pivots have been ran.
Initial downside targets for wave (4) is the 0.236 Fib retracement at $39 followed by the 0.382, $26.43. Expect shorts to pile in adding to any downside momentum.
In the long term we have higher to go towards $100 in wave (5).
🎯 Terminal target for the business cycle could see prices as high as $100 based on Fibonacci extensions
📈 Weekly RSI is oversold with no divergence and can remain here for months as price keeps increasing.
👉 Analysis is invalidated if we close back below the weekly 200EMA

IREN Wedge BreakNice wedge break, we should see continued movement upwards, especially if we break the upper resistance

IREN Exhausted? PUllback time?IREN wave (3) ran incredibly and I am looking for a deeper pullback as people begin to take profit. I have closed my positions at a 10x and am waiting for re-entry. The weekly pivots have been ran, RSI is at max overbought but can remain here for months (as it has done).
Initial downside targets for wave (4) is the 0.236 Fib retracement at $39 followed by the 0.382, $26.43. Expect shorts to pile in adding to any downside momentum.
In the long term I believe we have much higher to go towards $100 in wave (5).
Safe trading

Iren Going long here at support seems a good entry point I think it will pull back to around 60 level . Rsi is oversold I think it’s due for a pullback also some option activity suggest They are still bullish on Iren
IREN: Bounce Or Breakdown?Let’s talk about IRENs. The stock ripped from ~$28 in August to a climatic push into the high-$60s/low-$70s, then puked back to the mid-$50s. Volume expanded into the highs, MACD rolled, RSI slid from overbought into the 50s. That combo screams classic Wyckoff Buying Climax (BC) -> Automatic Reaction (AR). Translation: the first punch higher was real demand, the reversal was the “whoa, too hot” response, and now we’re in the proof zone where the market decides whether this was just a healthy reset or the start of topping.
Here’s the map I’m using.
First, the Fibonacci scaffold off the clean leg $28 -> $70:
38.2% pullback ≈ $54–$55 (where we’re testing now)
50% ≈ $49
61.8% ≈ $44
If bulls reassert and we eventually break the prior high, the measured pushes are 127.2% ≈ $81 and 161.8% ≈ $92 Why those levels matter: they line up eerily well with prior price congestion and the psychology of the move. $54–$55 is the first place you expect responsive buyers; lose it decisively and the tape usually wants the 50–61.8% magnet ($49, then $44).
Now layer in Wyckoff. After a BC/AR you usually get a Secondary Test (ST), a dip back toward the low on less volume that shows supply is tiring. If the stock can build a sideways re-accumulation range above support, you look for a Spring (a quick shakeout under the range lows) and a Sign Of Strength (SOS) back through the middle of the box. If, instead, each rally dies earlier and each dip carries farther on rising volume, you’re morphing into distribution (lower highs, heavier supply, and eventually a markdown).
Where is IREN on that spectrum? Right now we’re basically probing the AR floor around $54–$55. This is the spot where the character of volume and candles matter more than opinions. The candlestick tells to watch at this floor:
For the bullish read, you want a hammer, bullish engulfing, or a morning star sequence right around $54–$50, ideally on heavier volume than the prior red bars. That says dip buyers finally muscled control. For the bearish read, a long red marubozu, a gap-down that can’t fill, or a string of small-bodied candles with expanding downside volume says supply still has the wheel.
If we get the bullish tell, the Wyckoff script would be: ST or Spring into $54–$50, swift reclaim, then a churny build under $61–$62 (former support/now resistance). A powerful push through $61–$62 with volume is your first SOS. From there, the path is a retest, then push into the old high zone $68–$70. Clear the high with authority and the fib extensions $81 and $92 come into play over the following weeks/months.
If we get the bearish tell, the script flips: a decisive daily close below $54, followed by a weak bounce that fails under $57–$58, usually opens the slide to $49. If the tape knifes through $49 without a fight, that’s the textbook transition into markdown, where $44 becomes the next downside magnet and sentiment finally catches down to price.
A few tactical notes for traders (not advice, just how I think about risk):
Bullish swing plan: let price prove it. I like entries after a hammer/engulfing at $54–$50 and a reclaim of $61–$62 on solid volume. That keeps me out of knife-catch attempts and aligns with a Wyckoff SOS. My invalidation is simple: back below $54 on volume, I’m wrong on timing. Initial targets: $68–$70, then $81 if we break out.
Bearish swing plan: if we get a clean break and daily close < $54 with rising volume, I’ll respect the flow and look for $49 as the first cover zone, $44 if momentum accelerates. Invalidation = back above $58–$59 (failed breakdown/“spring against me”).
Neutral/accumulator plan: if you’re long-term bullish on the story but honest about tape risk, staggered bids in the $54–$50–$49–$44 ladder with room to add only on strength (reclaim of $61–$62) keeps you from blowing powder early. The key is not to average down blindly, add when the market confirms.
What about indicators? MACD already flipped from nose-bleed levels; that’s normal after a vertical. What I care about now is bullish divergence (price retests $54–$50 but MACD/RSI hold higher lows). If that shows up alongside a hammer day, that’s usually your tell the ST/Spring just happened. If, instead, RSI slices through 40 and lives there while volume expands on down days, the path of least resistance is lower until the next genuine selling climax.
Timeframes matter. Wyckoff ranges don’t resolve in two days. Even if $54 holds now, we may chop for weeks while the market refuels. That chop is your friend: it lets you read who is in control (shrinking red volume, successful tests of lows, rising supports) or who is unloading (heavier up-thrusts that fail, lower highs, expanding supply). Patience better than prediction.
TLDR: After a monster run, IREN is doing what strong stocks do, testing the first real floor. If buyers step up with the right candles and the right volume at the right level, the uptrend can resume and the fib extensions are on deck. If they don’t, gravity has a clean runway to $49 -> $44, where the next real fight will happen. Trade the reaction, not the narrative.

$IREN (Iris Energy Ltd.) Short-Term Bearish | Long-Term BullishTicker: NASDAQ:IREN (Iris Energy Ltd.)
Bias: Short-Term Bearish | Long-Term Bullish
Analysis Summary:
After a parabolic move from ~$8 to $64, IREN hit a major weekly supply zone and is showing signs of exhaustion. Volume has declined as price extended higher, while RSI formed a clear bearish divergence, suggesting momentum loss.
The current projection points to a mean reversion toward the $44–46 equilibrium zone, aligning with the 20EMA and prior structure break.
Macro & Fundamental Context:
IREN remains a leader in renewable-powered Bitcoin mining, benefiting from low operational costs.
However, with Bitcoin consolidating under $70K and Fed rates still near 5%, liquidity pressure and rising hash difficulty could weigh on margins.
Expansion continues, but valuation has likely priced in peak-cycle optimism.
Forecast:
🔻 Base Case (60%): Pullback to $44–46.
🔻 Bearish Case (30%): Deep correction to $32 support zone.
🔺 Bullish Case (10%): Break above $64 → next resistance $75+.
“Smart money is likely distributing here. Watch for equilibrium retest before next accumulation phase.”
📊 Not Financial Advice. Educational purpose only.
#IREN #Bitcoin #CryptoStocks #AITrading #WaverVanir #VolanXProtocol

IREn idea Un usual option volume flow 80 and 75 puts for 11/19 will do fine rsi is overbought i think this will retrace to 60 at least

IREN Wont Quit! Fib extension Analogue targets..NASDAQ:IREN Has ran all the weekly pivot in an astonishing wave III. RSI is extremely overbought.
The next Fibonacci extension targets (analogue scale) are the 3.618 at $59 and the 4.236 at $68 for a wave 3 termination.
Fibonacci log targets are as high as $400 but this seems unrealistic so switched to analogue in this case! Stranger things have happened still...
Safe trading

IREN pullbackWe can clearly see 50 is rejected, wait for a dip to get in. Also beware false breakout. AI centers need power and IREN is in the right place at the right time. However timing is everything. Put it on watch.
