$ISRG " The Road to 560+As you can see it is a reverse head and shoulder, although the whole deal with JNJ just happened ISRG is a great company and definitely a store guy IMO it has some big supports and resistances.
SHORT TERM SUPPORTS: $535/526
SHORT TERM RESISTANCES: $536.95 and 543 and $547
Needs to stay above $537 to go up
Trade ideas

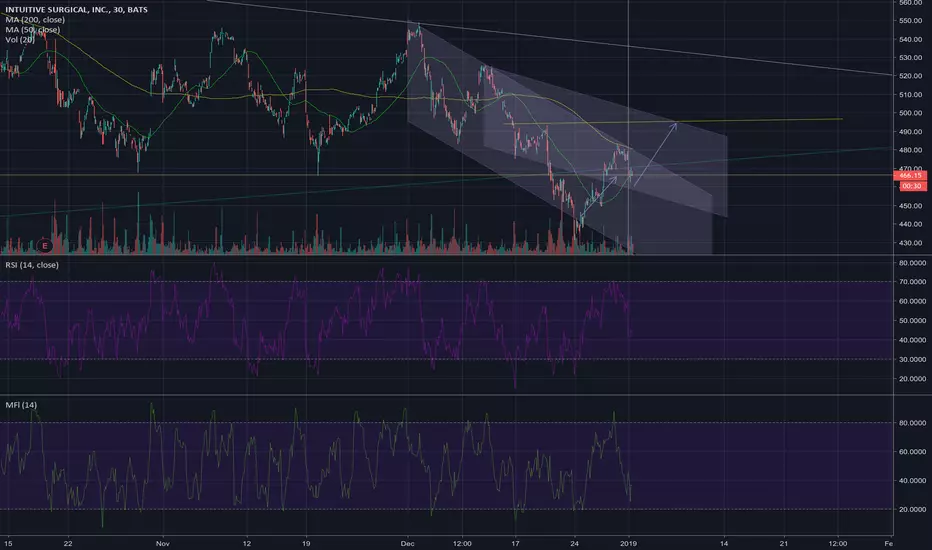
Inv H&S inceptionCheck the chart and you'll see no less than 5 diff H&S patterns going both ways in the past several months... Expecting this one to play out as well. The yellow line is the daily 200DMA, expecting this to retest that before moving back down in a mid-late jan selloff as the broader market retests the xmas lows. Risk is definitely to the upside on this trade tho so tread carefully and bail if indices cannot break its downward trend from dec in the next several days.
ISRG - Did you pay attention!As previously discussed if ISRG closed below the blue support line it should have been shorted. Now it is time to ride back up as it retraces. I believe this stock still has a lot to lose but learn to play both sides.

ISRG - Money Making Trade ApproachingISRG has been a reliable money maker on both sides of the game. If ISRG is looking to close below the blue support line I am looking to buy some PUTS, if it closes above I will buy some calls. Either or, watch this one close tomorrow. This is the perfect play for a swing trader.

ISRG: Topping Formation Risk for Selling Short PotentialIntuitive Surgical Inc., under the Medical Instruments and Supplies industry, has had strong growth over the past 3 years but it is now facing the risk of a topping formation. The topping pattern is near the phase where a completed top could occur and then downside action would include sell short professionals and sell short HFTs. Support doesn’t kick in strongly until the stock reaches the 240-250 area, which is below the 50% loss of most companies thus far in the bear market. Many firms have already lost 50% or more off their all-time high values. ISRG can shift sideways and stay there to pattern out the excessive speculation, but the technical pattern is setting up more like a risk of a top formation at this moment in time.

ISRG trading above 200dmaISRG is a growth machine over the last few years. The stock is still in a long-term uptrend as it is trading near the 200 dma.


ISRG Correction I looked at the 2 year history of ISRG and found that old trends are still prevalent in current ISRG Stock trends. Looking at the trend lines, it looks like ISRG is a little over bought right now. I predict that ISRG will hit a correction once it's between the red lines, then it will bounce at the floor between the green lines.

Just bought August put options on ISRG This company was just in a medical device documentary on Netflix that I would put on the same level as Blackfish.

ISRG long-term bullishAccumulation levels are increasing as the Health Care sector shows strength - this should support ISRG's shares long-term

ISRG Detected possible FDA clearance!!!ISRG: intuitive surg inc
2018-07-05 15:36:33
Detected possible FDA clearance


ISRG Swing Idea: Possible upside ~8% upsideMoving Averages: ISRG Recently touched its 50 ma twice, reacting bullishly to the indicator. The 20 Day MA also crossed under price, giving off another short term bullish signal.
MACD: The MACD indicator gave off a bullish signal on February 21st with the trendline crossing the moving average. The price action since then has confirmed the indicator, as the stock is up about 6%.
RSI: RSI (14) is showing increasing buying on the daily chart, after a sell off in December. This is showing that investors are slowly moving back into the stock with RSI rising from ~33 to ~63 where it lies today.
Trendlines: Trendlines are showing a break out from a short term triangle. This breakout is paired with consistent volume giving the stock a positive short term outlook.
Fib Levels:
138%: 475
100%: 450
62%: 424
38%: 408
0%: 381


$ISRG Bullish Ascending Triangle$ISRG Bullish Ascending Triangle - plenty of upside possible within upper channel limits. 535 possible in the medium-term. Monitor for strong break through 471.50 area.


$ISRG Post Earnings Breakout Continuation$ISRG breaking out post earnings. Met resistance at $458 1.27 Fibonacci line, then retraced back down to previous ATH around $450. After bouncing there and then breaking through the previous intraday high of $458, next target is 1.618 line or $476 in the near term. If we can break $476, the upper end of the long term channel will be the final target or ~$500 - possible by early May.

Looks like the Start of an upwards trend!Looking like an upwards trend is starting to develop; MACD just crossed, alligator is opening and moving averages are facing up.


