JDMID-TERM: Bounced off a historical support, broke out of a falling wedge, classic bullish divergence on RSI.
Trade ideas

Is it time to buy?The price has reached the upper limit of the trend forks. We are observing the final part of the correction. At the moment, the price has broken through the median of the trend forks, which means that it should at least test the lower boundary of the equilibrium channel area (61-60). I assume that the correction should end in the 55-50 area.

This only for public signal, anything just pm me thanks.This only for public signal, anything just pm me thanks.

JD, 6 Jan. Two buy levels.JD has lost a third of its value in just over a month. Let’s take a look if we can pick the stock up over the next days.
Elliott:
We are looking for a wave C with 5 sub-waves. We can count a completed 5-wave move to the downside now. Alternatively we expect one more wave to completion. These two interpretations give us two potential buy levels.
Geometry:
Price bounced at the lower boundary of the upward channel, which is the .5 fib mark of the downward facing channel.
Oscillators:
The RSI shows a bullish divergence. The Stochastic is oversold for over a month and due to move up.
How to trade it:
The two levels (green arrows) give us excellent risk-reward ratios to try long positions with tight stop losses. The lower level at 54 is more likely to hold when we expect an expanded flat correction. JD needs to re-gain the 21 day MA and hold it in order to further increase long exposure safely.

This only for public signal, anything just pm me thanks.This only for public signal, anything just pm me thanks.

JDPushing off from a daily support, broke out of a downward channel with retest of $69 area. Expected a move to the upside.

finally $jd break out after crack down with great balance sheetjd finally make the break out from downtrend line, mow is time to buy!
happy new year with health and gains!!
disclaimer


Pullback FishingJD is definitely having some issues, but I guess all of the China stocks have been volatile. It is like this group can not find a solid bottom.
This appears to be trading in a shark pattern and the landing pad can be the .886 or the 1.113. This hit the 1.113 of 0X today. Peak 2 is higher than peak 1 and there are no rules for the 2nd leg retracement for the shark except it can not go below 0. It is labeled 0XABC. The cypher is very similar, but the landing pad is the .786 of XC. It is labeled XABCD. There are rules for the retracement of the 2nd leg, but this is not a cypher.
No Recommendation.
The short term moving averages (alligator) look awful, and price is under all 4 longer term moving averages (20,50,100,200) which is often considered bearish. Price is below the bottom Bollinger band set on an 80 SMA which shows extreme selling pressure. Price does eventually return to the bands.
Negative volume is high which can show big money's interest.

JD , trading idea NASDAQ:JD
hello to all
this is my first time sharing something here :)
hope it be useful
and any one have any opinion or trading idea please share
please if you have something to share i will be thankful :)
============================================================================
I AM NOT A PROFISNAL : SO STUDY AND IF IT SUITS YOU DO IT ( IT IS YOUR OWN DESIGN )
============================================================================

Aiming for gap fill? With bullish cypherBullish Signs:
Large volume the last few candles showing bulls trying to stop the drop down below the 200 SMA on the daily.
Bullish divergence on MFI and Stochastic implies volume attempting to push it up
Market trend is leaning towards positive.
Completed bullish cypher pattern
Returned to the support of an ascending channel
Squeezing between 50 and the 200 SMA on the daily.
Also noticing a negative divergence however. I don't think it'll have the same strength to reach the top of the channel, maybe a gap fill. Would think the safest entry is after confirmation above the 50 SMA.

Cypher/BullishLong entry level 80.97 with an uptrend
Possible Cypher pattern as price did turn back up at the .786. Possible stop under the .886.
China stocks have been difficult as of late, although this one seems to do a bit better it seems and has not had as much flack some of the others have had.
Todays candle is a Bullish Harami.
Looks like resistance not far overhead.
No recommendation

JD ShortWith the news of DIDI listing, Im thinking there will be pressure on other China Tech stocks. Nice setup on JP.. Look to play this break and implied move or fill of gap..

JD's 'Hourly Purchase' Plan Boosts Dada Group's Revenue GrowthLooking ahead to the fourth quarter of 2021, Dada Group expects its total revenue, assuming Dada Express's Last-mile delivery services perform consistently, to grow from between 88% to 97% YoY.
On October 12, JD.com's 'hourly purchase' business, jointly created by JD.com and Dada Group, was officially launched. The merchant resources of JD Daojia can be connected to the 'nearby' entrance of JD's main website. After users place orders through the JD website, the later order delivery service will be completed by Dada Group.
Dada Group was founded in 2014 as a local instant retail and delivery platform. Dada Express is the local instant delivery platform of Dada Group, providing merchants and consumers with omnichannel fulfillment solutions and local instant delivery services integrating warehousing, picking and distribution.
At present, Dada Express has covered more than 2,300 counties, districts and cities in China, serving more than 1.4 million merchant users and 70 million individual users. Relying on the distribution of Dada Express and its massive retail partners, JD Express now provides consumers with a one-hour delivery service for products, including supermarket convenience, fresh fruits, vegetables, medicine, cake baking, flowers and other goods.

$JD with a Bullish outlook following its earnings #Stocks The PEAD projected a Bullish outlook for $JD after a Positive under reaction following its earnings release placing the stock in drift A.
If you would like to see the Drift for another stock please message us. Also click on the Like Button if this was useful and follow us or join us.
JD - ARC ENDING - UP OR DOWN?All,
JD looks like it's going to make a pretty sizeable move here. My honest guess is the downside. With that said I don't think they are a bad company by any means. Decent earnings etc. I just don't see the traffic/high level interest to really keep the momentum up. That being said I always plot both theories up and down so of course do your own DD. Like most of these plays I would do 1:1 puts/calls and drop the other when you have conformation.

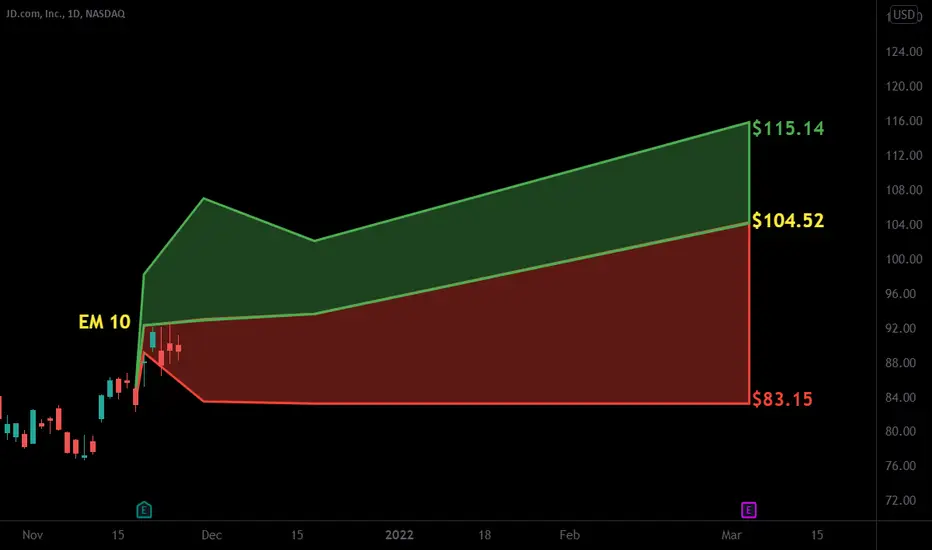
2nd Update: JD.com. Full Intraday Target Reached, Basically2nd Update: JD.com. Full intraday target reached, basically.
A few cents shy of the intraday target. (Target is top of green shaded area. Stop is bottom of red shaded area i.e the reward vs the risk). Suggested entry was the bottom of the candle (blue arrow), round about 20:30pm.
Gain: 1.48% or $1.31 before costs.
Original idea and 1st update attached.
In addition to this name, I'm also interested in other large caps on an intraday or short term basis, including Amazon, Netflix, Alibaba, Meta Platforms (fmr Facebook), US Banks, Boeing, Tesla etc.
Anything with range and liquidity makes for consistent opportunities.

UPDATE: Close JD.com For 70c Profit (Intraday Idea)Close JD.com For 70c or 0.79% Profit (Intraday Idea) ... Early close
I believe my intraday strategies are gaining traction...
Let's see how we can progress from here.
Original idea attached.

Intraday Trade Idea: Buy JD.Com - Gap FillFor intraday traders only.
Levels on the chart.
Last: $88.21

JD Buy - Strong momentum continues
Assigning a 80% of win rate for the next 20%+ return in near term (will judge if that's more to go until it reaches the point). It should hold until it is broken (below the curve). What is more encouraging is the meaningful breakthrough of the upward triangle as well (with trading volume on Nov 18 and Nov 19 moderately larger than the previous trading volume over the past few weeks).
In short, both the (i) cup and (ii) triangle pattern set-up with meaningful market trading volume suggest a near-term bullish signal/opportunity. Please check my previous chart analysis on JD as well.

JD Buy - Strong momentum continues
Assigning a 80% of win rate for the next 20%+ return in near term (will judge if that's more to go until it reaches the point). It should hold until it is broken (below the curve). What is more encouraging is the meaningful breakthrough of the upward triangle as well (with trading volume on Nov 18 and Nov 19 moderately larger than the previous trading volume over the past few weeks).
In short, both the (i) cup and (ii) triangle pattern set-up suggest a near-term bullish signal/opportunity. Please check my previous chart analysis on JD as well.

JD.com Analysis 19.11.2021Hello Traders,
welcome to this free and educational analysis.
I am going to explain where I think this asset is going to go over the next few days and weeks and where I would look for trading opportunities.
If you have any questions or suggestions which asset I should analyse tomorrow, please leave a comment below.
If you enjoyed this analysis, I would definitely appreciate it, if you smash that like button.
Thank you for watching and I will see you tomorrow!

