JD valuation is illogical.| Buying JD at $23, selling at $36. |
http://JD.com's "valuation is illogical, with the stock priced as if the company is going out of business soon"
"The discrepancy is quite perplexing. Pinduoduo with a market capitalization of $187.20BN realizes $6.22BN in operating income, while JD.com with a market capitalization of $36.54BN realizes $3.72BN in operating income."
seekingalpha.com
Trade ideas

$JD - FaceripperI think a JD faceripper is incoming. Stocks in the same sector like BABA and others will follow, but the main true driver will be JD itself. The media i think will attribute this all to BABA which will drive the frenzy even higher and everyone will become focused on BABA rather than JD.
Data:
imgur.com
I've opened a large position in JD as of last week.

JD.com Resurgence: Surpassing Expectations JD.com (NASDAQ: NASDAQ:JD ), the Chinese e-commerce giant, has emerged victorious in the face of economic headwinds, defying expectations with impressive fourth-quarter revenue figures that have ignited a surge in investor confidence. With shares soaring 15% , JD.com's strategic maneuvers and resilience in a challenging market landscape have captured the attention of analysts and stakeholders alike.
The company's success in the final quarter of 2023, buoyed by aggressive price cuts and heavy discounts during China's renowned Singles Day shopping festival, underscores its ability to adapt and thrive amidst economic turbulence. Despite China's shaky economic growth and concerns surrounding youth unemployment and stagnant wages, JD.com's ( NASDAQ:JD ) innovative approach to stimulating consumer demand has yielded remarkable results.
Chief Executive Sandy Xu Ran's announcement of plans to expand JD.com's international presence marks a pivotal moment in the company's trajectory. With a keen focus on supply chain optimization, JD.com ( NASDAQ:JD ) aims to establish itself as a global powerhouse, leveraging its distinct business model and competitive advantages to penetrate new markets.
The prospect of JD.com's ( NASDAQ:JD ) potential acquisition of UK electronics retailer Currys further underscores its commitment to international expansion. As the company seeks to diversify its revenue streams and mitigate risks associated with domestic market fluctuations, analysts anticipate a strategic move that could bolster JD.com's ( NASDAQ:JD ) global footprint and drive long-term growth.
JD.com's ( NASDAQ:JD ) stellar quarterly performance, with net revenue surpassing analyst estimates at 306.1 billion yuan ($42.52 billion), reflects its enduring popularity among cost-conscious consumers. Despite concerns stemming from an internal audit of its Dada Nexus unit, JD.com's overall revenue remains robust, alleviating investor apprehensions and reaffirming confidence in the company's resilience.
Moreover, JD.com's ( NASDAQ:JD ) announcement of a $3 billion share repurchase program underscores its commitment to enhancing shareholder value and capitalizing on market opportunities. With its U.S.-listed shares experiencing a recent downturn, JD.com's proactive measures signal a strategic pivot towards revitalizing investor sentiment and unlocking future growth potential.
As JD.com ( NASDAQ:JD ) reports a net income attributable to shareholders of 3.4 billion yuan, marking a significant increase from the previous year, the company's trajectory appears poised for further success. With a steadfast focus on innovation, expansion, and shareholder value, JD.com ( NASDAQ:JD ) continues to navigate the complexities of the global market with confidence and determination.

Going Global JD.Comnever seen this chart before, dont know anything about them other than their success may be helpful for BABA. green targets to the upside, red to the down. interested to see how this one plays out. im bullish on this one tho $

Bottom BuildingWithin a Fibonacci support zone we are building a bottom since January 17th.
As the decline is old already and the Chinese economy is not as unhealthy as, say, the European ones I expect a breakout of the range within the next few days with an end of the downtrend.

JD.com - BUY!The two largest stock holdings of Michael Burry today (2/14/24) are Alibaba and JD.com. Both of these companies I have personally been accumulating for two months now with an auto invest feature on my brokerage account.
I believe that it could take time for these charts to turn around but the discount on these stocks are undeniable. It is worth checking out and at least consider investing.
Ill be sure to update this post every couple of months!
Good luck!!!

JD stock price is even cheaper than it looksStock prices alone dont tell the entire story.
stock prices just represent the equity portion of ownership. Debt holders are also a form of owners who can collect at liquidation before shareholders in the worst case scenario.
The opposite of debt liabilities is excess cash on the balance sheet.
While debt would make a balance sheet look worse, cash does the opposite.
JD has excess cash on the balance sheet. 33b in cash vs 9.57b in debt.
The extra cash makes the stock price even cheaper than it looks.
JD isnt the only one. There are other Chinese stocks with attractive balance sheets and beaten up prices. The current slowdown and sell off has crushed most of Chinese stocks. There is real geopolitical and economic risk right now in china. But the lesson here is learning to read the financials and using this information in decision making.
When looking at stocks, dont ignore the balance sheet. You will find hidden treasure sometimes, and other times you may find rot to avoid.

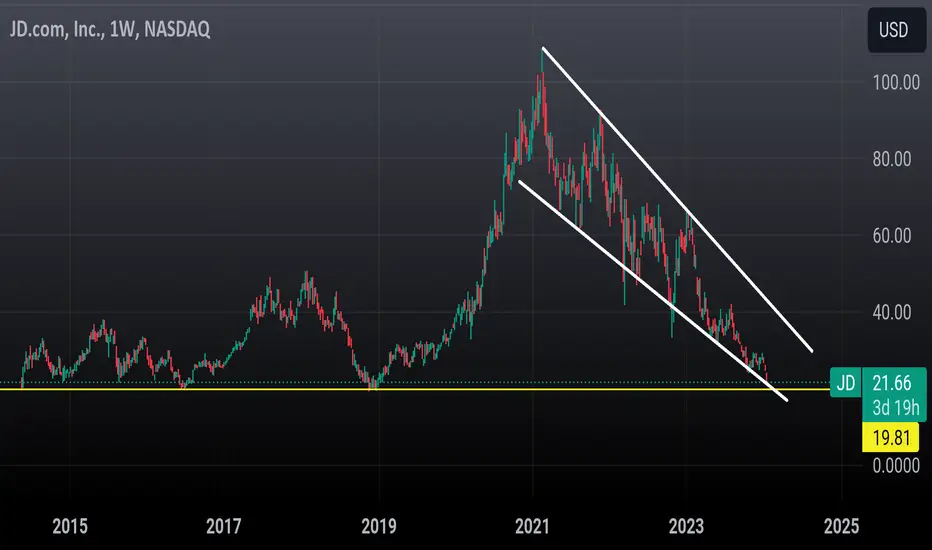
JD.comLong term investment idea here..
J.D almost nearing IPO price at 19.90 or 10yr support
Over the next 2 years, i think the technicals are there for a retracement to .618 fib or 53$
JD and Bidu are near key fundamental values- tangible bookTangible book value is the total of all physical assets minus liabilities. Its useful as a potential support level because this value is shows whats on the accounting books and implies what the liquidation value of a company might be if all things go sour. Its not a perfect value for liquidation because the market price of assets may actually vary from what the book value shows.
Jd and Bidu are chinese stocks that could be trading near support or will have limited downside based on the the value of tangible book assets net of debt. Falling below this value would mean that the stock is trading below the value of the assets inside the company.
Capital intensive companies are companies sensitive to economic cycles can trade above or below this level depending on the markets risk appetite or perception of future conditions. Auto manufacturers and banks are examples of companies that tend to trade near and around tangible book value. They trade above in good times, and below in bad times.
Chinese stocks are currently deep into a downtrend, so will be interesting to cherry pick opportunities that may become de risked or deep value.
If tangible book value fails to hold, the next significant metric could be net current assets which is a more conservative balance sheet figure of very liquid assets on the books.
Trading view it makes it easy to tracks these metrics as overlays on a chart. Definitively worth having for a quick look at balance sheet metrics.
enjoy.

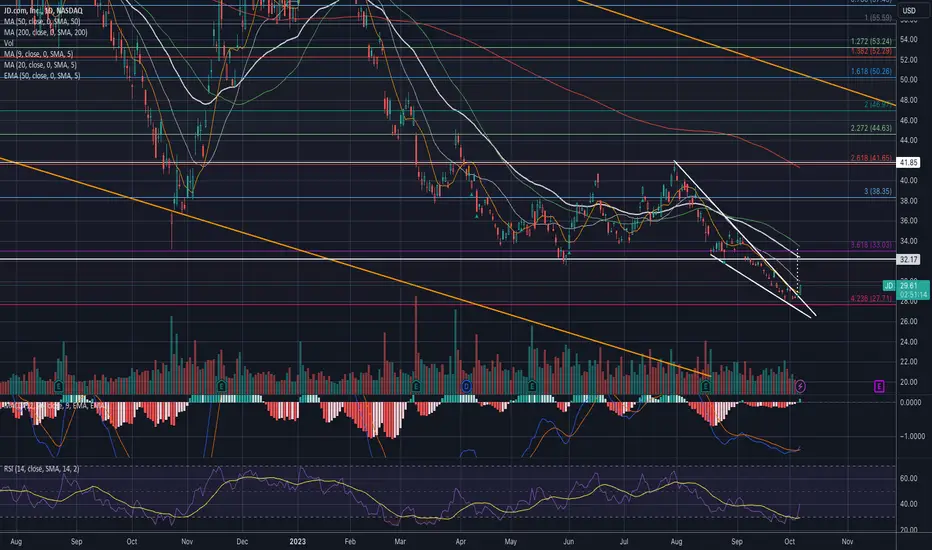
$JD Potential Reversal: 2-Day DB, Descending Broadening WedgeOverview:
JD
(JD.com Inc.) appears to be forming a compelling technical pattern that suggests a potential reversal. The stock has developed a 2-day double bottom pattern, coinciding with a falling wedge setup, all occurring within the confines of a major descending broadening formation. Traders and investors should closely monitor these key technical levels for potential bullish momentum.
Key Technical Observations:
Double Bottom Pattern:
JD
has established a clear double bottom pattern over the past two days, a classic reversal formation characterized by two distinct lows at approximately the same price level.
The first low was set , followed by a second low , forming a W-shaped pattern.
Falling Wedge Formation:
A falling wedge is currently in play, with converging trendlines forming lower highs and lower lows.
Falling wedges are often indicative of slowing bearish momentum, and a breakout to the upside could signal a reversal.
Descending Broadening Formation:
The overall context involves a major descending broadening formation, marked by expanding price volatility within a downward trend.
This formation could imply a period of uncertainty and potential for a reversal as the pattern reaches its apex.
Potential Trading Strategies:
Entry Points:
Conservative traders may consider entering long positions upon a confirmed breakout above the upper trendline of the falling wedge.
Aggressive traders might explore entry opportunities near the lower trendline, anticipating a bounce within the descending broadening formation.
Stop-Loss and Take-Profit Levels:
Establish a stop-loss level below the recent double bottom, ensuring protection against a potential breakdown.
Identify potential resistance levels within the descending broadening formation as initial take-profit targets.
Confirmation Signals:
Confirm the bullish reversal with increased volume on the breakout from the falling wedge.
Use additional technical indicators, such as RSI and MACD, to validate the strength of the potential reversal.
Risk Considerations:
Trading involves inherent risks, and it's essential to manage risk effectively. Be cautious of false breakouts and monitor market developments closely.
Disclaimer:
This analysis is for informational purposes only and should not be considered as financial advice. Always conduct thorough research and consult with a qualified financial professional before making trading decisions.

$JD Potential Reversal: 2-Day DB, Descending Broadening WedgeOverview:
NASDAQ:JD (JD.com Inc.) appears to be forming a compelling technical pattern that suggests a potential reversal. The stock has developed a 2-day double bottom pattern, coinciding with a falling wedge setup, all occurring within the confines of a major descending broadening formation. Traders and investors should closely monitor these key technical levels for potential bullish momentum.
Key Technical Observations:
Double Bottom Pattern:
NASDAQ:JD has established a clear double bottom pattern over the past two days, a classic reversal formation characterized by two distinct lows at approximately the same price level.
The first low was set , followed by a second low , forming a W-shaped pattern.
Falling Wedge Formation:
A falling wedge is currently in play, with converging trendlines forming lower highs and lower lows.
Falling wedges are often indicative of slowing bearish momentum, and a breakout to the upside could signal a reversal.
Descending Broadening Formation:
The overall context involves a major descending broadening formation, marked by expanding price volatility within a downward trend.
This formation could imply a period of uncertainty and potential for a reversal as the pattern reaches its apex.
Potential Trading Strategies:
Entry Points:
Conservative traders may consider entering long positions upon a confirmed breakout above the upper trendline of the falling wedge.
Aggressive traders might explore entry opportunities near the lower trendline, anticipating a bounce within the descending broadening formation.
Stop-Loss and Take-Profit Levels:
Establish a stop-loss level below the recent double bottom, ensuring protection against a potential breakdown.
Identify potential resistance levels within the descending broadening formation as initial take-profit targets.
Confirmation Signals:
Confirm the bullish reversal with increased volume on the breakout from the falling wedge.
Use additional technical indicators, such as RSI and MACD, to validate the strength of the potential reversal.
Risk Considerations:
Trading involves inherent risks, and it's essential to manage risk effectively. Be cautious of false breakouts and monitor market developments closely.
Disclaimer:
This analysis is for informational purposes only and should not be considered as financial advice. Always conduct thorough research and consult with a qualified financial professional before making trading decisions.

JD.C0mDespite the exposure of a weakening Chinese consumer market, JD.Com has the potential to benefit during the festive season as people increase their spending behavior. We are anticipating a better-than-expected earnings report for Q4.
The stock is not far from its IPO price of $19.00. The current price is still a good discount.

Has JD come down far enough?Multiple bounces on or near this point looking at the weekly. Technical analysis barring any massive projected market crash, time to go Long? Whaddya think?

JD.com - wait for a tripple bottomhi traders
JD.com looks very bearish.
Longing now is a gamble.
If you want to long JD, wait for a tripple bottom on the weekly time frame.
Entry, target and stop loss are shown on the chart.
Make a note that this trading idea is based SOLELY on the technical analysis.
We didn't take into an account any fundamental factors.

#JD#Comprehensive Analysis of JD.com, Inc. (JD)
1. Current Status and Performance 📈
As of the most recent data,Over the past 12 months, JD has returned -46.48%, underperforming the SPY's performance of 13.09%. This performance has earned it a B (67.59%) for its Overall Grade.
2. Financials 💰
JD.com's financials reveal a revenue per share of 683.4432 and a net income per share of 15.1511. The operating cash flow per share stands at 37.1581, while the free cash flow per share is 27.0773. The company's cash per share is 154.2176, and the book value per share is 146.4167. The company's debt to equity ratio is 0.3036, indicating a moderate level of debt relative to equity.
3. News and Market Sentiment 📰
Recent news stories suggest a mixed outlook for JD.com. Over the past three months, 13 analysts have given JD.com a 12-month average price target of $42.15, down 13.98% from the previous $49.00. Most analysts were indifferent, with five bullish and one somewhat bullish, while none were bearish.
4. Earnings Report 💵
JD.com is expected to report an EPS of 0.63 and an unspecified amount in revenue on 2024-03-14. In its Q3 2023 earnings conference call, JD.com highlighted its commitment to improving user experience and its successful Singles Day Grand Promotion. The company reported a higher core gross merchandise volume (GMV) growth rate than total retail sales of consumer goods, accelerated expansion of active merchants, and user shopping from third-party merchants growing faster than total users. With the recovery of China's economy, JD.com expects consumer spending to drive economic growth next year. The company also plans to balance growth and profitability and anticipates high-quality business growth next year.
5. Future Outlook 🚀
JD International Limited, a development stage company, filed its Form 10-Q with the SEC for the period ending June 30, 2015. The company reported no operating revenue, a working capital deficit of $208,486, and uncertainty in its ability to raise additional funds. The company is seeking a business opportunity through acquisition or merger. Its disclosure controls and procedures were ineffective, and there were no changes in its internal control over financial reporting. No legal proceedings or defaults upon senior securities were reported.
6. Conclusion 🎓
JD.com appears to be in a challenging position, with a decrease in total comprehensive income and earnings per share in fiscal year 2023 compared to the previous two years. However, the company has various stock plans, pension plans, and other benefit plans. They have long-term debt and credit facilities available. JD.com has appointed KPMG LLP as their independent accounting firm and their financial statements show an increase in net sales. The company has made acquisitions and divestitures, incurred restructuring costs, and has investments in joint ventures. They manage market risks through derivatives and disclose information about leases and the carrying values of assets. Despite potential inflationary risks, the company feels confident in its ability to navigate these due to its increased agility. As with any investment, it's crucial to consider all factors and conduct thorough research before making a decision. It's also important to consider your own investment goals and risk tolerance.

Bullish Swing trade on JD. Instant BUY!Please review this video and see why I think that SKILLING:US100 : JD could be a massive money-printing machine! Thank you as always for checking out my analysis and have a beautiful week!

$JD - Could see a reversalNASDAQ:JD could see a reversal. It broke out of a descending wedge. RSI exited oversold and MACD did a bullish cross.
Upside targets:
$33
$38
$41
Downside risk:
$27
I am long here, bullish div on macdHarmonic is roughly completed, looks like it may get frontrun due to rest of market recovering.

Keep shorting until $25JD is still in a downtrend and headed down to $25 and I would not exclude a sharper drop to $20.

JD Unpopular OpinionHuge laggard in China. Even JD looks like it wants to move higher before lower. I think JD will be the alarm bell for China equities to finally move higher, as even the laggard is showing resistance to selling pressure as of now.
Baba, PDD, Baidu, KWEB, CQQQ all look pretty decent, but JD needs to finally push higher to confirm a good trend for China stocks

$JD - Expecting a reversalNASDAQ:JD is trading around $32 which is the same as 2014 price level.
Reported Revenue EPS
Q2 Aug 2014 $4.61B. 73 cents/share Loss
Q2 Aug 2023 $39.69B. 59 cents/share Profit
Does this make sense? I am expecting a reversal here.

JD - Washing The Stops Out First?A follower asked to chart JD.com
And since it's Sunday and I'm sipping my fresh brewed coffee from my "La Pavoni" Espresso Machine, I have time to help out a buddy in the Trading Space.
Here we go:
The Monthly (Daily will follow below) Chart is nice and orderly. It has a good Base. And we also see where the last bunch of buyers where from 2019 to 2020.
JD had it's shiny days when it went up to P0.
From there the clouds began to darken. It was, and still is on the path down to a potential P5, which is not achieved yet.
So, that would mean a break of the Base?
Yes!
But, what about the Last Real Buyers (Green Box)?
Put it in perspective. These old buyers had the Job to not let the Stock go down anymore, but to encourage the CROWD to buy more. Big boys where already loaded there...
Any other ideas why a break of the Base and a Wash of the Stop/Loss orders could happen?
Yes.
1. If I where one of the Whales who's behind JD.com, I would want to buy low and sell high. So, my advice to the Market Maker would be to take out all the Stop/Loss orders, sitting below the Base. Throw the final Max. Pain to all HODLERs of JD and prove their bravery.
And then, when everyone and their Mothers throw the towel, I would pick them all up...of course for a very low price.
Please, if you have JD in your portfolio, don't hate me for this. I just throw out my thoughts and tell about my experience. I love you §8-)
Is there more...?
Sure:
2. The Fork
The red Pitchfork projects the most probable path of price. That's the nature of the Andrews Pitchfork. And it does it very well as we see.
Until price has climbed above the U-MLH (The Upper-Medianline-Parallel) there is absolutely no intention that JD will start to stop from falling.
So there we have it.
Can we build a plan to buy out of this information?
Why not:
Wait for the wash.
Wait for something important that shouts in your face.
Then start to gather the facts together that give you many good reasons to buy JD for the long term and make a killing in the next Pump. For example:
1. Wash is over
2. Price climbed above the Base again
3. Price is above the U-MLH
4. The earth did not end despite the climate activists predicting it for the 48th time and the Christmas Tree didn't burn down last year §8-)
Wish you all a happy Sunday and - Go get your free ForkTrading-BLUEPRINT on my website.
T8N3

JD, Inverse Head and Shoulder's PatternJD, Fair value on this company is arguably much higher in the $80-90 range.
RSI showing strength as price bases out.
Inverse head and shoulders pattern.
MACD sloping up.
A confirmed break with high volume of $40 should signal a continuation move higher.
