Trade ideas

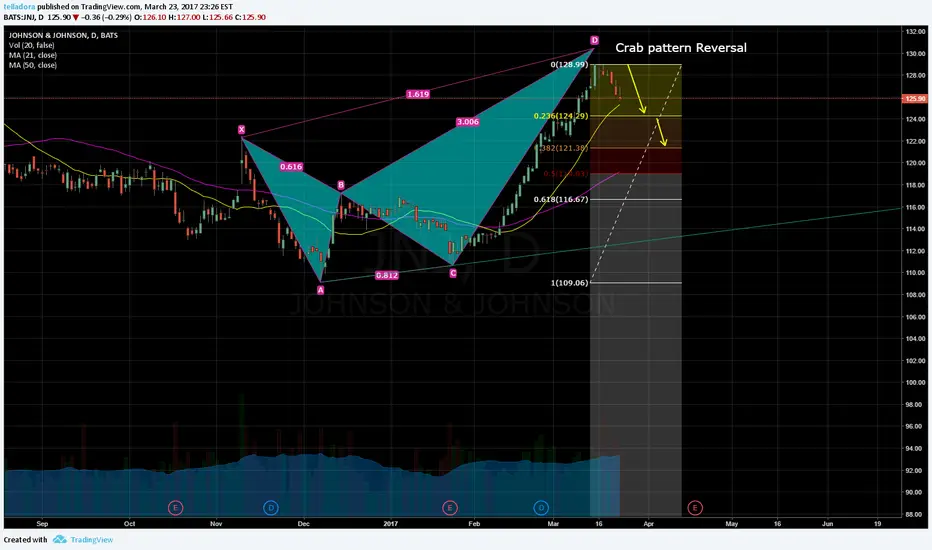
JNJ Crab Reversal JNJ reversing off of Crab pattern. It is hovering over the pervious high of 125.9. If it breaks further, next stops would be 20 MA, -> 0.382 retracement and then 50 MA
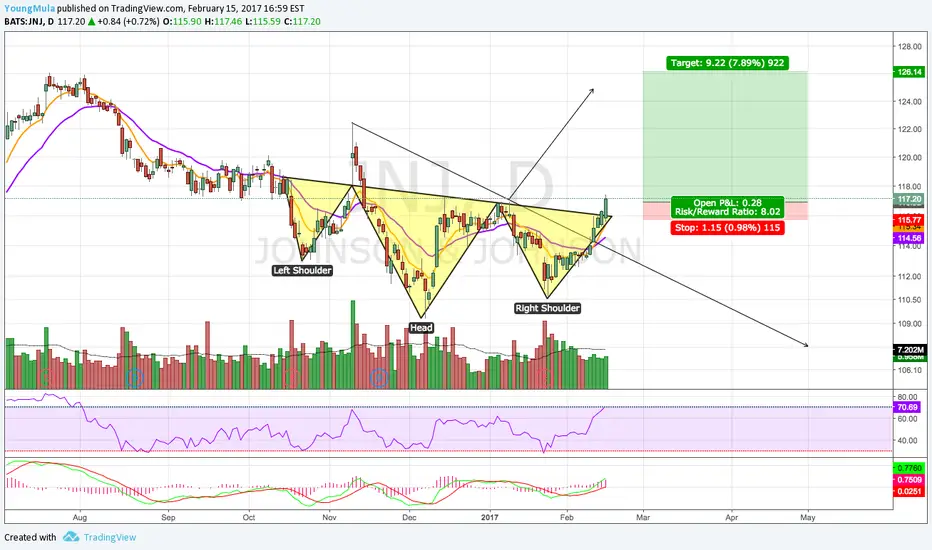

Double Top Resistance Approaching Quickly On $JNJ.Healthcare products maker Johnson & Johnson (NYSE:JNJ) is nearing a double top resistance point on the stock chart. The level is $126 and is the former all-time high on the stock from July 2016. A double top on the stock chart is a technical term that tells investors there will be heavy selling at that point. It likely will be tough for Johnson & Johnson to go higher in the near-term. Often, investors and traders will sell double tops short, profiting when the stock pulls back. That is what I will be looking to do if Johnson & Johnson hits double top this week. The stock has run too far, too fast in the last few weeks. In the last month, Johnson & Johnson is up from $111 to $124. For this historically slow moving stock, that is insane.
Follow my trades live right here: verifiedinvesting.com


Johnson & Johnson (JNJ)The acquisition of Actelion for 30 mld dollars is a good strike, the EPS for the 2017 are at 6.60 dollars (1.65 dollars for quarter), this equity has a good yield and bright dividend growth prospects. In our view we think that it is a buy stock, with an interesting dividend yeld of 2.85%

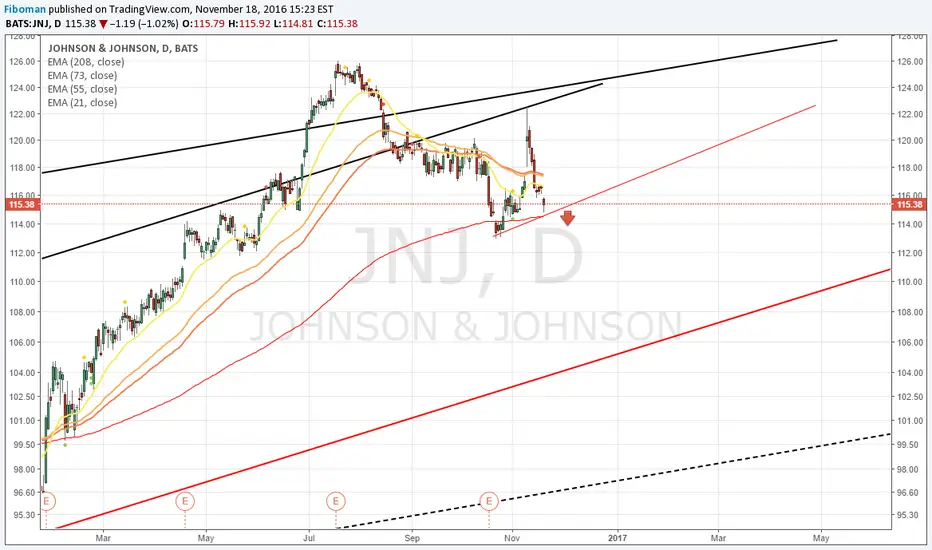
JNJ @ daily @ closed last 6 trading days lower every dayThis is only a trading capability - no recommendation !!!
Buying/Selling or even only watching is always your own responsibility ...
.zip (with PDF`s) @ my Google Drive
Closings Bearish (Dow Jones Index incl. all shares)
drive.google.com
Best regards :)
Aaron


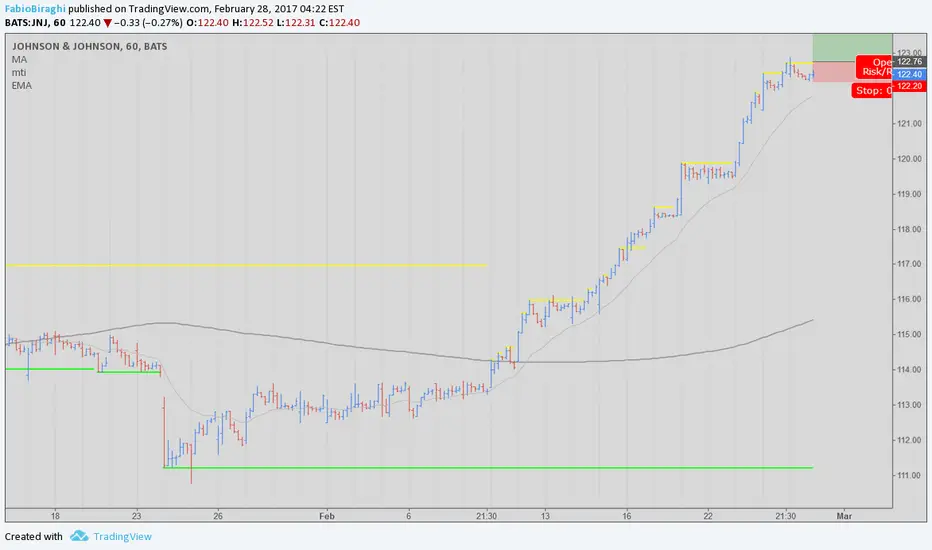
Potential repeating trade pattern on JNJTRADE IDEA: Look for a repeat of Pattern 1. With strong support underneath, wait for the break to the upside, and buy on a retrace.

Johnson&Johnson seen lower in the coming weeksThere is no real change in the dominant bear trend, as prices pressure $110.00.
Stochastics and sentiment continue to weaken, highlighting further downside risks into the coming weeks.
In tandem, Healthcare is also weakening and, along with JNJ, further underperformance relative to the SP500 Index is highlighted.


No more soap, baby! - Sell Johnson & Johnson mid-term setupBased on RSI34 weekly div and final trend line breakout look forward for further downside price action to 80-100 levels.
No more soap, baby! - Sell Johnson & Johnson mid-term setup

JNJ short...I am taking a short JNJ trade set up. Monthly is bullish. No sign of topping yet except we can see price is pulling back. Weekly is at resistance of Kijun and prices are consolidating under. Daily is bearish and once this support gives me we can tag 200 sma and possibly lower at highlighted support. Earning are next week. Trade carefully

JNJ looks convincing !!Trend line support
with confluence of Kijunsen
Indicating end of correction in primary uptrend supported by bullish hidden divergence in RSI.
