$JNJ with a Bullish outlook following its earnings #Stocks The PEAD projected a Bullish outlook for $JNJ after a Positive over reaction following its earnings release placing the stock in drift B with an expected accuracy of 50%.
Trade ideas

$JNJ: Heartline Rejection Targeting 38.2%-61.8% RetraceJohnson & Johnson has rejected the Heartline of the Equidistant Channel while showing Bearish Divergence on the MACD and RSI and as a result i now think it will be heading for a minimum .382-.618 Retrace and i will be playing it via monthly put options.

rttghtertrgretgyrr55rythrthtrhthrrthrthyyr56y56y5y445y5y45y5454y54yy455y45yy5y5y5y45y5yrthrththrthrtrhrthrth

JNJ Rising Wedge Break + Fib LevelHas broken to the downside, the initial moves retracement looks to be done, setting up for another leg down.


JNJ A PEDIDO DE MIGUELwww.economiaendigerido.com.ar
Análisis de JNJ para Miguel. Pedime activos y los vemos.

Definitely don’t want to invest in..Sorry but a company responsible for the opioid pandemic is probably not on my investment list for sure pretty much a legal drug lord in my opinion how do not have records of how much drugs you make sounds a little fishy

Johnson & JohnsonFalling Wedge Pattern Breakout and Retest
Formation of HH and HL
Support from 61% fib retracement
Entry after formation of HL (176.34)
Trade with specified Stop Loss
TP levels are specified
Ride the trend with trailing stop Loss
Manage your risk accordingly

JNJ Buy Long on StrengthJNJ fundamentally is a cross between Big Pharm and Consumer Staples
Recent Earnings were solid not spectacular but the latter is not expected here.
Technically, JNJ climbs higher without much volatility, At the moment it
is rising in a small cycle within the supertrend. Strength is increasing
and some bearish momentum is exhausting. This is a low-beta stock and it
does not react much to the larger broad market. I see this as a good time
for a LEAP option for early 2024 at a strike 15% above the current price.

Going Long in Johnson & Johnson - JNJHello Traders,
Johnson & Johnson JNJ - NYSE
Buy / Long Trade Plan.
Entry Level @ Above 23.6% FIB level / 4 Hour resistance level with bullish candle @ 178.00
Take Profit 1 @ Below 4 Hour resistance level 180.60
Take Profit 2 @ Below Daily resistance / FIB 0.0% level 182.96
Stop Loss @ Below Daily Support Level @ 176.17
Lot Size :
Portfolio Size 10000$
Risk to Reward 1 : 1
Lot size 216 units @ 5% Risk
TP 1 = Total PIPS in gain = 260 Profit 1.61 %
TP 2 = Total PIPS in gain = 496 Profit 2.92 %
Total PIPS in Stoploss = 183 Loss 0.88 %
Regards.

JOHNSON & JOHNSON Can reach $190 by FebruaryJohnson & Johnson (JNJ) has been trading within a long-term Bullish Megaphone pattern since the January 26 2021 High. The pattern has been having very structured Higher Highs and Higher Lows.
At the moment the stock is on a bullish leg, after rebounding exactly on the 1D MA50 (blue trend-line) on November 11 and is also above the 1D MA200 (orange trend-line). The 1W MACD is on a Bullish Cross and the 1W RSI rebounded off a Lower Lows (Double) Bottom formation. The exact same sequence was last seem early this year on January. After one last pull-back, the stock then rallied to the top (Higher Highs trend-line) of the Bullish Megaphone.
The Higher Highs seem to be following the 1.236 - 1.5 - 1.786 Fibonacci sequence and so do the Lows (0.236 - 0.5 - 0.786). The 1.786 Fib extension is a little over $190.00 and that is our current long target on JNJ.
-------------------------------------------------------------------------------
** Please LIKE 👍, SUBSCRIBE ✅, SHARE 🙌 and COMMENT ✍ if you enjoy this idea! Also share your ideas and charts in the comments section below! This is best way to keep it relevant, support me, keep the content here free and allow the idea to reach as many people as possible. **
-------------------------------------------------------------------------------
You may also TELL ME 🙋♀️🙋♂️ in the comments section which symbol you want me to analyze next and on which time-frame. The one with the most posts will be published tomorrow! 👏🎁
-------------------------------------------------------------------------------
👇 👇 👇 👇 👇 👇
💸💸💸💸💸💸
👇 👇 👇 👇 👇 👇

$JNJ with a Bullish outlook following its earnings #Stocks The PEAD projected a Bullish outlook for $JNJ after a Negative Under reaction following its earnings release placing the stock in drift D with an expected accuracy of 33.33%.

Johnson and Johnson preparing for a run upInv H&S in the making
Price should come down first to test the level of support (RS) then shoot up to $176.00.
RSI also should drop a bit before breaking the downtrend.
Concerns:
Price is <200MA and the 21>7 - Bearish...
Bias - Neutral with hopeful bullish setup later on

JNJ sitting on supportJNJ didn't partake in today's rally, however it has recently and is sitting on key support.
A weekly settlement above the descending TEAL secondary channel could prompt JNJ to move higher.
However, failing at the current support structure it's sitting on would allow for continued downside pressure.

Incoming drops confirmed on Johnson&Johnson. JNJWhere are we going with this one? Very likely further down on the largest pharmaceutical firm in the world. As you can see confirmation has been crossed, signifying a start of a new zigzag.
We are not in the business of getting every prediction right, no one ever does and that is not the aim of the game. The Fibonacci targets are highlighted in purple with invalidation in red. Confirmation level, where relevant, is a pink dotted, finite line. Fibonacci goals, it is prudent to suggest, are nothing more than mere fractally evident and therefore statistically likely levels that the market will go to. Having said that, the market will always do what it wants and always has a mind of its own. Therefore, none of this is financial advice, so do your own research and rely only on your own analysis. Trading is a true one man sport. Good luck out there and stay safe.

JNJ Looking for a temporary move higher.Johnson and Johnson - 30D expiry - We look to Sell at 170.59 (stop at 173.41)
Daily signals are bearish.
Daily pivot is at 170.27.
Bespoke resistance is located at 170.00.
Preferred trade is to sell into rallies.
We look for a temporary move higher.
Our profit targets will be 163.06 and 161.06
Resistance: 168.00 / 170.00 / 174.00
Support: 165.00 / 163.00 / 161.00
Disclaimer – Saxo Bank Group. Please be reminded – you alone are responsible for your trading – both gains and losses. There is a very high degree of risk involved in trading. The technical analysis , like any and all indicators, strategies, columns, articles and other features accessible on/though this site (including those from Signal Centre) are for informational purposes only and should not be construed as investment advice by you. Such technical analysis are believed to be obtained from sources believed to be reliable, but not warrant their respective completeness or accuracy, or warrant any results from the use of the information. Your use of the technical analysis , as would also your use of any and all mentioned indicators, strategies, columns, articles and all other features, is entirely at your own risk and it is your sole responsibility to evaluate the accuracy, completeness and usefulness (including suitability) of the information. You should assess the risk of any trade with your financial adviser and make your own independent decision(s) regarding any tradable products which may be the subject matter of the technical analysis or any of the said indicators, strategies, columns, articles and all other features.
Please also be reminded that if despite the above, any of the said technical analysis (or any of the said indicators, strategies, columns, articles and other features accessible on/through this site) is found to be advisory or a recommendation; and not merely informational in nature, the same is in any event provided with the intention of being for general circulation and availability only. As such it is not intended to and does not form part of any offer or recommendation directed at you specifically, or have any regard to the investment objectives, financial situation or needs of yourself or any other specific person. Before committing to a trade or investment therefore, please seek advice from a financial or other professional adviser regarding the suitability of the product for you and (where available) read the relevant product offer/description documents, including the risk disclosures. If you do not wish to seek such financial advice, please still exercise your mind and consider carefully whether the product is suitable for you because you alone remain responsible for your trading – both gains and losses

Johnson & Johnson (JNJ) downtrend and sell trade setup.JNJ feeling weak right now while moving within two descending channels. Currently the price is at the top of the minor channel, which should increase the selling pressure very soon.

JNJ - Sector rotating to health careJNJ is proven to be much more of a defensive stock and has higher probability of increasing upside. ROC, DM+ and rising OBV/volume all pointing towards the upside.


$JNJ hammer candleIncredible hammer but low volume. Sold some puts this morning 160P for September regular.
I don't mind owning this dividend stock if I get assigned.

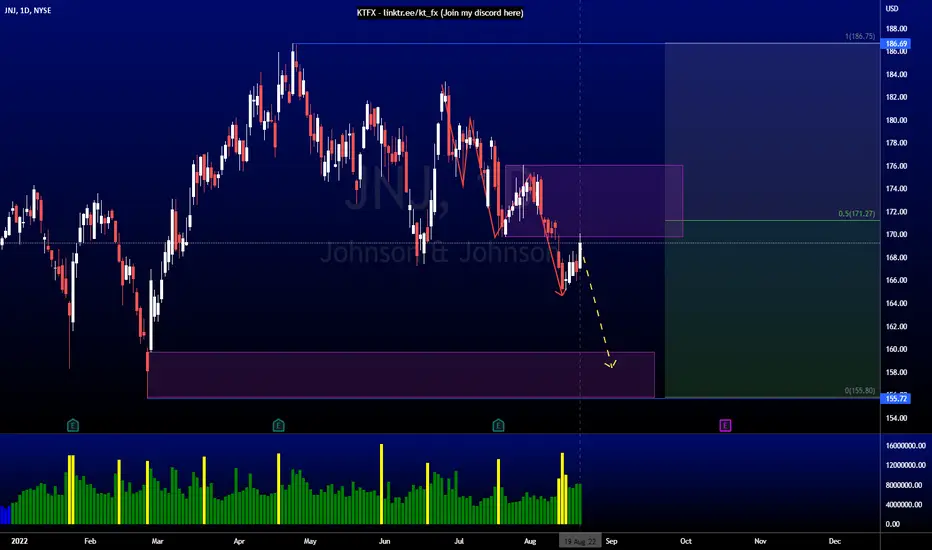
JNJ AnalysisPrice is currently consolidating between 155.72 and 186.69. Price is coming from premium and is at equilibrium right now. We are on a daily timeframe downtrend. I'm expecting the 4H fair value gap at 159.78 to be the target of this downtrend before we see price going higher.
JNJ outperforming BUT M-pattern may retest 163/157 if 170 failsSo far JNJ is outperforming the SPY as staples are a defensive play during uncertain markets.
But if JNJ fails to break above my 170 yellow zone (also BO of the black falling wedge) in the next few days then a retest of the 163 green support zone is next. 163 is also a 1.272 Fib zone & also a retest of the blue upchannel base. This is an ideal spot to end the M-pattern to start a new uptrend validating the blue upchannel.
Although less probable for the near term, a retest of the 157 red zone may occur if the blue channel breaks as this is the upper side of a big red channel started in 2004.
Not trading advice

$170 important levelJNJ's $170 level is under some pressure. I like the down trend for some swing puts.
