Trade ideas
MCD forming Descending Triangle The descending triangle pattern could provide further potential for MCD to go lower. Consider short trade if price closed below the descending triangle pattern. The potential downward move will be likely around $15 if price break below the descending triangle pattern.

Right Back Up To 220.00 "IF""If" MCD beats estimates then right back up it goes, so don't hesitate to jump in quick on a good earnings call. MCD has a Zacks Rank #4 (Sell) and an Earnings ESP of -0.48%, so if we get a surprise there will be a pile on.

McDONALDS 1D BULLISH WEDGEWedges are repeatable trading chart patterns.
Wedges are a form of Triangle chart pattern and will have a specific directional breakout bias.
A descending wedge has a bullish long breakout bias.
Each chart pattern will have defining trendlines of the support/resistance levels creating the pattern.
What ever time frame you are trading this chart pattern, wait for a candle close outside of the trendline in the direction of the breakout candle. (Our time frame preference is the Daily chart).
Add volume indicator - Volume is the amount of $ that went into a particular candle or in Forex the # of trades that took place.
Add ATR indicator - Volatility is the amount of price movement that occurred. Use the ATR to measure the price movement.
When you see descending Volume bars and descending ATR line (which indicates volatility) this shows
a dis-interest in traders to invest in this pair creating consolidation which creates the chart pattern.
Trade Management after there is a breakout candle close.
1 - Position size (compare volume bar to volume ma line).
a - Breakout candle must be 100% of average volume for a full position size.
b - If 75% of average volume then ½ position size. (To find 75% of Volume
look at the charts volume settings – divide smaller # into larger # = 75%+)
2 - Enter two trades.
3 - SL for both trades will be 1.5 x ATR.
4 - 1st trade TP will be 1 x ATR.
5 - No TP on 2nd trade – letting profit run and adjusting SL to follow price.
6 - When 1st TP hit – move 2nd trade SL to breakeven.
7 - Adjust the 2nd trade SL to follow price.
*8 – After Breakout candle – if price closes back into chart pattern close trade
*9 - When breakout candle is more than 1 ATR from breakout candle open.
a - Enter 1st trade at candle close with ½ position size.
b - Enter 2nd trade with a pending limit order that is 1 ATR of breakout candle open.
c – Price should pullback to that pending limit order for 2nd trade.
d – If Price returns back into chart pattern close trade before SL is hit.

10/21/2019 - $MCD Iron Butterfly PlayBTO $MCD Iron Butterfly ibb.co - $475/contract credit.
The goal is to buy this back at $100 or less one hour into the open tomorrow. Provided that $MCD stays within the 202 - 217 range, this will pay off after the IV crush and theta decay have played out.


MCD Buy When Reaches SupportMcDonalds has been showing a downtrend. McDonalds also releases its third quarter earnings report on October 22. It is likely that they will beat earnings expectations, so when it reaches the support line I would buy given the possible growth in the next week.

MCD sails through GFCIf the Global Financial System is in crisis, take a look at this winner from the GFC.

MCD Loses Its All-Time HighAfter running up due to corporation Buybacks, MCD has failed to hold those new highs as heavier than normal Dark Pool Quiet Rotation™ to lower inventory of shares continues. The stock is now stepping down in a short-term topping formation.


Interesting support and resistance lines.Note that the breakout to the downside is support, and the next stop down is just about a textbook target....then earnings; this should be interesting. Especially in light of MCD's history of rising the last quarter 11 out of the last 13 years. And the fact that news related events have caused this set up across the board in large part...can it even be trusted at this point?

McDonald’s: Where to buy for a long term investment.MCD (McDonald’s Corporation) has been trading within a very strong 1M Channel Up (RSI = 70.206, MACD = 17.720, Highs/Lows = 10.6514), which as seen by its technical action is on the Higher High zone.
Based on its historic volatility within the Channel Up, we expect MCD to pull back for a Higher Low towards 190 before resuming the uptrend. A potential Death Cross (MA50 under MA200) should come as confirmation of a sideways phase (bottom is in) and a Golden Cross (MA50 over MA200) as confirmation of the next bullish leg.
The RSI pattern seems to also be cyclical and in that sense we have hit the Higher High and are in anticipation of the Higher Low. Our long term Target is at least 240.00.
** If you like our free content follow our profile (www.tradingview.com) to get more daily ideas. **
Comments and likes are greatly appreciated.

MCD t.a. update +Q4 goalsTaking a look @ MCD price history on the 1WK time frame, labels show a potential pattern correlation of long term uptrends, where the EMA21 level acts as a major support at least 1x before the uptrend reverses. Doesn't mean that it's 100% going to happen again but historically patterns do have a tendency to repeat themselves, and the current price action is just coming out of that critical EMA21 support area. Worth noting, since the idea further supports current trade set up from previous MCD post, but more importantly, this will be great to use as a reference during post-trade review.
*Side note/Q4 goals update.
My Q4 focus is to build & reinforce a really strong foundation/core of my trading profile, using the fundamentals that are absolutely critical to long term success as a trader. Everyone has their own strategies, but If you are taking the time to read trade ideas like this then I'm sure you can relate to how important research and studying are when aspiring to become a trader at the professional level. Everyone says they want to be a trader, but it seems like very few are actually willing put in the hard work required to get there. This is an insanely complex occupation to pursue, but at the same time such an incredible opportunity as a career choice. I look forward to re-reading quarterly updates like this 1 year, 5 years, 10 years, etc from now & measuring the progress. I see so many great ideas flowing through the tradingview feed on a daily basis, and every trading experience just helps refine and improve trading efficiency. Big thanks to those that contribute quality content on a regular basis. Just happy & grateful to be a part of it all.
Wishing everyone the best of luck in Q4, see you in the green at New Years

MCD t.a. updateMCD update, daily chart labeled w arrows where SMA100 has acted as a major support. Price action also shows a nice gap up from friday's close. The open was above the ema21, signaling intermediate bullish momentum may continue. Intraday chart is also showing signs of potential bullish momentum, as price is currently retesting EMA50 level (previous known resistance). If intraday price closes above EMA50 it could signal a potential LONG entry. If LONG entry confirms, update stoploss to "trailing stop loss" @ any close below the EMA10.
Target exit remains 65-70 RSI level @ +4%

STOCKS MCD & WMT | OCT19 WK1 Wkly. (Expires. Oct 4th)STOCKS | MCD & WMT
OCT19 WK1 Wkly. (Expires. Oct 4th)
Become a Member for More Ideas or Expired Signals
signalclub.io/signals
NYSE:MCD

MCD Gann Projectionswww.wsj.com
Use the low of ~0.088 ; use the high of ~1.22 & project out from there and these critical levels present themselves
acknowledge the strength of these gann levels
manage your own risk
gl hf
xoxo
snoop


MCD t.a. & set upMCD is showing signs of an overall long-term uptrend pattern, & is currently trading above the SMA200, signaling a possible long entry. On the daily chart, possible cup and handle also forming after a significant pullback occured early/mid September. Also, last session the price opened above, and closed above the EMA21, signaling a potential intermediate uptrend is likely if price continues to consistently close above EMA21 level. Additionally, The EMA5 recently crossed up & above the EMA10, signaling short term bullish momentum. Considering this combination of confirmed and pending signals:
A good entry might be; if the price breaks above and closes above the SMA50 level.
*another option could be to take an initial entry if Monday opens above the EMA21, and then add to position if price breaks/closes above the SMA50
A stop could be set at: any close below the EMA21 @ -1%
A good target exit might be best at: Known resistance @65-70 RSI area, or any close below the EMA10 level @ +4%
Risk/Reward ratio optimal @ 4:1

Moving averages say buy, but the market says ? MCD usually does quite well from Sept to the end of the year (up 11 of the last 13 years I believe). But if the market crashes....well let's just say that buying on Friday could be a mistake, regardless of what the moving averages are saying (read between the dotted lines). Is it just me, or has all of the reactions to news events made this a common pattern this year; and if so should we ignore it?


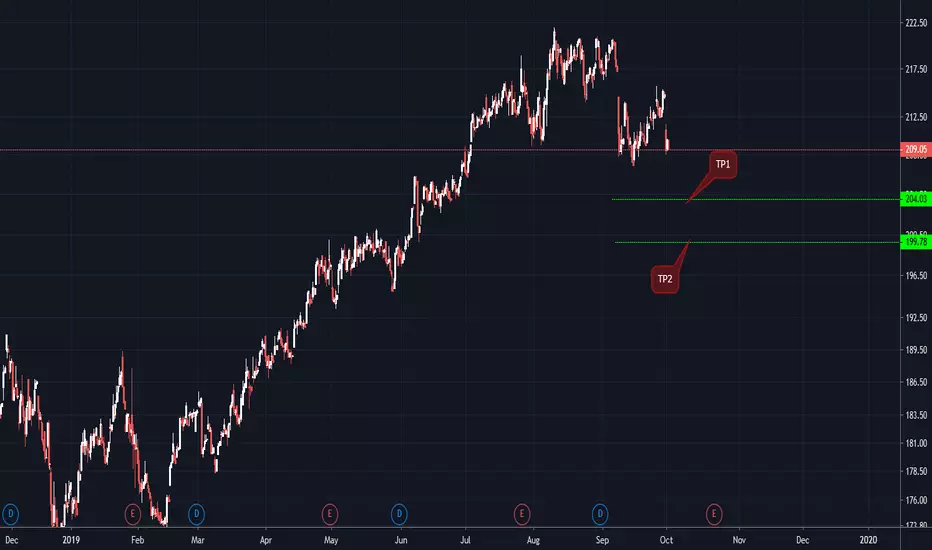
MCD Short !! 69.57%, SEP19 WK2 => MCD dipped 220.03 to 209.81MCD Short !! 69.57%, SEP19 WK2 \
=> MCD dipped from.. 220.03 to.. 209.81.
One of Past Signals published for the 2nd Week, SEP.
(Effective Date was Sep 9~13) www.signalclub.io
NYSE:MCD
