META Momentum Builds! Bullish Swing Trade Roadmap🚀 META: The Layered Entry Swing Play - AI Momentum Revival 📈
Executive Summary 💼
META Platforms sits at a pivotal technical juncture where institutional AI capex demand collides with short-term profit-taking. This swing trade targets the $720 resistance breach using a disciplined layered entry methodology — perfect for risk-managed traders seeking 3-5% upside with controlled downside.
📊 Trade Setup | Master Plan
Asset: 🔵 META (NASDAQ) | Meta Platforms, Inc.
Timeframe: Swing Trade (4-6 weeks)
Bias: 🟢 BULLISH (Support Zone Recovery)
Risk Appetite: Moderate to Aggressive
🎯 Entry Strategy | The Intelligent Layering System
Rather than chasing a single entry price, we employ a pyramiding buy-in method across key support zones. This reduces emotional trading and improves risk-reward at scale.
Multi-Layer Entry Points (Buy in Tranches):
Layer 1 (Initial Position): $638.50 — 2% account risk
Layer 2 (Dip Catch): $630.00 — 2% account risk
Layer 3 (Strength Reload): $650.00 — 2% account risk
Layer 4 (Breakout Confirmation): $660.00 — 1.5% account risk
Total Allocation: ~7.5% per full setup (adjust per your risk tolerance)
Rationale: Layering avoids the emotional cost of "missing" an entry and distributes your execution cost—professional traders call this dollar-cost averaging on entries.
🛑 Stop Loss | Discipline Wins Wars
Hard Stop: $610.00
Reasoning: Below this level, the daily chart's support at the 200-EMA fails. Loss = ~4-5% from average entry ($645), which is reasonable swing risk.
⚠️ DISCLAIMER: This stop-loss level is MY analysis only. You remain fully responsible for your risk. Consider your account size, leverage, and emotional tolerance before committing capital. Never risk more than 2% per trade.
🎪 Target Strategy | Know When to Take Profits
Primary Target (Resistance Police Force): 📍 $720.00
Why $720 Matters:
328-Period SMA (4-hour chart) typically acts as resistance during consolidated ranges
Overbought Territory Signal: RSI creeping above 70 = profit-taking zone
Technical Trap Warning: Large sellers often cluster here after gaps up
Psychological Level: Round numbers ($720) trigger algorithmic selling
Escape Plan: When price approaches $720, take 50% off the table to lock profits. Let remaining 50% run with a trailing stop at +3% below entry.
⚠️ DISCLAIMER: This target is NOT guaranteed. META could face: regulatory headwinds, macro rate shock, or competitor moves. You decide your exit—never marry a target. Protect your capital first.
📡 Related Pairs to Monitor (Correlation Watch) 🔗
1️⃣ NASDAQ:GOOG (Google / Alphabet Inc.) — POSITIVE CORRELATION (+0.82)
Key Insight: Both compete in AI advertising and data-center infrastructure. If GOOG rallies, META usually follows.
Watch: GOOG breaks above $200 = risk-on sentiment for META.
2️⃣ NASDAQ:TSLA (Tesla, Inc.) — MODERATE POSITIVE CORRELATION (+0.71)
Key Insight: Both are "mega-cap AI/Tech bets." TSLA weakness can drag META down (flight to safety).
Watch: TSLA support breaks = potential META correction into your layers.
3️⃣ NASDAQ:AMZN (Amazon.com) — POSITIVE CORRELATION (+0.76)
Key Insight: AWS AI infrastructure play; if AMZN capex concerns flare, META suffers (shared narrative).
Watch: AMZN guidance = signal for META's data-center spend outlook.
4️⃣ AMEX:SPY (S&P 500 ETF) — MODERATE CORRELATION (+0.68)
Key Insight: Macro beta. Fed rate decisions move SPY; SPY moves all mega-caps.
Watch: CPI data Dec 18, 2025 at 8:30 AM ET = critical catalyst.
5️⃣ TVC:VIX (Volatility Index) — NEGATIVE CORRELATION (-0.55)
Key Insight: Rising VIX = fear. META can gap down on broad market panic.
Watch: VIX above 20 = consider tightening your stop or waiting for another layer signal.
💡 Key Technical Confluences
✅ Why This Setup Works:
Layered entries = you're never "too early" or paying too much
52-week range sits between $480–$796 (META has room to $720) 📈
Analyst consensus = "Strong Buy" with targets ~$832 median
AI capex narrative = earnings growth driver into Q1 2026
Dividend pay date Dec 23 = pre-holiday consolidation likely
❌ Risks to Abort:
Breaking below $610 = trade is invalid; exit immediately
Regulatory shock (FTC enforcement) = gap down risk
Macro CPI shock Dec 18 = volatility surge, potential liquidation
Competitive loss to GOOG/AMZN AI = narrative reversal
📈 Risk Management Checklist
Before you trade this setup:
Do you understand layering reduces timing risk? ✅
Is your stop at $610 within your risk tolerance? ✅
Have you calculated max loss? (e.g., 7.5% × 2% per layer = ~$150 per $1000 risked) ✅
Is $720 target realistic in 4-6 weeks? (YES—analyst upside + technical confluence) ✅
Will you stick to your exit plan, or will greed override? ⚠️ (This is the real test!)
🎬 Action Plan | Execution Timeline
Week 1 (Dec 18–22): Place Layer 1 & 2 buy orders. Watch CPI data (Dec 18, 8:30 AM ET).
Week 2–3: Scale into Layers 3 & 4 on any dips. Monitor GOOG/AMZN correlation.
Week 4–6: Approach $720; take 50% profit at resistance. Manage trailing stop on remainder.
Exit Plan: TP hit = reduce risk. SL hit = accept loss, move on. No "hope trading."
📝 Disclaimer & Fun Caveat
🎭 This is a "playful but serious" swing-trade idea. It's designed for entertainment AND education—think of it as how a mischievous but disciplined trader (our "thief trader OG") approaches META with style, humor, and risk management.
✨ Closing Thought
If you find value in this analysis, a 👍 and 🚀 boost is much appreciated — it helps me share more setups with the community!
#META #SwingTrade #TechStocks #AITheme #LayeredEntry #TradingView #StockMarket #NASDAQ #Bullish #MoneyManagement
#RiskManagement #ProfitTaking #TechnicalAnalysis #StockAnalysis #TradeSetup #LongBias #2025Trading
Meta Platforms Inc Shs A Cert Deposito Arg Repr 0.041666666 Shs
No trades
Market insights

Midterm Stock Forecast for METANASDAQ:META At $594, Meta enters a buy zone after the sharp decline since late October. H1 technicals show stabilizing momentum. First target stands at $660, and extension toward $760 remains possible if ad revenue and AI-driven engagement trends stay strong. Valuation still supports midterm upside after the recent correction.

Positive GEX Profile Points Toward 700 Gap FillMETA – Holding Above HVL, 50 DMA Reclaim in Progress, Upside Call Resistance at 700
META is currently trading below the 200-day moving average , but recent price action suggests a potential structural improvement rather than continued weakness.
From an options perspective, the broader structure remains Positive GEX , indicating that dealer positioning is still supportive on pullbacks. At the same time, IV remains low , which typically favors range expansion and directional follow-through once key technical levels are reclaimed.
On the daily chart, price is now starting to reclaim the 50-day moving average , a level that previously acted as dynamic resistance. Importantly, META is also holding above the High Volatility Level (HVL) , which keeps the short-term regime constructive rather than defensive.
Volatility conditions remain favorable:
Call Pricing Skew is elevated (~31.6%), showing persistent call demand
IV remains controlled, allowing price to move without immediate volatility compression pressure
Looking forward, the most important upside call resistance is the 700 level, which represents:
Highest core call resistance on the Feb 20 (Optimal Monthly) expiration
A major gap fill from the prior breakdown
A clear technical resistance zone visible on the daily chart
This confluence makes 700 a logical upside target if price can hold above HVL and fully reclaim the 50 DMA.
Key structure to watch:
200 DMA – higher timeframe resistance overhead
50 DMA – short-term trend reclaim in progress
HVL – holding above keeps structure constructive
700 – primary upside target (gap fill + core call resistance)
As long as price holds above HVL with supportive GEX structure, rotational upside toward 700 remains the higher-probability path .

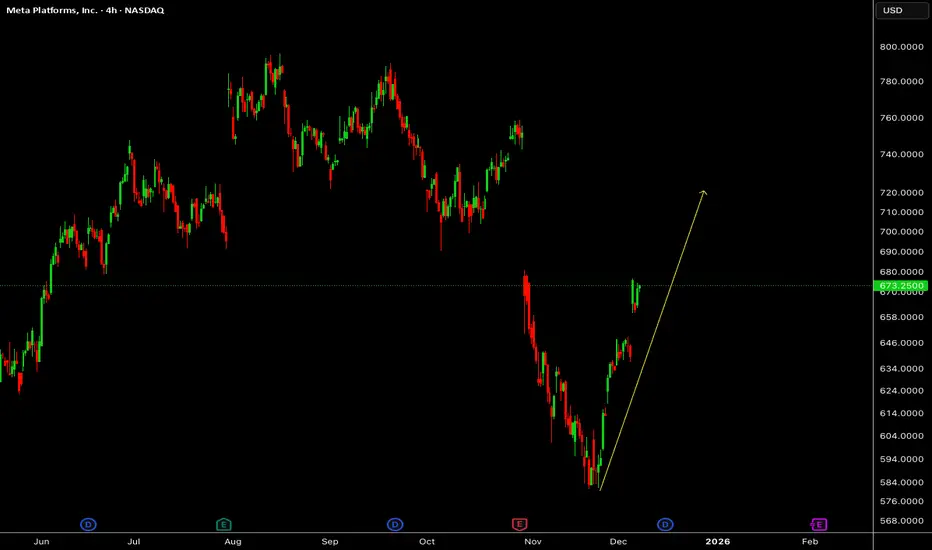
META Regains Direction as Price Rebuilds MomentumMeta Platforms is showing a constructive shift in price behaviour on the 4H timeframe after a corrective phase, with structure beginning to realign in favour of continuation. The recent recovery suggests buyers are gradually reasserting control as the market reassesses growth expectations and broader tech sentiment. Rather than impulsive movement, price is advancing in a more measured manner, often seen when confidence starts to rebuild. This phase remains important as META positions itself for the next leg of directional expansion.
Disclosure: We are part of Trade Nation's Influencer program and receive a monthly fee for using their TradingView charts in our analysis.

Meta is a fundamentally strong stock, supported by robust cash fMeta is a fundamentally strong stock, supported by robust cash flows and long-term growth drivers.
Mid-to-long-term bullish trend remains intact.
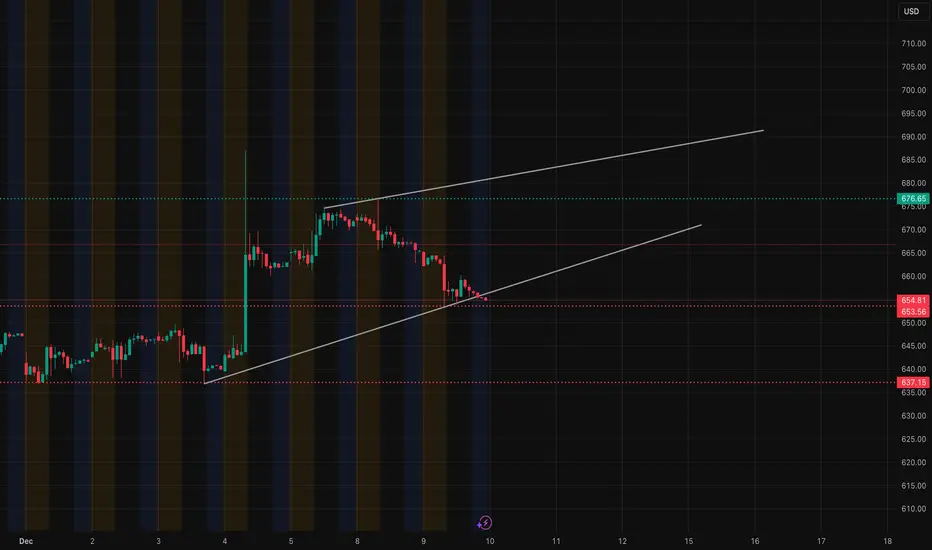
Price is consolidating within an ascending channel, holding the lower diagonal support.
Accumulation phase in progress around current levels.

Is Face book undervalueLet’s start with fundamentals:
1.Earning for q4 was about 4 % below estimate (33.67 B) but still 20 % higher than same period last year.
2.Totall net income for 2020 was 29.15 B and for 2021(4 quarters) is 39.37 B. Isn’t it wonderful?
And FB is trading at 232$ (is equal to the average price of 2020, but with 34% higher net income.)
And after all FB is heavily investing in metaverse. This investment reduces net income for the current year and it will gain it back in near future.
Now technical:
1.Who bought 181 M of FB shares yesterday and 42 M of shares until 12 PM while the average volume was about 20 M? Yes, big boys
2.look at the chart at weekly period:
The important 200 moving average is touched and since 2016 only was touched 2 times, once in Dec2018 and the second was in March 2020 at the beginning of the pandemic. This moving average is an important support.
3.The volume that has been traded in this week is more than the volume in the peak of covid19 decline.
4.You can see the black line is a very strong support.
5.The CCI level is -385 which is the lowest amount from the IPO
6.The RSI level is 23 which is the lowest amount from the IPO.
All saying that it will see the real value.

Meta: Upward PressureRecently, Meta has experienced renewed upward pressure, pushing toward the resistance level at $690.55. Should this level be surpassed next, we might expect stronger (corrective) climbs up to a new high for green wave alt. near the resistance at $906.60 (probability: 37%). Primarily, we consider the regular wave as already completed and anticipate that the ongoing magenta downward impulse will gradually extend below the support at $580.29.

Meta Platforms $META stock demand level is playing outMeta Platforms NASDAQ:META stock demand level is playing out after the demand level at $100 took control, as expected and mentioned in the previous update. Waiting for new bullish legs.

META 1D - target - $751Meta poised for closing FVG. Target 751 on following assumptions.
1. The handle forms fully
2. It breaks 663
3. No push back at daily Supply Zone
Fingers crossed.
More analysis welcome.

$META bullish for the long term and gap to be filledNASDAQ:META Beyond the glitch in the chart, I am bullish for the long term and attracted by the gap down that will have to be filled... Next week for me there is a risk of volatility

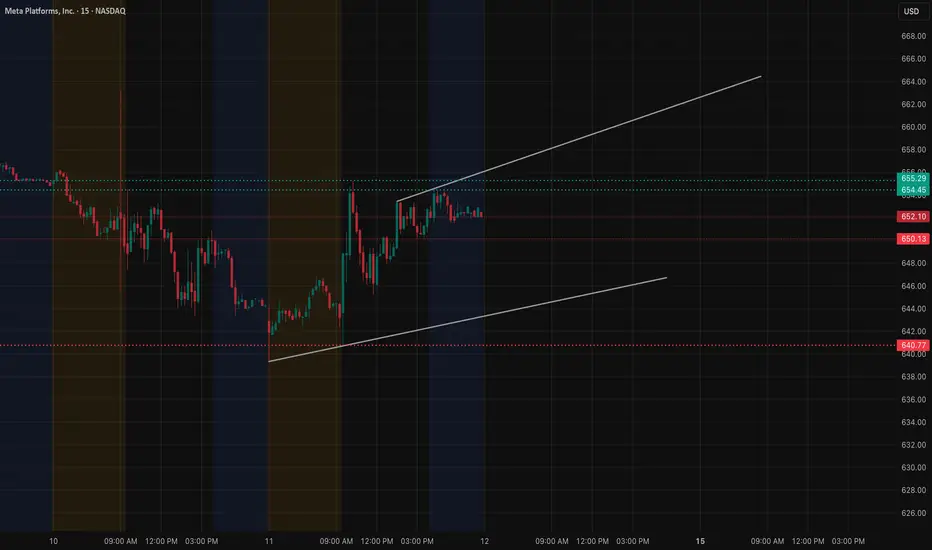
META Dec 12. Coiling at a Major Decision Zone. Big Move LoadingMETA continues to climb inside an ascending channel on the 15-minute timeframe, but price is now compressing into the upper boundary near 654–656. This zone has acted as intraday supply, and each test has produced smaller candles with decreasing momentum. When price moves like this—tight range, rising structure, slowing impulse—it often signals a larger move coming.
The lower boundary of the channel sits around 648–650, which held as the intraday demand zone multiple times today. Every pullback into this area was absorbed quickly, showing that buyers are still active as long as META stays above this pivot.
Now the question becomes: does this structure break upward or fail back toward the mid-channel? Let check GEX option data chart below.
This is where the options landscape becomes extremely useful.
The GEX levels show how options positioning is influencing price behavior, and today they lined up almost perfectly with META’s price structure. The 654–656 area, where price has been stalling, corresponds with a cluster of positive gamma levels. When price approaches these upper gamma zones, dealer hedging typically suppresses volatility, which explains the repeated slowdowns and rejections near that region.
Just above it, the next set of gamma resistance levels sits around 660–665. If price can break the 654–656 supply and hold above it, the hedging landscape shifts. Dealers would begin adjusting positions in a way that allows momentum to expand, opening room for META to test the 660 area first, then 665 if momentum continues.
On the downside, the 645–640 zone shows up as a negative gamma pocket. These levels align with the mid-channel and lower demand regions. If META loses the 650 pivot and slips under the rising channel, hedging flow begins to work in the opposite direction—volatility expands instead of compressing. That would naturally draw price toward 645–640, and a deeper break exposes the 635 zone where negative gamma becomes even more influential.
The correlation between price structure and options positioning makes the current setup straightforward:
• Holding the channel above 650 gives buyers room to challenge 654–656 again
• Clearing 656 shifts both structure and GEX alignment toward 660–665
• Losing 650 flips the structure bearish and aligns with negative gamma flow toward 645–640
When both the chart structure and options landscape point to the same levels, it gives the setup much more conviction. META is approaching one of those moments where the next breakout or breakdown could set the tone for the entire day.
This analysis is for educational purposes only and not financial advice.
$META RetracementOK y'all Meta has been on a blaze for the last week It's time for some retracement perhaps filling that gap from last Thursday's take off.
Using the Fibonacci's on the 15 min Time Frame, I have labeled the stop loss entry level (Candle must close above SL) and take profits (If wicks I take profit; Trust issues lol). If your stomach gets the tingling feeling and that dopamine kicks in take profit.
Alerts set, Happy Trading!
Happy Birthday to my best friend Staci of 25 Years!

META swing lowMy dowsing work is suggesting a swing low on META.
I get all my information from this method and journal here. I expect META to get up to 676 and possibly beyond that. But for now, $676.

META Weekly Signal Breakdown: Hidden Bullish Momentum Despite BeMETA Weekly Trading Overview (Combined From All 3 Signals)
Signal Confidence: 55–58% (LOW conviction)
Overall Direction: ⚠️ Slight Bullish Bias — but NOT strong
Flow Intel: VERY Bearish (PCR 2.68–3.01)
Risk Level: HIGH (Friday expiration + low volatility + conflicting signals)
📌 1. KATY AI Price Prediction Summary
Across all 3 versions:
Bullish elements
✔ Price trajectory shows more up-points than down-points
✔ AI predicts move toward 651 → 657 by Monday
✔ Time-series (not summary label) shows ~1% upside
✔ Monday gap-up potential
Neutral/Bearish elements
⚠ Volatility near 0 → META may not move much
⚠ Very heavy put buying (PCR > 2.7) → usually either big hedge OR fear
⚠ Weekly momentum flat
⚠ RSI ~73 → overbought
⚠ Low volume → breakout needs fuel
Interpretation:
AI sees slow grind upward, but flow + technicals add danger.
📌 2. Key Levels (VERY IMPORTANT)
SUPPORT
$638.60 — Strong support
$645.00 — Soft intraday support
$650.00 — psychological + VWAP zone
RESISTANCE
$657.00 — AI target zone
$663.60 — weekly high
$671–675 — heavy distribution zone
📌 3. Best “Unified” Call Setup (Based on All 3 Signals)
🎯 Strike: 647.5 or 650
〇 Better delta
〇 Lower premium
〇 Close to VWAP
🎯 Entry: ~$8.80–$9.10
(Consistent with signal)
🎯 Profit Targets:
PT1: $13.00–$13.50 (+50%)
PT2: $16.00–$16.50 (+80–100%)
🛑 Stop Loss: ~$6.00 (−30%)
📌 4. “Takeaway for Traders” — Simple Version
✔ Bullish case:
AI sees slow upward grind
Monday potential gap-up
Bearish options flow may create a contrarian squeeze
✔ Bearish case:
RSI overbought
Very low volatility
Put-heavy flow may reflect real fear
META stuck in tight range $649–657
⭐ Most Likely Scenario (Probability-Based):
META trades in a slow upward channel toward $653–657 by Monday, unless a macro shock hits.

META Weekly Analysis: Strategic Call Entry on Katy AI Predicted META Weekly Signal Overview
Instrument: META
Date: 2025-12-11
Expiry: 2025-12-19 (8 days)
Direction: BUY CALLS
Confidence: 55–58%
Conviction Level: Low
Recommended Strike: $585.00 – $590.00
Entry Range: $58.02 – $67.42
Target 1: $69.62 – $94.39 (20–40% gain from entry)
Target 2: $81.43 – $121.36 (40–80% gain from entry)
Stop Loss: $46.42 – $47.19 (20–30% loss from entry)
Position Size: 2% of portfolio
🧠 Analysis Summary
Katy AI Signal: Bullish trajectory; predictions show gradual upward momentum with peaks up to $674.78 (+4.15%) before consolidation around $656–659.
Technical Analysis:
Current price $647–652 near weekly midpoint/high.
VWAP $653–654 overhead resistance.
MACD bullish, elevated volume (1.5x average) indicates institutional interest.
Weekly range positions 48–80%, showing some upside room.
News Sentiment: Mixed, with bearish “Death Cross” vs bullish AI partnership and sector attention.
Options Flow: Bearish PCR 2.04–2.78 indicates heavy put positioning; unusual activity suggests hedging rather than directional conviction.
Weekly Momentum: Neutral (+0.59–0.60% 1W)
⚡ Competitive Edge
Katy AI’s bullish trajectory provides explicit targets despite bearish options flow.
Deep ITM strike and high delta (0.972–0.991) protect against time decay and volatility.
Thursday positioning with 8 days to expiry allows gamma expansion for predicted weekly moves.
🚨 Risk Notes
Low conviction trade due to Katy AI’s 50% confidence and conflicting options flow.
High risk due to sector volatility and mixed signals.
Tight stop loss recommended and consider scaling in position.
Monitor VWAP resistance and $638–$640 support levels closely; breakdown invalidates bullish thesis.

Meta - $450 Target - The Next Big Short?Even though Meta is holding up in the LLM race with Llama, Meta has had a massive failure (over $70B+) on the failed Metaverse project in which is their new namesake along with now the Australian social media ban for people 16 and younger, and people realizing the intensity of the data Meta collects on people. The stronghold Meta has on social media is coming to a pause, and at the same time questions are arising on whether or not they can differentiate themselves enough having a hard time tackling growth beyond Facebook's user stagnation point and advertising. That said, short volume is increasing, and the recent bull run could be due for a correction. The MACD trading indicators show two recent pushes over short volume, and at the same time, this seems to be the top of the bullish trendline. A retracement back to $450 making this a big short is possible. As always, none of this is investment or financial advice. Please do your own due diligence and research.

META (Dec. 10) — Sitting on the Edge of Breakdown or Reversal?META is in a tricky spot right now. The 1H chart shows price grinding along the rising trendline that has been supporting the entire December move. Buyers have been defending that line, but the structure has weakened with lower highs forming on every bounce. The trendline is now being tested again, and momentum continues to fade.
If META loses this 1H trendline, the next demand doesn’t show up until the 642–650 zone — the exact area highlighted by the 15M chart and confirmed by the GEX put-support levels. So the downside path is clean if the trendline gives way.
On the 15M chart, price has been compressing under a descending trendline. Sellers have the upper hand intraday — every bounce is getting sold off quickly, and the tape keeps drifting back toward the red liquidity zone at 653–654. META needs to reclaim the breakdown zone near 662–665 to flip the tone back to bullish; otherwise, the structure is still leaning downward.
The GEX layout matches the chart almost perfectly. Strongest positive gamma sits all the way up at 670–680 — nowhere near current price — which tells us dealers aren’t defending the downside. Meanwhile, the put support walls at 653 and 642 are located exactly at the two major technical demand zones on 1H and 15M charts. When price stalls right on top of these put walls, it usually means the market is waiting for liquidity before the next move.
Because META is trading inside the red liquidity box and under the 662–665 rejection zone, the GEX map confirms that the path of least resistance is still lower unless bulls step in with force.
My thoughts:
META is in a bearish bias short-term unless it reclaims 662–665. If that level stays resistance, the chart and GEX both point toward a potential flush into 653 first, and then the deeper 642–645 zone if that breaks. Those are the only areas where I'd expect real buyers to show.
If the 1H trendline somehow holds again and price breaks above the descending trendline on the 15M, then a recovery toward 670 becomes possible — but META must break structure before any upside becomes meaningful.
Disclaimer:
This analysis is for educational purposes only and is not financial advice. Always do your own research and manage your risk before trading.
Understanding the Metals Market1. Types of Metals
The metals market is broadly categorized into two segments: precious metals and industrial metals.
Precious Metals: These include gold, silver, platinum, and palladium. They are considered valuable due to their rarity and historical use as a store of wealth. Precious metals are often used in jewelry, electronics, and as financial hedges against inflation and currency risks.
Industrial Metals: These include copper, aluminum, zinc, nickel, and lead. They are widely used in construction, automotive, and manufacturing sectors. Their prices are influenced by global economic activity and industrial demand.
2. Market Participants
The metals market is complex and involves multiple participants, each with different objectives:
Producers: Mining companies extract metals from the earth and sell them to refiners or directly to industrial users. Examples include BHP, Rio Tinto, and Vale.
Consumers: Industrial users, such as construction firms, electronics manufacturers, and automotive companies, purchase metals for production.
Investors: Individuals and institutions invest in metals to diversify their portfolios, hedge risks, or speculate on price movements. Investment channels include physical metals, futures contracts, ETFs, and mutual funds.
Speculators and Traders: Traders in commodities exchanges and over-the-counter (OTC) markets buy and sell metals to profit from price fluctuations. They provide liquidity to the market.
Governments and Central Banks: Central banks often hold gold reserves, which can influence global prices, while governments regulate mining and trade policies.
3. How Metals Are Traded
Metals can be traded in physical or financial markets:
a. Physical Market
In the physical market, metals are bought and sold in their actual form, such as bars, coins, or sheets. This market is essential for industrial use and jewelry manufacturing. Prices in the physical market are influenced by immediate supply and demand, logistics, and quality specifications.
b. Futures Market
Futures contracts are standardized agreements to buy or sell a metal at a predetermined price on a future date. Futures are traded on commodities exchanges such as the London Metal Exchange (LME) or COMEX in New York. They allow producers and consumers to hedge against price volatility, while traders can speculate on price movements.
c. Spot Market
The spot market involves the immediate buying and selling of metals for delivery “on the spot,” usually within two business days. Spot prices reflect real-time supply and demand conditions.
d. Exchange-Traded Funds (ETFs) and Derivatives
Investors can gain exposure to metals without physically owning them. ETFs track the price of metals, while options and swaps allow for complex financial strategies. These instruments increase liquidity and provide more ways to hedge or speculate.
4. Factors Influencing Metals Prices
The prices of metals are influenced by a combination of fundamental, economic, and geopolitical factors.
a. Supply Factors
Mining Output: Production levels from major mining countries directly impact supply. Strikes, natural disasters, or political instability can reduce output.
Inventory Levels: Stockpiles in warehouses and exchanges can buffer supply disruptions, affecting market prices.
b. Demand Factors
Industrial Demand: Construction, automotive, electronics, and renewable energy projects drive demand for industrial metals.
Investment Demand: Economic uncertainty and inflation often push investors toward precious metals as a safe haven.
Technological Trends: Advancements in technology, such as electric vehicles, increase demand for certain metals like lithium and nickel.
c. Economic and Financial Factors
Interest Rates: Higher interest rates tend to reduce investment demand for non-yielding assets like gold.
Currency Movements: Metals are usually priced in U.S. dollars. A stronger dollar makes metals more expensive for other currencies, reducing demand.
Global Growth: Economic expansion increases demand for industrial metals, while recessions reduce it.
d. Geopolitical and Environmental Factors
Trade Policies: Tariffs and export restrictions can limit supply or increase costs.
Environmental Regulations: Mining regulations and sustainability concerns can affect production.
Global Conflicts: Wars or sanctions in metal-producing regions can create supply shocks.
5. Key Metal Markets and Exchanges
Several global exchanges facilitate metal trading:
London Metal Exchange (LME): The world’s largest market for industrial metals, including copper, aluminum, and zinc.
COMEX (New York): Focused mainly on precious metals like gold and silver.
Shanghai Futures Exchange (SHFE): Important for the Chinese market, trading metals like copper, aluminum, and steel.
Multi Commodity Exchange (MCX) in India: Trades metals such as gold, silver, copper, and aluminum for the Indian market.
These exchanges provide standardized contracts, clearing mechanisms, and transparent pricing, which help stabilize the market.
6. Role of Speculation and Hedging
Speculation and hedging are two primary motivations in metals trading:
Hedging: Producers and consumers use futures and options to lock in prices and reduce exposure to market volatility. For example, a copper producer may sell futures contracts to secure a future price, protecting against a potential price drop.
Speculation: Traders aim to profit from price fluctuations. Speculators provide liquidity and can sometimes amplify price movements, creating volatility in short-term markets.
7. Metals as an Investment
Metals, especially precious metals, are considered safe-haven assets. They protect against currency depreciation, inflation, and market instability. Investors can choose to:
Buy Physical Metals: Gold coins, silver bars, or bullion.
Invest in ETFs: Track metal prices without owning physical metal.
Trade Futures and Options: For more advanced strategies and leverage.
Invest in Mining Stocks: Gain exposure to metal production and potential profits from rising prices.
Diversifying into metals can help balance a portfolio and reduce risk, particularly during economic uncertainty.
8. Challenges in the Metals Market
Despite its importance, the metals market faces challenges:
Price Volatility: Metal prices can be highly volatile due to supply shocks, economic changes, or speculative trading.
Environmental Concerns: Mining operations often face strict environmental regulations and societal pressure.
Geopolitical Risks: Metals sourced from politically unstable regions can face supply disruptions.
Technological Shifts: The rise of alternative materials can reduce demand for certain metals.
9. Future Trends in the Metals Market
The metals market is evolving with global trends:
Green Energy Transition: Increased demand for metals like lithium, cobalt, and nickel for batteries and renewable energy technologies.
Digitalization: Improved trading platforms and real-time analytics are transforming metal trading.
Sustainability: Responsible mining practices and recycling of metals are becoming crucial.
Global Supply Chain Shifts: New mining projects in Africa, South America, and Asia are changing the global supply dynamics.
Conclusion
The metals market is a complex and dynamic system that reflects global economic trends, industrial demand, and investor sentiment. Understanding the types of metals, key market participants, trading mechanisms, and influencing factors is essential for anyone involved in investing, industry, or policy. While opportunities in this market are abundant, they come with risks, requiring careful analysis, monitoring of global trends, and strategic decision-making. As the world transitions toward sustainable energy and technology-driven growth, the metals market will continue to play a pivotal role in shaping the global economy.

Commodity Super Cycle Understanding the Long-Term Boom and Bust of Global Resources
A commodity super cycle refers to a prolonged period—often lasting a decade or more—during which commodity prices rise significantly above their long-term average, driven by strong and sustained demand growth. Unlike short-term commodity rallies caused by temporary supply disruptions or speculative activity, a super cycle is structural in nature. It is usually powered by major global economic transformations such as industrialization, urbanization, technological shifts, demographic changes, or large-scale infrastructure development.
Historically, commodity super cycles have played a crucial role in shaping global economies, influencing inflation, trade balances, corporate profits, and investment flows. Understanding the dynamics of a commodity super cycle helps investors, policymakers, businesses, and traders prepare for both opportunities and risks across commodities such as metals, energy, agriculture, and industrial raw materials.
Origins and Concept of a Commodity Super Cycle
The concept of a commodity super cycle gained prominence through the work of economists who observed long-term price trends across commodities. They noticed that commodity prices tend to move in extended waves rather than random patterns. These cycles typically consist of four phases: early recovery, expansion, peak, and decline.
Super cycles are not driven by speculation alone. They emerge when demand consistently outpaces supply for many years. Since commodity production requires heavy capital investment and long lead times—mines, oil fields, pipelines, and farms cannot be expanded overnight—supply often struggles to respond quickly, pushing prices higher for extended periods.
Key Drivers of a Commodity Super Cycle
Rapid Economic Growth and Industrialization
One of the strongest drivers of a super cycle is rapid economic growth in large economies. For example, the industrialization of the United States in the early 20th century and China’s economic expansion from the early 2000s created massive demand for steel, copper, coal, oil, and cement. Urbanization increases consumption of metals, energy, and construction materials on an unprecedented scale.
Infrastructure and Urban Development
Large infrastructure programs—roads, railways, ports, power plants, housing, and smart cities—require enormous quantities of commodities. When governments invest heavily in infrastructure over long periods, it creates sustained demand that supports a super cycle.
Demographic Shifts and Population Growth
Growing populations and rising middle classes increase demand for food, energy, housing, transportation, and consumer goods. Agricultural commodities, energy products, and industrial metals all benefit from these structural changes.
Technological and Energy Transitions
New technologies can trigger commodity demand shocks. The current global shift toward renewable energy, electric vehicles, and decarbonization has increased demand for lithium, copper, nickel, cobalt, and rare earth elements. Such transitions can spark new commodity super cycles focused on “green” or strategic metals.
Supply Constraints and Underinvestment
Commodity markets are cyclical, and long periods of low prices often lead to underinvestment. When demand later accelerates, limited supply capacity causes prices to surge. Environmental regulations, geopolitical tensions, and resource depletion further constrain supply, amplifying the cycle.
Historical Examples of Commodity Super Cycles
Early 20th Century (1890s–1920s): Driven by industrialization in the US and Europe, fueling demand for coal, steel, and agricultural commodities.
Post–World War II Boom (1945–1970s): Reconstruction of Europe and Japan, combined with population growth, led to strong commodity demand.
China-Led Super Cycle (2000–2014): China’s rapid industrial growth and urbanization created one of the largest commodity booms in history, pushing prices of iron ore, copper, oil, and coal to record highs.
Each cycle eventually ended as supply caught up, demand slowed, or economic conditions changed.
Impact on Global Economies
Commodity super cycles have profound macroeconomic effects:
Inflation: Rising commodity prices increase production and transportation costs, often leading to higher consumer inflation.
Exporters vs Importers: Commodity-exporting countries (such as Australia, Brazil, Russia, and Middle Eastern nations) benefit from improved trade balances and economic growth, while importing nations face higher costs.
Currency Movements: Exporters’ currencies often strengthen during a super cycle, while importers may see currency pressure.
Corporate Profits and Investment: Mining, energy, and commodity-linked companies experience higher revenues and profits, encouraging capital investment and mergers.
Role of Financial Markets and Investors
For investors, a commodity super cycle creates long-term opportunities across asset classes:
Equities: Mining, energy, fertilizer, and infrastructure companies often outperform.
Commodities and Futures: Direct exposure through futures, ETFs, and commodity indices becomes attractive.
Inflation Hedges: Commodities are often used to hedge against inflation during super cycles.
Emerging Markets: Resource-rich emerging economies tend to attract capital inflows.
However, volatility remains high, and timing is critical, as late-cycle investments can suffer sharp corrections.
Risks and Limitations of a Super Cycle
Despite their long duration, commodity super cycles are not permanent. Risks include:
Overcapacity: High prices encourage excessive supply expansion, eventually leading to oversupply.
Technological Substitution: Innovation can reduce reliance on certain commodities, lowering demand.
Economic Slowdowns: Recessions or financial crises can abruptly end demand growth.
Policy and Environmental Constraints: Climate policies and regulations can both boost and restrict commodity demand, creating uncertainty.
Investors and policymakers must recognize that every super cycle eventually peaks and reverses.
Is the World Entering a New Commodity Super Cycle?
Many analysts believe the global economy may be entering a new commodity super cycle driven by energy transition, infrastructure spending, supply chain reshoring, and geopolitical fragmentation. Metals critical for clean energy, food security concerns, and constrained fossil fuel investment are all contributing factors. However, whether this develops into a full super cycle depends on sustained global growth, policy consistency, and long-term demand trends.
Conclusion
A commodity super cycle represents a powerful and transformative phase in the global economy, marked by prolonged periods of rising commodity prices driven by structural demand shifts and supply constraints. These cycles reshape industries, influence inflation, alter trade dynamics, and create significant investment opportunities—while also carrying substantial risks. Understanding the causes, phases, and impacts of a commodity super cycle allows market participants to make informed decisions and better navigate the long-term ebb and flow of global commodity markets.

Global Stock Exchanges1. What Is a Stock Exchange?
A stock exchange is a regulated marketplace where securities such as equities, bonds, and derivatives are traded. It provides:
A platform for buying and selling: Ensures fair and efficient transactions between investors.
Regulation and oversight: Protects market participants via rules, surveillance, and disclosure requirements.
Price discovery: Supply and demand determine the price of a stock; exchanges provide the infrastructure to update prices in real time.
Liquidity: Investors can enter and exit positions easily because exchanges bring thousands to millions of participants together.
Capital raising for companies: By issuing shares in an IPO, businesses grow, expand, and innovate.
2. Key Functions of Global Stock Exchanges
a. Facilitating Capital Formation
Corporate expansion depends heavily on capital. Exchanges allow companies to raise funds from the public by selling ownership (shares). This is more efficient than borrowing because equity does not require regular repayment.
b. Providing Liquidity
A liquid market ensures that securities can be traded quickly without large price fluctuations. High liquidity lowers transaction costs, reduces volatility, and makes markets more attractive to investors.
c. Ensuring Transparency and Fairness
All listed companies must meet stringent disclosure requirements. Real-time price updates, audited annual reports, and regulatory filings prevent information asymmetry.
d. Enabling Diversification
Exchanges offer thousands of instruments across sectors—technology, finance, healthcare, manufacturing, commodities—helping investors build balanced portfolios.
e. Supporting Economic Growth
A well-developed stock exchange promotes efficient capital allocation, encourages entrepreneurship, and attracts global investment.
3. Major Global Stock Exchanges
Around the world, there are dozens of stock exchanges, but a handful dominate in size, technology, and global influence.
a. New York Stock Exchange (NYSE), USA
The world’s largest exchange by market capitalization. Home to giants like Apple, Microsoft, and ExxonMobil. Known for high regulatory standards and deep liquidity.
b. NASDAQ, USA
A fully electronic exchange famous for technology-heavy listings—Google, Amazon, Tesla, Facebook, and Netflix. NASDAQ is often seen as the heart of global innovation.
c. Tokyo Stock Exchange (TSE), Japan
Asia’s largest exchange hosting companies such as Toyota, Sony, and SoftBank. It plays a crucial role in global manufacturing and technology sectors.
d. Shanghai Stock Exchange (SSE) & Shenzhen Stock Exchange (SZSE), China
Two of the fastest-growing exchanges. They reflect China’s economic rise and attract massive domestic and foreign investment despite capital flow restrictions.
e. Hong Kong Stock Exchange (HKEX)
Global gateway to Chinese companies. HKEX allows international investors to access mainland firms via Stock Connect programs.
f. London Stock Exchange (LSE), UK
One of the oldest exchanges. LSE is known for global listings, strong derivatives trading, and its role in European financial markets.
g. Euronext
A pan-European exchange operating across multiple countries like France, Netherlands, Belgium, and Portugal. It unifies European financial markets.
h. Bombay Stock Exchange (BSE) & National Stock Exchange (NSE), India
Two of the world’s most active exchanges by volume. NSE’s NIFTY50 and BSE’s SENSEX serve as benchmarks for one of the fastest-growing major economies.
4. How Global Stock Exchanges Operate
a. Listing Requirements
Companies must meet criteria such as minimum market capitalization, profitability, governance standards, and public shareholding norms. These requirements ensure only credible businesses list on the exchange.
b. Trading Mechanisms
Most modern exchanges use electronic limit order books where computers match buy and sell orders based on price and time priority.
c. Clearing and Settlement
Clearing houses act as intermediaries ensuring both sides of a trade fulfill their obligations. Settlement cycles, such as T+1 or T+2, dictate how quickly ownership transfers and money exchanges hands.
d. Circuit Breakers & Market Surveillance
To prevent crashes or excessive volatility, exchanges impose trading halts if indices move beyond a threshold. Surveillance systems track suspicious activity such as insider trading or price manipulation.
5. Global Interconnectivity of Exchanges
Stock exchanges worldwide are interconnected. Events in one region quickly influence others due to:
International investors and institutions moving capital across borders.
Cross-listings, where a company is listed on multiple exchanges.
ETF and derivative products tied to global indices.
Macroeconomic linkages like interest rates, GDP, inflation, and oil prices.
Technology, enabling instant order execution across continents.
For example, a similar technology sell-off in the U.S. NASDAQ may affect Asian markets the next day, as investors re-allocate risk globally.
6. Globalization and the Rise of Electronic Trading
Technology has radically transformed stock exchanges.
a. High-Frequency Trading (HFT)
Uses algorithms to execute trades within microseconds. It increases liquidity but sometimes amplifies volatility.
b. Online Brokers
Platforms like Robinhood, Zerodha, and Interactive Brokers allow retail investors worldwide to participate in global markets at low cost.
c. Crypto Exchanges
Though not traditional exchanges, platforms like Binance and Coinbase mirror exchange functions for digital assets.
d. 24-Hour Trading
Some exchanges now offer extended hours, allowing investors in different time zones to trade almost anytime.
7. Importance of Global Stock Exchanges in the World Economy
a. Wealth Creation for Investors
Stock exchanges help households grow wealth through equity investments, retirement funds, and long-term portfolios.
b. Channels for Foreign Investment
Foreign institutional investors (FIIs) move billions into emerging markets, fueling growth and globalization.
c. Benchmarking Economic Performance
Indices like S&P 500, FTSE 100, Nikkei 225, and NIFTY 50 act as indicators of economic health.
d. Risk Distribution
Through derivatives and diversified holdings, risk spreads across market participants, reducing systemic vulnerabilities.
e. Encouraging Innovation
Capital raised on stock exchanges helps fund research, expansion, and technological advancement.
8. Challenges Facing Global Stock Exchanges
a. Volatility from Geopolitics
Trade wars, conflicts, and political instability often trigger sudden market movements.
b. Differences in Regulations
Global exchanges operate under varying laws, creating complexity for multinational investors.
c. Cybersecurity Risks
Electronic systems are vulnerable to hacking, technical outages, and data breaches.
d. Dominance of Big Tech
Concentration of market capitalization in a few mega-caps sometimes distorts index performance.
e. Slowing IPO Markets
Tighter regulations and private funding alternatives make some firms stay private longer.
Conclusion
Global stock exchanges play a vital role in shaping the modern financial world. They facilitate capital flow, support economic growth, and act as hubs for investment, innovation, and wealth creation. As technology continues to evolve, stock exchanges are becoming faster, more connected, and more accessible. Yet, they also face growing challenges in regulation, cybersecurity, and global competition. Understanding their structure and dynamics helps investors, policymakers, and businesses navigate an increasingly interconnected global financial system.

META Bearish Edge Play: Katy AI Predicts Downtrend Despite BulliMETA Weekly Signal | 2025-12-08
Instrument: META
Direction: PUT (Short Bias)
Strike Price: $660.00
Expiry: 2025-12-12 (4 days)
Entry Range: $6.45 – $6.55 (mid $6.50)
Target 1: $10.32 (60% gain)
Target 2: $13.50 (109% gain)
Stop Loss: $4.50 (30% loss)
Position Size: 3% of portfolio
Confidence: 65% (Medium)
Risk Level: MODERATE
🧠 Analysis Summary
Katy AI: Predicts consistent downward trajectory; short-term pullbacks to ~$638.86 (-4.11%)
Technical: Current price $666.25 below VWAP $668.30; weekly momentum neutral; 2-week performance negative (-0.63%); RSI oversold at 28.6
News Sentiment: Mixed; sector rotation away from mega-caps, AI news favors NVDA/SoftBank
Options Flow: Extremely bullish PCR 0.36 → contrarian put opportunity; unusual activity at $980 call
⚡ Trade Rationale
Contrarian play vs. bullish options flow
Katy AI’s precise bearish trajectory provides timing edge
Balanced delta selection (0.4–0.6) mitigates risk
Tight stop loss protects against low VIX volatility compression
⚠️ Notes
Katy confidence moderate (50%) → reduce position size
Monitor VIX for volatility expansion opportunities
Aggressive call flow at $980 may create gamma risk if momentum reverses

META: What’s Setting Up Next?META has recovered sharply from its recent drop, and the structure now hints at a developing continuation phase. The current climb may still be part of a broader move forming to the upside, with momentum showing signs of strength. As price builds within this emerging pattern, the next leg could unfold once the short-term consolidation completes, making this an intriguing chart to watch for follow-through.
**Disclosure:** We are part of Trade Nation's Influencer program and receive a monthly fee for using their TradingView charts in our analysis.
$META | COVERAGE INITIATED — Personal Position Update [W49]COVERAGE INITIATED — Bullish Classification (Trend Shift Identified)
META — WEEK 49 TREND REPORT | 12/05/2025
Ticker: NASDAQ:META
Timeframe: W
This is a reactive structural classification based on the weekly chart as of this timestamp. Price conditions are evaluated as they stand — nothing here is predictive or forward-assumptive.
⸻
Author’s Note — Personal Position Update
I initiated my own position on [ NASDAQ:META ] during Week [ 49 ], entering at $ [ 673.42 ].
This decision follows my personal criteria: I only participate when my system identifies a verified structural trend shift supported by both a confirmed weekly flag and a qualifying candle state. This note reflects my activity only and is not a suggestion for anyone else.
As of this update, my position is currently up ~ [ 0% ] from my entry.
My structural exit level is $ [ 670.20 ] on a weekly-close basis. This level will continue to adjust upward automatically as the structure strengthens. If price closes below that threshold, my system classifies the trend as structurally compromised, and that is where I personally exit.
This update exists solely to document my own participation and the structural levels I monitor. It is not predictive and does not imply any future outcome.
⸻
Structural Integrity
• 1) Current Trend Condition [ Numbers to Watch ]
• Current Price @ $
• Trend Duration @ +0 Weeks
( Bullish )
• Trend Reversal Level ( Bearish ) @ $
• Trend Reversal Level ( Bearish Confirmation ) @ $
• Pullback Correction Retracement @ $
• Correction Structural Support @ $
⸻
2) Structure Health
• Retracement Phase:
Uptrend (operating above 78.6%)
• Position Status:
Caution (interacting with structural layers)
⸻
3) Temperature :
Warming Phase
⸻
4) Momentum :
Neutral
⸻
Structural Alignment
NEUTRAL STRUCTURAL CONDITION
This mark represents a period where directional behavior was unclear. Market movement here reflected compression, chop, or indecision — neither trend direction was dominant. It does not signal continuation or reversal, only that price action was not showing strong alignment in either direction.
⸻
Methodology Overview
This classification framework evaluates directional conditions using internal trend-interpretation logic that references price behavior relative to its structural layers. These relationships are used to identify when price movement aligns with the framework’s criteria for directional phases, transition points, or regime shifts. Visual elements or structural labels reflect these internal interpretations, rather than explicit trading signals or preset indicator crossovers. This framework is observational only and does not imply future outcomes.
