Meta - The major triangle rejection!💡Meta ( NASDAQ:META ) will reverse soon:
🔎Analysis summary:
Just a couple of months ago we witnessed a textbook all time high break and retest on Meta. This retest was followed by a major rejection higher and the second retest of the triangle resistance trendline. Therefore, Meta is very likely to create another rejection.
📝Levels to watch:
$750 and $500
SwingTraderPhil
SwingTrading.Simplified. | Investing.Simplified. | #LONGTERMVISION
Trade ideas

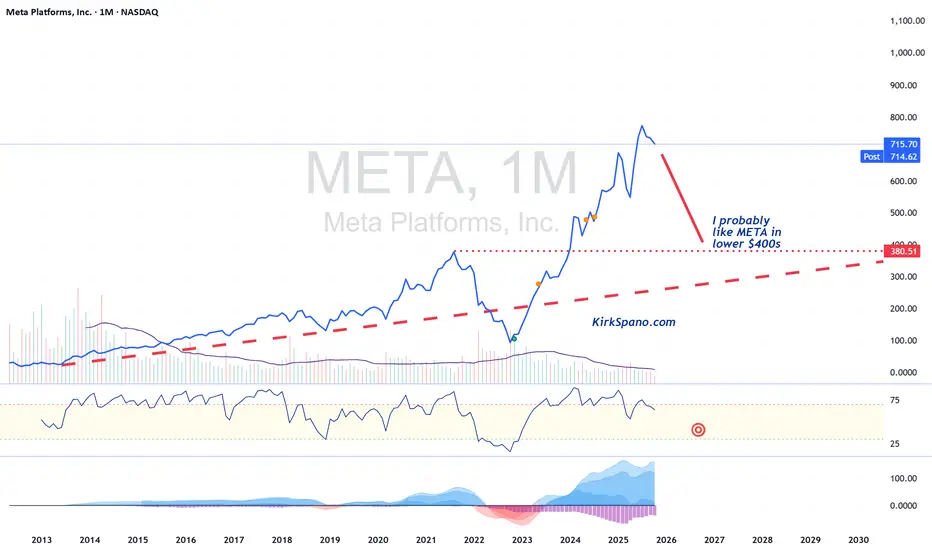
META Correction in 2026 I bought Facebook after their busted IPO and made about 5x and 10x on parts of my money. I should have held so I could have bought half of Wisconsin. My bad.
I don't love Zuck, but the public can't quit Facebook, or Instagram, or Messenger, or Whatsapp... and I think META is in the oligopoly of AI, VR & AR that is developing.
Mega caps are stretched and financing issues for AI will cause a hiccup at some point. I think 2026, year 2 of the Presidential cycle, is the year of hiccups.
I would buy META in the $400s - lower if there's a wider global credit crisis.
Meta is bumping against the February Selloff levelSellers in Meta on a huge up day. Worth to take a shot here...
META – Bearish Drift Toward Support | Potential Bounce SetupNASDAQ:META is still looking a touch bearish and may continue sliding toward its 200-day moving average. The price action suggests we’re not done with downside pressure just yet, especially as tech sentiment remains shaky. However, there’s a potential opportunity shaping up around a key support zone.
📌 Trade Setup
Looking for a bounce between $660 – $680, which has acted as a demand zone previously. This area also aligns with the 200-day MA, giving the level technical significance. If buyers step in here, we could see a short-term rally.
🎯 Targets & Risk Management
Entry Zone: $660 – $680
Take Profit: $725, $749
Stop Loss: Close below $659
Watching price action closely at the support zone—patience is key. A clean bounce with volume could trigger the next leg up.

Meta — Back to the FutureNASDAQ:META After testing the strong support zone around $707–710,
NASDAQ:META shows signs of a potential rebound — the same zone that triggered a rally in July.
Technical view:
• Price bounced from a high-volume area (VRVP) and closed above HMA(9) near $709.
• MACD lines are converging, suggesting a possible bullish crossover ahead.
• Next resistance levels: $729 → $743 → $785.
• As long as price stays above $710, the recovery scenario remains valid.
NASDAQ:META might be setting up for a multi-wave rebound toward the upper resistance zone —
a “Back to the Future” moment as bulls try to reclaim lost momentum.
⚠️ Key risk: prolonged consolidation below $710 could delay the move.

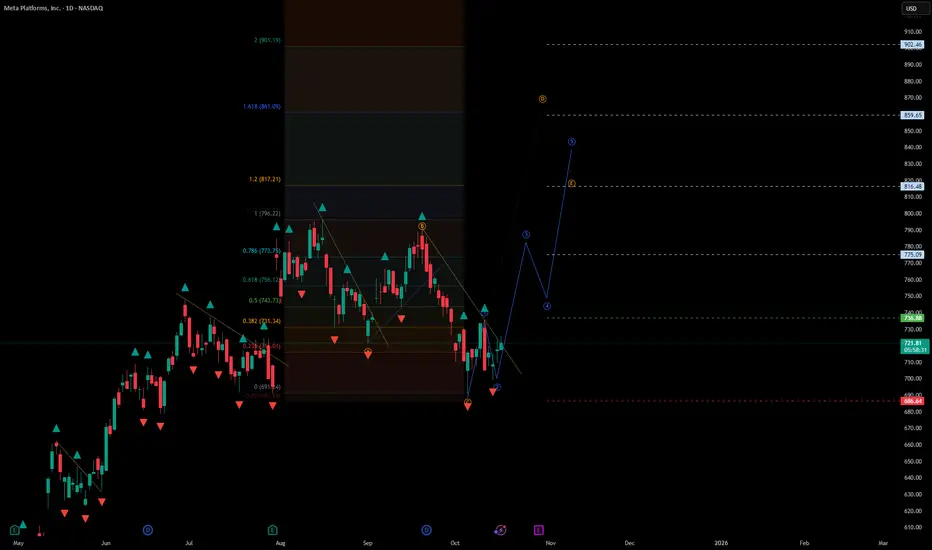
Meta – Recovery Structure and Bullish Continuation Setup#Meta – Recovery Structure and Bullish Continuation Setup
Current price: $723.2
Meta is building a bullish recovery structure after completing a corrective decline. The market is stabilizing near key support and may be preparing for a renewed upward leg within the larger trend.
🧩 Technical Overview
• The downtrend from the August high has likely formed a complete corrective pattern.
• Price rebounded from the $686–$690 support zone and is attempting to re-enter the mid-term ascending channel.
• Momentum has shifted from exhaustion to accumulation — typical for a trend-continuation setup.
📈 Scenario
• As long as the price holds above $686, the structure favors an upward move.
• Stop-loss: below $686, under the recent corrective low.
• Upside levels to watch:
– $736–$755 — early confirmation zone / local breakout test
– $775–$816 — key resistance area, mid-cycle confirmation
– $860–$902 — extended target range based on Fibonacci projections
• A daily close above $755 would confirm strength and continuation toward the higher targets.
⚙️ Market Context
• The broader NASDAQ structure supports recovery across large-cap tech stocks.
• Meta remains in a long-term bullish framework despite the recent correction.
• Volume behavior and market breadth show early signs of capital rotation back into growth assets.
🧭 Summary
Meta is forming a recovery leg after a controlled correction.
Holding above $686 keeps the bullish bias active, with first confirmation above $736 and major continuation signals over $755.
Targets for the next impulse are projected near $816, $860, and potentially $900+.
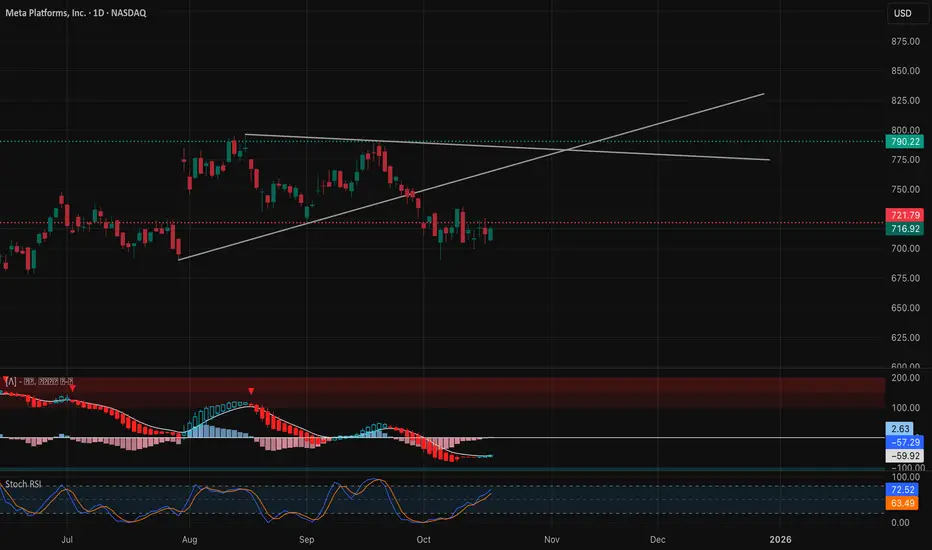
META – Testing the $717 Reversal Zone: Oct 21-25Will Bulls Reclaim Control or Lose Ground? 🔥
🟩 Daily Timeframe – Macro Market Structure
META remains in a mid-term corrective phase inside a broader bullish structure that began in early summer. After topping around $820, price broke its ascending trendline and has since been consolidating between $716 support and $790 resistance.
The daily structure shows a descending wedge pattern forming within that range — a potential base-building setup if buyers can reclaim momentum. The MACD histogram is negative but contracting, showing the bearish momentum is starting to fade. Stoch RSI has lifted off the oversold region, hinting at the start of a possible momentum reset.
Smart money likely absorbed liquidity around $710–$720, and if bulls can defend that pocket, we could see a mean-reversion move toward $760–$775. A break below $705 would invalidate this recovery scenario and confirm continued distribution toward $685.
🟦 1-Hour Timeframe – Short-Term Structure and Momentum
On the 1-hour chart, META shows a tactical CHoCH → BOS sequence, confirming the first bullish shift since last week’s low near $698–$700. Price reclaimed the short-term structure with a BOS at $712, and is now consolidating just under $717–$725, the next liquidity pocket where sellers previously stepped in.
Key intraday dynamics:
* 9 EMA is curling upward above the 21 EMA, confirming a mild bullish bias.
* MACD histogram flipped positive with rising momentum, but still early in development.
* RSI trending toward 60, suggesting momentum buildup but not yet overextended.
For this week, $712 serves as a pivot: holding above it keeps structure bullish; slipping below reopens downside back to $705. Upside continuation requires a strong hourly close above $725, unlocking room toward $735–$740.
🟨 15-Minute Timeframe – Intraday Structure and Scalping Levels
META’s 15-minute chart paints a clear picture of short-term liquidity rotation. Several CHoCH and BOS events occurred between $706–$717, forming a rising intraday channel. The most recent BOS at $716 established a new higher-high sequence, but a small CHoCH appeared right after, hinting at local exhaustion.
* Momentum via MACD is flattening after a solid run — possible micro pullback ahead.
* Stoch RSI dipping from the upper band, showing cooling intraday momentum.
* Key zones: $712.5–$714 short-term support, $717.5–$725 resistance box.
If bulls can defend $714 and reclaim $717.5 with volume, expect a quick extension to $725+. A failure here could reset the range and sweep liquidity back toward $707 before any renewed rally attempt.
🟥 GEX (Gamma Exposure) & Options Sentiment – Dealer Positioning Map
Gamma data aligns perfectly with META’s price compression setup:
* Highest positive gamma / call resistance: $735–$740 → strong dealer sell pressure overhead.
* Highest negative gamma / put support: $705 → dealers likely to buy into dips.
* Call walls: $720–$735, layering multiple gamma bands that could slow breakout attempts.
* Put walls: $690–$680, matching the broader liquidity shelf from October lows.
* Max Pain: roughly $715, suggesting potential mid-week magnet as volatility compresses.
With IVR 43.1 and IVx slightly below average (−3.3%), implied volatility remains subdued, meaning a coiling market is forming before the next catalyst. Dealers are slightly long gamma, so early-week dips may get absorbed while rallies above $725 could face mechanical selling.
Strategic plays:
* Scalpers: Favor long setups on $714 rebounds → target $725.
* Directional traders: Look for breakout confirmation above $725 → target $735–$740.
* Options traders: Iron condors or debit spreads between $710–$730 fit the current GEX profile.
🎯 Trade Scenarios
Bullish Setup 🟢
* Entry: Above $717.5–$718.5 on confirmation candle.
* Targets: $725 → $735.
* Stop-loss: Below $711.
* Bias confirmation: MACD expansion + RSI > 60 on 15M & 1H.
Bearish Setup 🔴
* Entry: On rejection from $725–$730 or breakdown below $711–$712.
* Targets: $705 → $690.
* Stop-loss: Above $727.
* Confluence: MACD turning negative + RSI < 45 with 9 EMA crossing below 21 EMA.
🧭 Closing Outlook – Week of Oct 21–25
META enters the week in sideways accumulation, hovering just above key liquidity at $712. With gamma support below and call walls overhead, the market is in a coiled spring state.
If bulls defend $711–$714, we may see a measured breakout attempt toward $735–$740 later in the week. Failure to reclaim $717 with volume, however, would likely drag the stock back to retest $705–$698 before finding real demand again.
Personally, I’m watching for fake sweeps around $712–$714 — if liquidity traps trigger here, that could be the ignition point for a short-covering rally.
Disclaimer:
This analysis is for educational purposes only and does not constitute financial advice. Always perform your own due diligence and trade responsibly.
Derivatives Are Powerful in the Global MarketIntroduction
In the vast and intricate world of finance, derivatives stand out as some of the most powerful and influential instruments driving global markets. These complex financial contracts derive their value from the performance of underlying assets such as stocks, bonds, commodities, interest rates, currencies, or market indices. Over the past few decades, derivatives have transformed the global financial landscape, enabling investors, corporations, and governments to manage risk, enhance returns, and access new opportunities. However, their complexity and leverage potential have also made them subjects of controversy, as they can amplify both gains and losses. This essay explores the nature of derivatives, their types, their importance in the global market, and how they influence international trade, investment, and financial stability.
Understanding Derivatives
The term derivative originates from the word “derive,” meaning that the instrument’s value is dependent on something else. In essence, a derivative is a financial contract whose value is based on the price of an underlying asset. Derivatives are typically used for three main purposes: hedging, speculation, and arbitrage.
Hedging:
Hedgers use derivatives to reduce or eliminate the risk of price fluctuations in the underlying asset. For example, a wheat farmer might use futures contracts to lock in the selling price of wheat months before the harvest, ensuring income stability despite potential market volatility.
Speculation:
Speculators, on the other hand, use derivatives to profit from expected changes in the market value of the underlying asset. They do not necessarily own the asset but anticipate price movements to gain from them.
Arbitrage:
Arbitrageurs use derivatives to profit from price discrepancies between markets or instruments. They buy in one market and sell in another to take advantage of temporary inefficiencies.
Types of Derivatives
Derivatives can be traded either on exchanges (standardized and regulated) or over-the-counter (OTC) (customized and privately negotiated). The four main types of derivatives are:
Futures Contracts:
Futures are standardized agreements to buy or sell an asset at a predetermined price on a specific date in the future. They are widely used for commodities like oil, gold, and agricultural products, as well as for financial assets.
Forward Contracts:
Forwards are similar to futures but are privately negotiated between two parties and not traded on an exchange. They are customizable in terms of quantity, price, and settlement date.
Options Contracts:
Options give the holder the right, but not the obligation, to buy (call option) or sell (put option) an underlying asset at a predetermined price before or on a certain date. They are powerful tools for both hedging and speculative strategies.
Swaps:
Swaps involve the exchange of cash flows between two parties, often based on different financial instruments. The most common types are interest rate swaps, currency swaps, and credit default swaps (CDS).
Growth of the Global Derivatives Market
The global derivatives market has grown exponentially since the 1980s. Today, it represents a notional value of hundreds of trillions of dollars, making it one of the largest components of the financial system. The expansion has been driven by globalization, technological innovation, financial liberalization, and the growing need for risk management tools among corporations and investors.
According to data from the Bank for International Settlements (BIS), the notional amount of OTC derivatives alone exceeds $600 trillion. Exchange-traded derivatives (ETDs) are also massive, with daily volumes in futures and options numbering in the millions. This growth reflects the increasing reliance of global market participants on derivatives to manage exposure to interest rates, currencies, commodities, and equity prices.
Derivatives as Tools for Risk Management
One of the most significant contributions of derivatives to the global market is risk management. Businesses and investors face various forms of risk—price, interest rate, credit, and currency risk—that can affect profitability and stability. Derivatives provide mechanisms to transfer or mitigate these risks.
Currency Risk:
Multinational corporations use currency forwards and swaps to hedge against fluctuations in foreign exchange rates. For example, an Indian exporter earning in U.S. dollars can use derivatives to lock in exchange rates and protect revenue from depreciation of the dollar.
Interest Rate Risk:
Banks and companies use interest rate swaps to manage exposure to changing interest rates. By exchanging fixed-rate and floating-rate payments, they can stabilize financing costs or returns.
Commodity Price Risk:
Producers and consumers of commodities use futures contracts to secure prices. Airlines, for example, use oil futures to hedge against rising fuel prices, ensuring predictable operating costs.
Through these mechanisms, derivatives contribute to financial stability by providing certainty and predictability in cash flows, even in volatile environments.
Enhancing Liquidity and Market Efficiency
Derivatives play a vital role in improving market liquidity and efficiency. By enabling investors to take positions without directly trading the underlying asset, derivatives increase the depth of the market. For instance, stock index futures and options allow investors to gain or hedge exposure to entire markets without trading individual stocks. This efficiency attracts institutional investors and promotes active participation across global exchanges.
Moreover, derivatives markets facilitate price discovery—the process of determining the fair value of an asset. The continuous trading of futures and options reflects the collective expectations of market participants about future price movements. This helps align prices across markets and reduces information asymmetry.
Speculation and Profit Opportunities
While derivatives are often used for hedging, they are equally attractive to speculators seeking to profit from market volatility. The leverage embedded in derivatives allows traders to control large positions with relatively small capital. For instance, buying an option requires only a fraction of the cost of the underlying asset, but potential profits (and losses) can be substantial.
Speculative trading, when done responsibly, enhances market liquidity and efficiency. Speculators absorb risk from hedgers, providing them with the counterparties necessary for risk transfer. However, excessive speculation can lead to bubbles or destabilizing volatility, as witnessed during the 2008 global financial crisis.
Derivatives in Global Financial Integration
Derivatives are at the heart of global financial integration. They connect markets across continents and allow capital to flow more freely. Through currency and interest rate swaps, international investors can manage cross-border risks and invest in foreign markets with confidence.
Global corporations rely on derivatives to operate efficiently in multiple countries. For example, a U.S.-based company investing in European projects might use currency forwards to hedge euro exposure, while using interest rate swaps to adjust financing costs in line with U.S. benchmarks. This interconnected web of derivative transactions supports global trade and investment, making derivatives indispensable to modern globalization.
Derivatives and the 2008 Financial Crisis
Despite their benefits, derivatives have also been associated with systemic risks. The 2008 financial crisis exposed the darker side of derivative misuse, particularly in the credit derivatives market. Instruments like credit default swaps (CDS) were used to insure against default risk on mortgage-backed securities. However, the complexity and opacity of these products led to massive losses when underlying assets (subprime mortgages) collapsed.
Institutions like Lehman Brothers and AIG faced devastating losses due to excessive exposure and inadequate risk management. The crisis revealed the dangers of leverage, interconnectedness, and lack of transparency in OTC derivatives markets.
In response, regulators introduced reforms such as central clearinghouses, higher capital requirements, and reporting obligations to enhance oversight and reduce systemic risk. These measures have made today’s derivatives markets more transparent and resilient.
Technological Advancements and Derivatives Trading
Technology has revolutionized the way derivatives are traded globally. The rise of electronic trading platforms, algorithmic trading, and blockchain technology has enhanced speed, transparency, and efficiency in derivatives markets. Exchange-traded derivatives are now accessible to a broader range of participants, from institutional investors to retail traders.
Moreover, the introduction of financial derivatives based on new asset classes—such as cryptocurrencies, carbon credits, and volatility indices—has expanded the frontier of derivative innovation. For instance, Bitcoin futures and options have allowed institutional investors to manage crypto exposure while maintaining compliance with regulatory standards.
Derivatives and Emerging Markets
In emerging economies like India, China, and Brazil, derivatives markets have become critical components of financial development. They offer mechanisms for managing currency volatility, commodity prices, and interest rate fluctuations—issues that are often more pronounced in developing nations.
India’s National Stock Exchange (NSE) and Bombay Stock Exchange (BSE) have developed vibrant derivatives markets, particularly in index futures and options. These instruments attract global investors and contribute to capital market growth, making emerging markets more integrated into the global financial ecosystem.
Challenges and Risks in the Derivatives Market
Despite their power, derivatives come with inherent risks that must be carefully managed:
Leverage Risk:
Small changes in the price of the underlying asset can result in large gains or losses due to leverage.
Counterparty Risk:
In OTC markets, the risk that one party defaults on the contract can lead to cascading failures.
Liquidity Risk:
In times of market stress, derivative positions may become difficult to unwind, leading to forced losses.
Complexity:
Some derivatives are highly complex and difficult to value, making them prone to misuse.
Systemic Risk:
The interconnected nature of derivatives markets can transmit shocks across institutions and borders, threatening global financial stability.
Regulation, transparency, and proper risk management are therefore essential to harnessing the benefits of derivatives without endangering the system.
The Future of Derivatives in the Global Market
Looking ahead, derivatives are likely to play an even greater role in shaping the future of finance. The rise of environmental, social, and governance (ESG) investing has led to new forms of derivatives such as carbon emission futures and climate swaps, designed to manage sustainability-related risks. Likewise, AI-driven analytics and machine learning models are being used to optimize derivative pricing, risk management, and trading strategies.
As the global economy becomes increasingly interconnected and digitized, derivatives will continue to serve as vital tools for managing uncertainty, improving liquidity, and enhancing market efficiency.
Conclusion
Derivatives are undeniably powerful instruments in the global market. They enable participants to manage risk, speculate efficiently, and facilitate cross-border capital flows. By enhancing liquidity, supporting price discovery, and integrating global markets, derivatives have become indispensable to modern finance. Yet, their power demands responsibility; misuse can have catastrophic consequences, as history has shown.
With sound regulation, technological innovation, and prudent risk management, derivatives can continue to drive global financial progress—empowering businesses, investors, and economies to navigate the complex landscape of the 21st-century marketplace with greater stability and precision.

Global Market Crises, Emerging Market, and Systemic InvisibilityIntroduction
The global financial landscape is an intricate web of interdependence, where economies—both developed and emerging—are bound together through trade, capital flows, and investment channels. When a crisis erupts in one segment of this system, the ripple effects can destabilize the entire network. Global market crises, therefore, are not isolated events but collective shocks that reveal deep structural vulnerabilities in international finance. Emerging markets, which often serve as both beneficiaries and victims of globalization, find themselves particularly exposed to such turmoil. An underlying aspect of these crises is systemic invisibility—the inability to perceive, predict, or regulate risks that accumulate beneath the surface of financial and economic systems.
This essay explores the nature of global market crises, the role and vulnerability of emerging markets, and the concept of systemic invisibility that exacerbates instability. It discusses historical precedents, theoretical insights, and modern implications for a world driven by financial integration.
1. Understanding Global Market Crises
A global market crisis refers to a widespread and synchronized downturn in financial markets that transcends national boundaries. These crises typically involve severe declines in asset prices, widespread credit contractions, capital flight, and loss of investor confidence. The interconnectedness of global finance—through trade, investment, and technology—means that localized shocks can escalate into systemic failures.
Causes of Global Market Crises
Financial Deregulation and Excessive Leverage:
The liberalization of financial markets since the 1980s encouraged speculative investments and excessive risk-taking. When leverage ratios increase beyond sustainable levels, minor market corrections can lead to massive defaults.
Asset Bubbles and Speculative Behavior:
Asset bubbles—such as those seen in housing or stock markets—form when asset prices deviate significantly from their intrinsic value. The bursting of these bubbles often triggers market collapses, as witnessed during the 2008 Global Financial Crisis.
Monetary Policy and Liquidity Traps:
Loose monetary policies can flood markets with cheap credit, inflating bubbles in emerging economies. Conversely, abrupt tightening of monetary conditions, as seen during the U.S. Federal Reserve’s rate hikes, can lead to capital outflows from developing nations.
Technological and Algorithmic Amplification:
High-frequency trading, algorithmic systems, and digital currencies have introduced new layers of complexity. While enhancing efficiency, they also amplify volatility, making markets more prone to sudden crashes.
Geopolitical Risks and Global Shocks:
Conflicts, pandemics, and trade wars—such as the COVID-19 pandemic and Russia-Ukraine conflict—exert profound impacts on commodity markets, supply chains, and investor sentiment, triggering widespread economic disruptions.
2. The Role and Vulnerability of Emerging Markets
Emerging markets (EMs) are countries transitioning from developing to developed status, characterized by rapid industrialization, growing financial systems, and expanding middle classes. While they present attractive investment opportunities due to high growth potential, they are also more susceptible to global volatility.
Economic and Financial Linkages
Emerging markets are deeply integrated into the global economy through trade, foreign direct investment (FDI), and portfolio flows. They rely heavily on exports, often of commodities, and on foreign capital to finance infrastructure and industrial growth. This dependency makes them sensitive to global demand shifts and interest rate changes in advanced economies.
Types of Vulnerabilities
Currency Instability:
When global investors retreat from riskier assets, EM currencies often depreciate sharply, increasing the cost of foreign-denominated debt. The Asian Financial Crisis (1997–98) is a classic example, where speculative attacks on currencies led to economic collapses across Southeast Asia.
Debt Dependency:
Many emerging economies accumulate external debt to fund development projects. When global liquidity tightens, servicing this debt becomes difficult, leading to sovereign defaults—seen in countries like Argentina, Sri Lanka, and Zambia.
Commodity Dependence:
Export revenues in countries like Brazil, South Africa, and Indonesia are tied to commodity prices. Global crises that reduce demand or disrupt trade channels directly hit fiscal stability.
Capital Flight and Investor Panic:
In times of global uncertainty, investors withdraw funds from emerging markets and move to “safe havens” like U.S. Treasury bonds or gold. This sudden stop in capital inflows can paralyze domestic economies.
Weak Regulatory Frameworks:
Emerging markets often lack robust financial oversight and institutional capacity, making them more exposed to systemic risks and contagion effects.
3. Systemic Invisibility: The Hidden Dimension of Global Crises
“Systemic invisibility” refers to the hidden accumulation of risks and imbalances within the global financial system that remain unnoticed until they culminate in a crisis. It represents the gap between perceived stability and underlying fragility.
Dimensions of Systemic Invisibility
Hidden Leverage and Shadow Banking:
The rise of non-bank financial institutions (NBFIs), such as hedge funds, private equity, and shadow lenders, has created a vast web of credit intermediation outside traditional regulatory frameworks. Risks hidden in these opaque structures can destabilize markets without warning.
Data Blind Spots and Complexity:
The scale and complexity of global finance make it nearly impossible to capture real-time systemic exposures. Cross-border derivatives and off-balance-sheet transactions obscure the true level of financial risk.
Policy Illusion and Delayed Recognition:
Policymakers often fail to detect systemic risks due to political incentives, limited data transparency, or overreliance on outdated models. For example, before 2008, regulators believed that financial innovation had made markets more efficient and stable—until the crisis revealed the opposite.
Market Psychology and Herd Behavior:
Investor sentiment can create a collective illusion of stability. When confidence erodes, the same herd behavior amplifies panic, leading to cascading collapses.
Technological Obscurity:
The digitalization of finance through cryptocurrencies, decentralized finance (DeFi), and AI-driven trading has introduced new forms of invisibility. Risks embedded in decentralized systems can spread rapidly across borders without regulatory control.
Consequences of Systemic Invisibility
Systemic invisibility contributes to delayed crisis response, ineffective regulation, and disproportionate impacts on vulnerable economies. It erodes trust in financial institutions, amplifies inequality, and undermines global governance mechanisms. Most critically, it blinds both policymakers and investors to the real nature of interconnected risks.
4. Historical Lessons: Crisis Patterns and Emerging Markets
A historical overview demonstrates how global crises repeatedly expose systemic invisibility and emerging market vulnerabilities:
The Latin American Debt Crisis (1980s):
Fueled by cheap credit from Western banks, Latin American nations borrowed heavily in the 1970s. When U.S. interest rates rose, debt-servicing costs exploded, leading to widespread defaults. The crisis revealed the hidden fragility of debt-driven growth models.
The Asian Financial Crisis (1997–98):
Overleveraged banking systems, fixed exchange rates, and speculative capital inflows created a bubble of false stability. Once investor confidence evaporated, currencies and stock markets collapsed, illustrating how systemic invisibility masked risks until it was too late.
The Global Financial Crisis (2008):
The collapse of the U.S. subprime mortgage market exposed interconnected risks in global finance. Complex derivatives (like CDOs) spread hidden exposures worldwide. Emerging markets initially seemed insulated but soon faced capital reversals and export contractions.
The COVID-19 Pandemic (2020):
The pandemic triggered an unprecedented global market shock, highlighting how health crises can morph into financial ones. Liquidity freezes and capital flight hit emerging economies, while global supply chain dependencies revealed systemic blind spots.
5. Interconnectedness and Contagion Dynamics
In the modern financial ecosystem, crises spread through contagion—the transmission of shocks across markets and borders. Emerging markets, often at the periphery of global capital networks, become the first casualties when systemic stress arises.
Channels of Contagion
Financial Channel:
Global investors adjust portfolios simultaneously, leading to asset selloffs and currency depreciation in EMs.
Trade Channel:
A slowdown in global demand reduces exports, weakening current accounts and employment.
Confidence Channel:
Perceived risk in one region can lead to capital withdrawals elsewhere, regardless of fundamentals.
Policy Channel:
Central banks in emerging economies often follow global monetary trends. When the U.S. Federal Reserve raises rates, EMs face inflationary pressures and capital flight, limiting policy autonomy.
6. Addressing Systemic Invisibility and Strengthening Resilience
Building resilience against global market crises requires addressing the hidden vulnerabilities that perpetuate systemic invisibility. Key strategies include:
Enhanced Financial Transparency:
Global institutions like the IMF, World Bank, and Financial Stability Board (FSB) must strengthen surveillance of cross-border capital flows, derivatives, and shadow banking activities.
Macroprudential Regulation:
Countries should adopt countercyclical capital buffers, debt limits, and liquidity requirements to contain leverage buildup.
Diversified Economic Structures:
Emerging markets should diversify exports and reduce dependency on commodity cycles and external financing.
Digital Risk Oversight:
Regulators must develop frameworks to monitor fintech, crypto assets, and algorithmic trading systems that contribute to hidden risks.
Regional Safety Nets:
Mechanisms such as swap lines, contingent reserve arrangements, and regional development banks can provide liquidity support during crises.
Global Cooperation:
Crises are inherently transnational; therefore, coordination among central banks, international institutions, and governments is essential for pre-emptive action.
7. The Future of Emerging Markets in a Fragmented World
As the global economy becomes increasingly multipolar—with power shifting toward Asia, Africa, and Latin America—emerging markets will play a greater role in shaping financial stability. However, systemic invisibility will continue to pose risks, especially in a world characterized by digital finance, geopolitical fragmentation, and climate-related shocks.
The future will depend on how effectively emerging economies balance openness with resilience. The ability to identify and manage hidden systemic risks will determine whether globalization continues to be a driver of shared prosperity or a source of recurring crises.
Conclusion
Global market crises reveal the inherent fragility of an interconnected financial system. Emerging markets, though engines of growth, remain vulnerable to external shocks due to structural dependencies and limited regulatory capacity. The concept of systemic invisibility captures the unseen dimensions of modern finance—the risks buried beneath data opacity, technological complexity, and institutional inertia.
To prevent future crises, the world must embrace transparency, cooperation, and adaptive regulation. Only by making the invisible visible can policymakers, investors, and societies navigate the uncertainties of a globalized financial order. The stability of emerging markets—and indeed, the global economy—depends on illuminating the hidden forces that shape systemic risk.
METAs Short Target At $630🔱 The Cracks Are Showing 🔱
🏦 Let’s talk fundamentals.
The biggest storm cloud hanging over META right now? Regulation — in both the EU and the U.S. If fines or compliance costs ramp up, profits get squeezed and strategy shifts become inevitable.
👉 Competition is biting too. New apps are stealing attention, and every second users spend elsewhere chips away at Meta’s moat.
⚠️ Then there’s the AI spending spree. Billions are burning to build infrastructure, but if those bets don’t pay off fast, margins will bleed.
Add growing media pressure — from content moderation to child safety — and you’ve got a brand walking through a minefield of reputational risk.
📈 Now, look at the chart.
The price has fallen below the Centerline. That’s not noise — that’s a message. It’s a classic short signal.
Before the drop, we saw price action stall again and again at the upper quarter line. That’s not random congestion. That’s distribution — the big whales quietly unloading while everyone else was still bullish.
Then came the pullback to the Centerline. followed by a weak close. Translation: buyers are drying up.
💰 Target? $630 at the L-MLH. With smart position sizing, this could be a sweet Christmas trade.

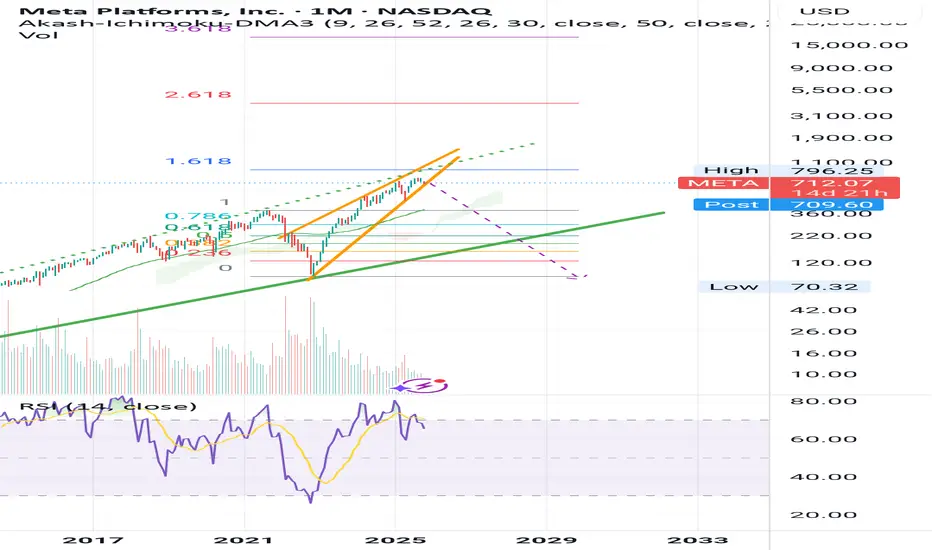
META - A date with 900 USDAfter the date of approx the 1.618 fib extension, the bear channel is complete and it breaks down
(The dotted green line is a prediction)
Not financial advice
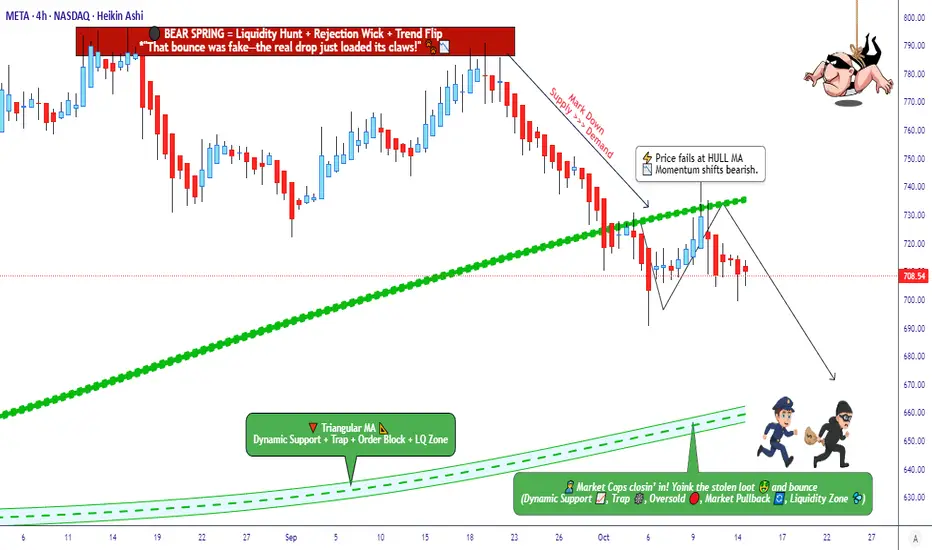
META Platforms Chart – Technical Reversal Signals Sell Momentum🎯 META's Bearish Heist: Time to Rob the Bears' Bank! 💰
📊 Asset Overview
META PLATFORMS, INC - The social media giant is about to get socially distanced from higher prices!
🔍 Market Analysis
Current Setup: Bearish Momentum Confirmed ⚠️
The Hull Moving Average just broke down like my New Year's resolutions! 🐻 Bears have grabbed the steering wheel and they're driving this bus downhill. The technical setup is screaming "SHORT" louder than your stop loss alerts at 3 AM.
🎭 The "Thief Strategy" Game Plan
🎯 Entry Strategy: Layer Like a Pro
The Layered Limit Order Approach (because catching falling knives is for amateurs!)
Layer 1: $740 🎯
Layer 2: $730 🎯
Layer 3: $720 🎯
Layer 4: $710 🎯
You can add more layers based on your risk appetite and portfolio size. Think of it as building a profit sandwich - the more layers, the tastier! 🥪
Alternative: Direct market entry at current price levels (for the adrenaline junkies among us)
🛡️ Risk Management
🚨 Stop Loss: $760
⚠️ IMPORTANT NOTE: Dear Thief OG's (Ladies & Gentlemen),
This is MY stop loss level based on my risk tolerance. This is NOT a recommendation - you MUST set your own stop loss based on YOUR risk management rules. Trade at your own risk, secure your own bag! 💼
🎯 Profit Target
💎 Target: $660
Why $660?
✅ Triangular Moving Average acting as Fort Knox-level support
✅ Oversold conditions brewing like a perfect storm
✅ Bull trap zone where buyers might step in
✅ Technical barricade stronger than a police checkpoint 🚓
⚠️ IMPORTANT NOTE: Dear Thief OG's,
This is MY take profit level. You can exit whenever you want - secure those gains at YOUR comfort zone. Take profits when you're happy, not when I tell you! Your money, your rules. 💵
📈 Related Pairs to Watch
Keep your eyes on these correlated assets:
🔗 NASDAQ:GOOGL - Fellow tech giant showing similar bearish pressure
🔗 NASDAQ:AAPL - Tech sector leader; weakness here confirms broader tech selloff
🔗 NASDAQ:MSFT - Big tech correlation play
🔗 NASDAQ:AMZN - FAANG/Magnificent 7 correlation
🔗 NASDAQ:QQQ - Nasdaq ETF; META's moves often mirror tech sector sentiment
Key Correlation: When META sneezes, social media stocks catch a cold! Watch NYSE:SNAP and NYSE:PINS for sympathy plays.
🎪 The Thief Style Philosophy
This isn't your grandpa's trading strategy - we're playing chess while others play checkers! ♟️ The "Thief" approach uses strategic layering to maximize entry opportunities while managing risk like a boss.
Remember: We're not thieves in the literal sense - we're just stealing profits from the market inefficiencies! 😎
📊 Technical Summary
✅ Hull MA Breakdown Confirmed
✅ Bearish Momentum Building
✅ Multiple Technical Resistance Overhead
✅ Risk-Reward Ratio Favoring Shorts
✨ If you find value in my analysis, a 👍 and 🚀 boost is much appreciated — it helps me share more setups with the community!
#META #MetaPlatforms #StockMarket #SwingTrading #DayTrading #TechnicalAnalysis #BearishSetup #ShortSetup #HullMovingAverage #ThiefStrategy #LayeredEntry #RiskManagement #TradingStrategy #StockTrading #MarketAnalysis #TradingIdeas #TradingView #FAANG #TechStocks #BearishMomentum
#META healthy correctionBased on my analysis, I believe META will likely correct down to the $675 area, after which we should look for fresh signs of a potential reversal.

Meta - Faces away from the top=======
Volume
=======
-neutral
==========
Price Action
==========
- Double top and bearish flag noticed
- Weak buying pressure
- broken out of 6 months downtrend line
=================
Technical Indicators
=================
- Ichimoku
>>> price below cloud
>>> Red kumo budding
>>> Tenken + Chiku - below clouds
>>> Kijun - within clouds and moving away
=========
Oscillators
=========
- MACD still bearish
- DMI bearish
- StochRSI, bearish and sloping down
=========
Conclusion
=========
- short to long term breakout swing
- price may reverse at current level, to enter spot or wait for pullback at entry 2.

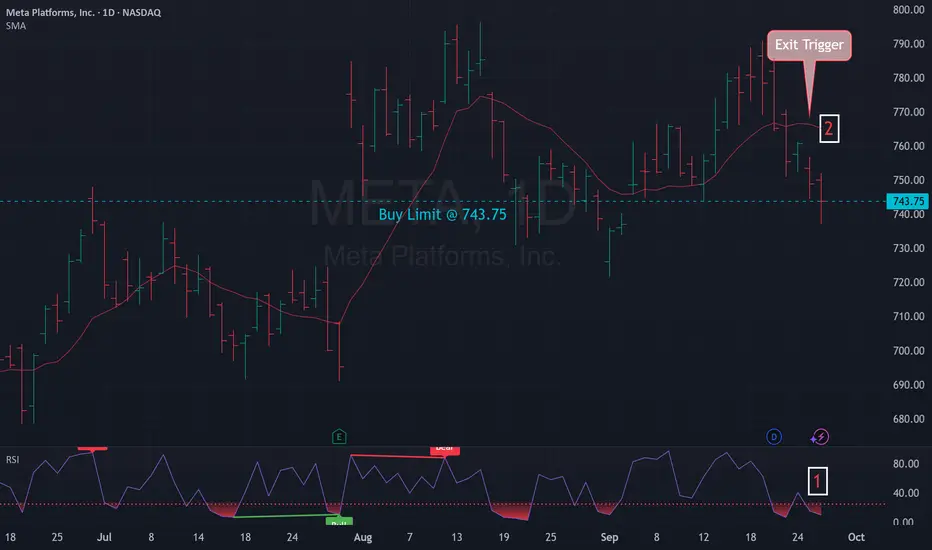
Mean Reversion Setup: META1. RSI in oversold region
2. Price likely to rebound back the the mean
Trade Rules:
Entry Trigger - RSI has cross below oversold region, enter limit buy at close price
Exit Trigger - Close at market when close price cross above exit trigger (Red Line)
The Dynamics of the Global Metals MarketIntroduction
The metals market plays a fundamental role in the global economy, serving as the backbone of industrial production, infrastructure development, technological innovation, and trade. From construction and automotive manufacturing to electronics and renewable energy systems, metals such as iron, copper, aluminum, nickel, and precious metals like gold and silver are indispensable. The metals market operates through a complex network of producers, traders, investors, and consumers, driven by global supply-demand dynamics, price fluctuations, and geopolitical influences.
Understanding how the metals market works requires examining the intricate mechanisms that govern mining, refining, pricing, trading, and consumption. This essay explores the structure, participants, and economic functions of the global metals market, with special emphasis on commodity exchanges, price formation, market trends, investment dynamics, and the influence of global factors such as industrialization, technological change, and sustainability transitions.
1. Structure of the Global Metals Market
1.1 Primary and Secondary Metals Markets
The metals market can be broadly categorized into two segments — the primary market, which deals with newly mined and refined metals, and the secondary market, which focuses on recycled or scrap metals.
Primary Metals Market:
The primary market begins with mining operations where raw ores are extracted from the earth. These ores undergo processing and refining to produce pure metals or alloys. The primary market includes large-scale mining corporations such as BHP, Rio Tinto, and Vale, which dominate global production of metals like iron ore, copper, and aluminum.
Secondary Metals Market:
The secondary market handles recycling and reprocessing of scrap metals. It plays a critical role in promoting sustainability and reducing the carbon footprint of the metals industry. For example, recycled aluminum requires only about 5% of the energy needed to produce new aluminum from bauxite ore.
1.2 Classification by Metal Type
Metals are also classified into three categories based on their properties and uses:
Base Metals: Common metals such as copper, aluminum, zinc, lead, and nickel. These are widely used in construction, manufacturing, and energy.
Precious Metals: Metals like gold, silver, platinum, and palladium, valued for rarity, aesthetic appeal, and use as a store of value.
Ferrous and Non-Ferrous Metals: Ferrous metals contain iron (e.g., steel, cast iron), while non-ferrous metals do not (e.g., copper, aluminum, tin). Ferrous metals dominate in heavy industries, while non-ferrous metals are vital in electrical and transportation sectors.
2. Key Participants in the Metals Market
The metals market involves diverse participants with different roles, motivations, and time horizons. These include:
2.1 Producers
Producers are mining and refining companies responsible for the extraction and processing of metal ores. They include global giants like Glencore, Rio Tinto, BHP, and Norilsk Nickel. Producers influence market supply levels, production costs, and long-term investment trends.
2.2 Consumers
Consumers of metals include manufacturing industries such as:
Construction (steel, aluminum)
Automotive (steel, nickel, aluminum)
Electronics (copper, gold, silver)
Energy (copper, nickel, lithium for batteries)
China is the world’s largest consumer of metals, accounting for over 50% of global demand for key industrial metals due to its rapid industrialization and urbanization.
2.3 Traders and Intermediaries
Traders facilitate the buying and selling of metals on global commodity exchanges. They include physical traders (handling actual shipments) and financial traders (speculating through derivatives such as futures and options). Major trading hubs include London, New York, Shanghai, and Singapore.
2.4 Investors and Speculators
Investment funds, hedge funds, and retail investors participate in metals markets for diversification or speculative purposes. They use financial instruments such as exchange-traded funds (ETFs), futures contracts, and options to gain exposure to metal prices.
2.5 Governments and Regulators
Governments play a key role through regulation, taxation, export controls, and strategic reserves. For example, China’s control over rare earth metals impacts global supply chains, while the U.S. maintains a strategic stockpile of critical minerals for defense and technology.
3. Mechanisms of Metal Trading
3.1 Physical Market vs. Paper Market
The metals market operates through two interconnected segments:
Physical Market: Involves the actual buying, selling, and shipment of metals in various forms — ingots, sheets, rods, or concentrates. Pricing is based on spot market rates.
Paper Market: Involves financial contracts such as futures, forwards, and options that represent a promise to deliver or receive a metal at a future date. These are traded on exchanges like the London Metal Exchange (LME), Chicago Mercantile Exchange (CME), and Shanghai Futures Exchange (SHFE).
3.2 Commodity Exchanges
The London Metal Exchange (LME) is the world’s largest market for base metals trading. It sets global benchmark prices for metals such as copper, aluminum, and zinc. Trading occurs through:
Ring trading (open outcry),
Electronic trading, and
Over-the-counter (OTC) contracts.
Each exchange provides transparency, liquidity, and standardized contracts that enable producers, consumers, and investors to hedge against price risks.
3.3 Price Discovery and Benchmarking
Metal prices are determined by global supply and demand but are standardized through benchmark pricing. LME prices often serve as global benchmarks. Prices are influenced by:
Mining output
Industrial demand
Energy costs
Inventory levels
Geopolitical events
Currency fluctuations (especially the U.S. dollar)
4. Price Formation and Market Influences
4.1 Supply-Side Factors
Mining Output and Reserves: Mining disruptions due to strikes, natural disasters, or regulatory issues can reduce supply.
Energy Costs: Metal production is energy-intensive; fluctuations in oil and electricity prices directly affect costs.
Technological Advancements: Innovations in mining and recycling improve efficiency and lower production costs.
4.2 Demand-Side Factors
Industrialization and Infrastructure: Economic growth in developing countries increases demand for steel, copper, and aluminum.
Technology and Electrification: The rise of electric vehicles (EVs) and renewable energy systems has boosted demand for copper, nickel, and lithium.
Consumer Preferences: Shifts toward sustainable and green technologies influence metal consumption patterns.
4.3 Macroeconomic and Financial Factors
Interest Rates and Inflation: Metals often serve as inflation hedges; high inflation or low interest rates drive investment demand.
Currency Movements: Metals are priced in U.S. dollars, so a weaker dollar generally boosts metal prices.
Global Trade Policies: Tariffs, export bans, and sanctions can distort trade flows and pricing.
4.4 Geopolitical and Environmental Influences
Geopolitical Tensions: Conflicts or trade wars can disrupt supply chains. For example, sanctions on Russian nickel and aluminum affected global markets.
Environmental Regulations: Stricter emissions standards and sustainability targets affect mining operations and recycling initiatives.
5. Metals as Investment Assets
5.1 Precious Metals as Safe Havens
Gold and silver are traditional safe-haven assets. During economic uncertainty or financial crises, investors turn to these metals to preserve value. Central banks also hold gold reserves as part of their monetary policy tools.
5.2 Industrial Metals and Economic Growth
Industrial metals such as copper, aluminum, and nickel are considered barometers of global economic health. Rising prices often signal industrial expansion, while declining prices indicate economic slowdown.
5.3 Investment Instruments
Investors can gain exposure to metals through:
Physical bullion and coins
Exchange-Traded Funds (ETFs)
Mining company stocks
Futures and options
Commodity index funds
5.4 Hedging and Risk Management
Manufacturers and producers use metal derivatives to hedge against price fluctuations. For example, an airline company may hedge aluminum prices to stabilize aircraft production costs.
6. Sustainability and the Future of Metals
6.1 Green Transition and Critical Minerals
The global shift toward renewable energy and electric vehicles has created unprecedented demand for critical minerals such as lithium, cobalt, nickel, and rare earth elements. These metals are vital for batteries, solar panels, and wind turbines.
6.2 Circular Economy and Recycling
Recycling metals reduces environmental impact, lowers production costs, and supports the circular economy. Technological advances in metal recovery are making recycling increasingly efficient and profitable.
6.3 ESG and Responsible Mining
Environmental, Social, and Governance (ESG) principles are reshaping the metals industry. Investors now demand transparency on carbon emissions, labor practices, and biodiversity impacts. Companies failing to meet ESG standards face reputational and financial risks.
6.4 Technological Innovations
Automation and AI in mining enhance safety and efficiency.
Blockchain technology is improving supply chain traceability.
Hydrogen-based steel production promises low-carbon alternatives to traditional blast furnaces.
7. Case Studies in the Metals Market
7.1 Copper Market Dynamics
Copper is known as “Dr. Copper” because its price movements reflect global economic health. The rise of electric vehicles and renewable infrastructure has significantly increased copper demand. Supply bottlenecks in Chile and Peru, which together account for nearly 40% of world production, often create price volatility.
7.2 Aluminum and Energy Dependence
Aluminum smelting is highly energy-intensive, making it sensitive to electricity prices. Energy crises, such as the one in Europe in 2022, led to major production cuts and higher aluminum prices worldwide.
7.3 Gold and Monetary Policy
Gold prices are heavily influenced by monetary policy, particularly interest rate decisions by the U.S. Federal Reserve. During periods of economic uncertainty, investors move from equities to gold, driving up demand.
7.4 Rare Earth Metals and Geopolitics
China’s dominance in rare earth metal production (over 80% of global supply) gives it strategic leverage in global technology and defense industries. The U.S. and EU have since accelerated efforts to diversify supply sources.
8. Challenges and Risks in the Metals Market
8.1 Price Volatility
The metals market is inherently volatile due to its sensitivity to macroeconomic and geopolitical developments. Sudden price swings can affect profitability for producers and manufacturers.
8.2 Environmental Concerns
Mining and metal processing contribute to deforestation, water pollution, and greenhouse gas emissions. Transitioning to sustainable mining practices is both a challenge and necessity.
8.3 Resource Nationalism
Countries rich in mineral resources often impose export restrictions or higher taxes to retain more value domestically. This can disrupt global supply chains.
8.4 Technological Disruption
Advances in materials science, such as graphene or alternative composites, may reduce reliance on certain metals, altering long-term demand patterns.
9. The Future Outlook of Metals Markets
The coming decades are expected to bring profound shifts in the metals industry:
Electrification and Energy Transition: Demand for copper, lithium, nickel, and cobalt will continue to soar as the world moves toward clean energy systems.
Digitalization: AI, IoT, and blockchain will enhance transparency and efficiency in metal trading and logistics.
Supply Chain Diversification: Countries will seek to reduce dependence on single suppliers, leading to new mining projects in Africa, South America, and Southeast Asia.
Recycling Revolution: Technological innovation in recycling will make secondary metal markets increasingly competitive.
Carbon Neutrality Goals: The push toward net-zero emissions will reshape production methods and pricing structures across the industry.
Conclusion
The metals market is a dynamic and essential component of the global economy. It integrates the forces of production, consumption, finance, and geopolitics into a vast network that underpins industrial and technological progress. Understanding how the metals market works requires a comprehensive view of its structure, participants, pricing mechanisms, and global interdependencies.
As the world transitions toward a sustainable and digital future, the metals market faces both immense challenges and opportunities. The rise of renewable energy, electric mobility, and green technologies will redefine demand for critical minerals. Meanwhile, innovations in recycling, ESG governance, and digital trading platforms promise to make the industry more efficient and transparent.
Ultimately, the metals market is not merely a trading arena but a mirror of human progress — reflecting the evolution of civilization, the rhythm of industrial growth, and the aspirations of a planet striving toward sustainability and prosperity.
META| 720 Breakout Setup- Gamma MORE!Price Consolidating just below 719-720- a key volume shelf and gamma pivot. A clean breakout with volume could trigger a dealer hedge-driven squeeze into 740-750 as gamma flips positive in the coming days or weeks.
74% bullish call flow today hints at an early momentum shift- watching the EMA cloud to flatten for added confluence.

META: Bullish short termTrade Idea for bullish META play:
Meta tagged 3rd quadrant of daily wick and spiked up, targeting quadrants of daily suspension block above

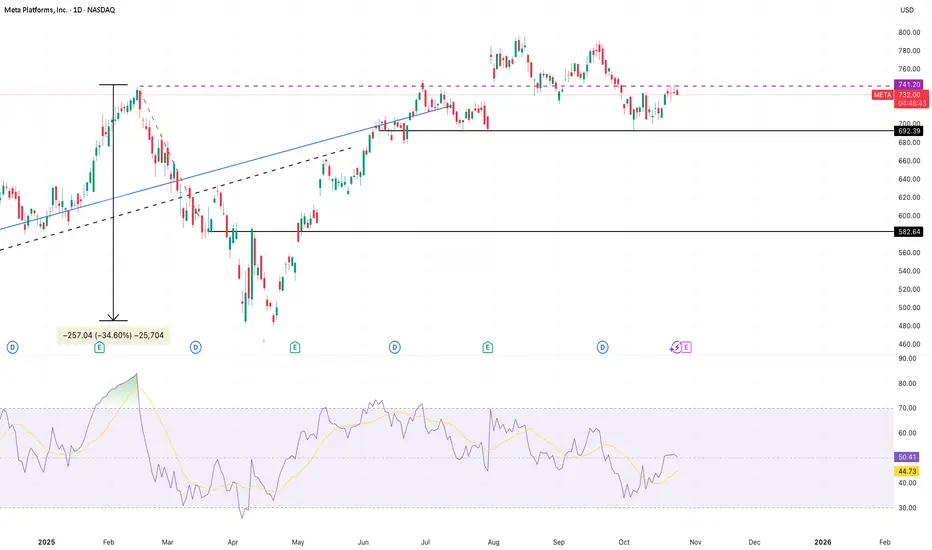
META - Forming bearish head and shouldersAbout 3 months back NASDAQ:META formed a double top .
In the first try, it broke through the double top resistance, but the price couldn’t quite escape the broken level .
Then, it came back and tested below the broken line .
It broke it again and formed a second double top !
Now, the price is under the first double top , which shows pretty weak price actions.
And it’s also starting to form a bearish head and shoulders formation.
So, here are my potential price targets for the next 9 months:
681 , 623 , and 584 .

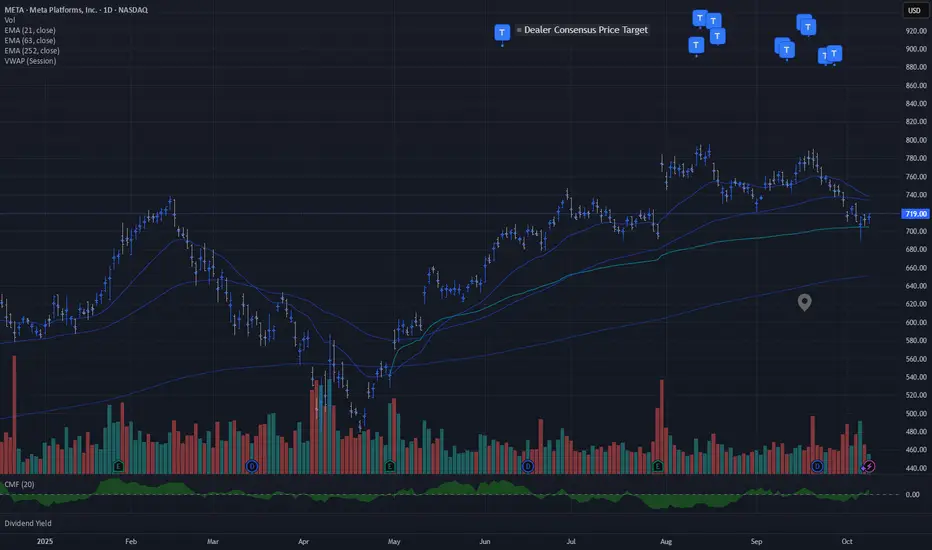
META | Constructive VWAP Support + Dealer Consensus PullWatch for follow through from Anchored VWAP Support while positive dealer pricing pressure remains intact.
META OCT 2025META 4H: Price is rebounding from the 700–712 demand zone after a sharp selloff. Reclaiming 707–715 would favor a gap-fill push. Overhead supply remains heavy at 750–770 (prior distribution/“14B sold” area). If buyers fail to absorb around 700, watch for a slide toward deeper supports.
Institutional read: Distribution visible between 750–770; potential absorption if 700–712 holds. Gap window 707–765 is the pivot for momentum.
Targets:
Upside: 750 first, extension 770 if gap fills.
Downside: 680 first, then 650; breakdown opens 610 gap-support.
#META #globaltrade #investment #investing #stockmarket #wealth #realestate #markets #economy #finance #money #forex #trading #price #business #currency #blockchain #crypto #cryptocurrency #airdrop #btc #ethereum #ico #altcoin #cryptonews #Bitcoin #ipo

$META Buy levelsNASDAQ:META is IMO, near term bearish, longer term bullish.
$640, $655 are good level to sell puts, and look for a possible bottoming at this zone based on my confluence of levels.

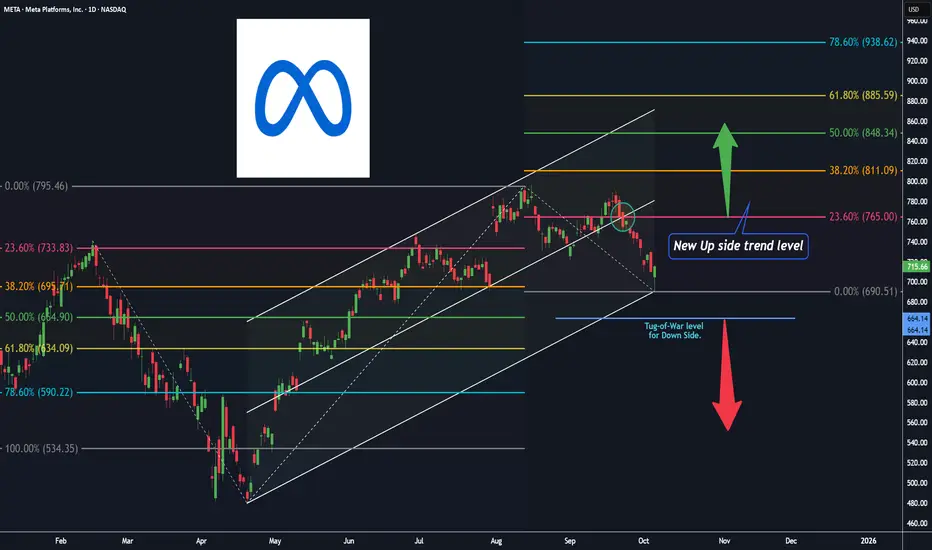
Meta platforms, D ( Channel + 2 Fibonacci Extensions up & down )Hey Traders and Investors, I hope you all are doing well in your life.
market is nature's response and Price is the God .
Let's check the market with the help of natural levels tool : Trend Based Fibonacci Extension in addition with Trend Channel .
After forming almost a ' Head and Shoulders ' pattern on Daily chart, Meta platforms has given a pull-back ( base for Fib-Extension UP level tool on the right side , $690.51 ).
The Pull-back trend expect to continue till the retest level of 23.6% ( $765 ) of Fib-Extension UP level tool on the right side .
The most near level for the re-test is the 50% level ( $664.14 ) of Fib-Extension Down level tool on the left side , for a new UP trend Entry ( investors ).
Note: The marked Circle ⭕ enclosed candle is the important level candle, Up Trend channel's 50% trend line is intersecting with 23.6% of Fib-Extension UP level tool on the right side .
Keep on checking this Level for your future trading decisions.
" Buy 🟢 "above $731 with the stop loss🔻of $690 for the
🎯 Target 1: $765
🎯 Target 2: $811
🎯 Target 3: open.
" Sell 🔴 " below $664 with the stop loss🔺of $690 for the
🎯 Target 1: $634
🎯 Target 2: $590
🎯 Target 3: open.
Smart Levels is Smart Trading 👨🎓
⚠ RISK DISCLAIMER :
All content provided by "TradeWithKeshhav" is for information & educational purposes only.
It does not constitute any financial advice or a solicitation to buy or sell any securities of any type. All investments / trading involve risks. Past performance does not guarantee future results / returns.
Always do your own analysis before taking any trade.
Regards :
Team @TradeWithKeshhav
Happy Trading and Investing!