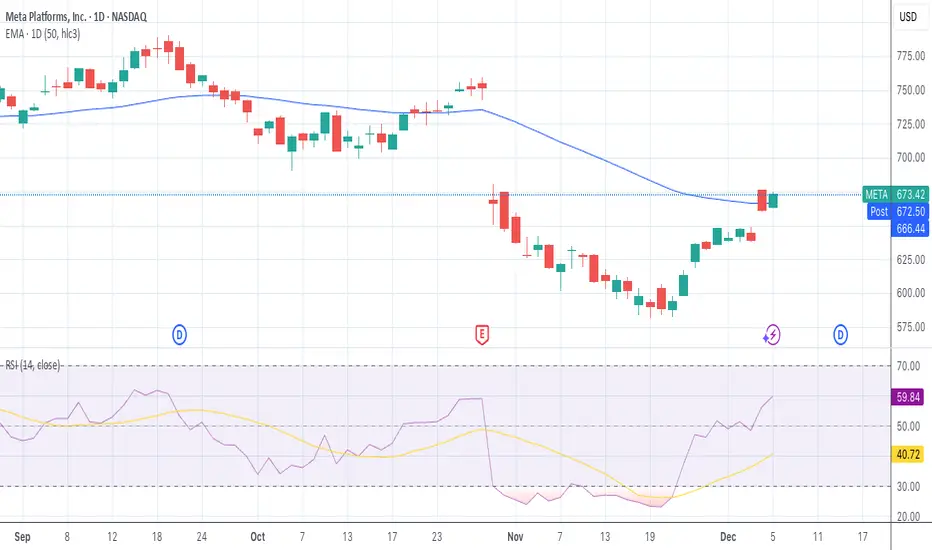
Meta came back on track ?Short Answer "Not Really"
however, the recent closing prices seem to remain below the 50‑day SMA, which suggests the trend is not clearly “recovered” yet.
In other words: there might be short‑term bullish momentum, but it’s not yet confirmed by a sustained close above the 50‑day average — the usual
Key facts today
0.75 USD
55.39 B USD
146.11 B USD
About Meta Platforms, Inc.
Sector
Industry
CEO
Mark Elliot Zuckerberg
Website
Headquarters
Menlo Park
Founded
2004
ISIN
ARBCOM460168
Meta Platforms, Inc. engages in the development of social media applications. It builds technology that helps people connect and share, find communities, and grow businesses. It operates through the Family of Apps (FoA) and Reality Labs (RL) segments. The FoA segment consists of Facebook, Instagram, Messenger, WhatsApp, and other services. The RL segment includes augmented, mixed and virtual reality related consumer hardware, software, and content. The company was founded by Mark Elliot Zuckerberg, Dustin Moskovitz, Chris R. Hughes, Andrew McCollum, and Eduardo P. Saverin on February 4, 2004, and is headquartered in Menlo Park, CA.
Related stocks
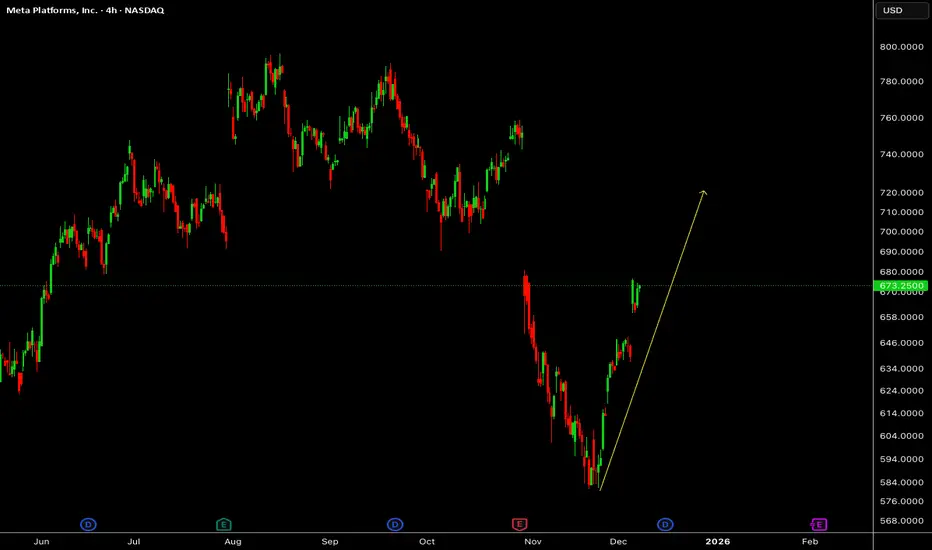
Meta Wave Analysis – 3 December 2025
- Meta reversed from support zone
- Likely to rise to resistance level 700.00
Meta recently reversed up from the support zone between the round support level 600.00 and the support trendline of the daily Down Channel from July.
The upward reversal from this support zone started the active short

META Bearish Edge Play: Katy AI Predicts Downtrend Despite BulliMETA Weekly Signal | 2025-12-08
Instrument: META
Direction: PUT (Short Bias)
Strike Price: $660.00
Expiry: 2025-12-12 (4 days)
Entry Range: $6.45 – $6.55 (mid $6.50)
Target 1: $10.32 (60% gain)
Target 2: $13.50 (109% gain)
Stop Loss: $4.50 (30% loss)
Position Size: 3% of portfolio
Confidence: 65% (M

Waiting for correction. and then buy in declineIdeal buy price : 570
SL : 525
Target : 990, 1308
Manage your risk.
It is at trap zone. It can rise to 708 then it may be fallen to ideal price levels 570-550.
Let's see.

$META | COVERAGE INITIATED — Personal Position Update [W49]COVERAGE INITIATED — Bullish Classification (Trend Shift Identified)
META — WEEK 49 TREND REPORT | 12/05/2025
Ticker: NASDAQ:META
Timeframe: W
This is a reactive structural classification based on the weekly chart as of this timestamp. Price conditions are evaluated as they stand — nothi

META: What’s Setting Up Next?META has recovered sharply from its recent drop, and the structure now hints at a developing continuation phase. The current climb may still be part of a broader move forming to the upside, with momentum showing signs of strength. As price builds within this emerging pattern, the next leg could unfo
META QuantSignals V3 | Moderate Risk alretMETA Swing Signal — (2025-11-28)
Instrument: META
Direction: BUY CALLS 📈
Confidence: 60% (Medium)
Horizon / Expiry: 14 days → 2025-12-12
Strike Focus: $650.00
Entry Range: $12.50 – $13.50 (mid $13.00)
Target 1: $19.00 (+50%)
Target 2: $25.00 (+100%)
Stop Loss: $8.50 (-35%)
Position Size: 3% of port
META — Watching for a Potential GAP Closure.Hello Everyone, Followers,
META is the second one for Today.
After disappointing financial report, It created big GAP between 742 to 680 .
The GAP is still unfilled.
Then META has shown a solid rebound after weeks of heavy selling. The chart is now structured around one key element:
🔍 Chart

Patience pays off? Long METAI've been patient with META. I've been wanting to go long here since earnings, but I also wanted to see if we'd get closer to the lower trendline. Luckily I waited. But I'm at a point I don't want to wait longer to start my position/trade.
The reasons:
1. That lower trendline has held since October

META — WEEK 49 TREND REPORTNASDAQ:META — WEEK 49 TREND REPORT
Ticker: NASDAQ:META — 12/02/2025 @ 647.10$
Timeframe: WEEKLY
This is a reactive structural classification of NASDAQ:META based on the weekly chart as of this timestamp. Price conditions are evaluated as they stand — nothing here is predictive or forwar

See all ideas
Summarizing what the indicators are suggesting.
Oscillators
Neutral
SellBuy
Strong sellStrong buy
Strong sellSellNeutralBuyStrong buy
Oscillators
Neutral
SellBuy
Strong sellStrong buy
Strong sellSellNeutralBuyStrong buy
Summary
Neutral
SellBuy
Strong sellStrong buy
Strong sellSellNeutralBuyStrong buy
Summary
Neutral
SellBuy
Strong sellStrong buy
Strong sellSellNeutralBuyStrong buy
Summary
Neutral
SellBuy
Strong sellStrong buy
Strong sellSellNeutralBuyStrong buy
Moving Averages
Neutral
SellBuy
Strong sellStrong buy
Strong sellSellNeutralBuyStrong buy
Moving Averages
Neutral
SellBuy
Strong sellStrong buy
Strong sellSellNeutralBuyStrong buy
Displays a symbol's price movements over previous years to identify recurring trends.
US30303M8D7
Meta Platforms, Inc. 3.85% 15-AUG-2032Yield to maturity
14.72%
Maturity date
Aug 15, 2032
FB6221365
Meta Platforms, Inc. 5.75% 15-NOV-2065Yield to maturity
5.88%
Maturity date
Nov 15, 2065
FB5868810
Meta Platforms, Inc. 5.55% 15-AUG-2064Yield to maturity
5.88%
Maturity date
Aug 15, 2064
FB5458295
Meta Platforms, Inc. 4.65% 15-AUG-2062Yield to maturity
5.87%
Maturity date
Aug 15, 2062
FB5581331
Meta Platforms, Inc. 5.75% 15-MAY-2063Yield to maturity
5.86%
Maturity date
May 15, 2063
FB5522241
Meta Platforms, Inc. 4.65% 15-AUG-2062Yield to maturity
5.79%
Maturity date
Aug 15, 2062
FB6221364
Meta Platforms, Inc. 5.625% 15-NOV-2055Yield to maturity
5.77%
Maturity date
Nov 15, 2055
FB5581330
Meta Platforms, Inc. 5.6% 15-MAY-2053Yield to maturity
5.75%
Maturity date
May 15, 2053
FB5868809
Meta Platforms, Inc. 5.4% 15-AUG-2054Yield to maturity
5.74%
Maturity date
Aug 15, 2054
FB5522214
Meta Platforms, Inc. 4.45% 15-AUG-2052Yield to maturity
5.70%
Maturity date
Aug 15, 2052
FB6221369
Meta Platforms, Inc. 5.5% 15-NOV-2045Yield to maturity
5.62%
Maturity date
Nov 15, 2045
See all METAD bonds
Curated watchlists where METAD is featured.


