METAD trade ideas
Shipping, Freight, and Logistics Trading (Baltic Index)1. Foundations of Global Shipping and Freight
1.1 The Role of Shipping in Global Trade
Shipping is the engine of globalization. Over 80% of international trade by volume is carried by sea. Ships transport crude oil, natural gas, coal, iron ore, grains, fertilizers, automobiles, and countless other goods.
Without shipping, modern trade would collapse. It provides:
Cost efficiency: Shipping is the cheapest way to transport large quantities over long distances.
Accessibility: Oceans cover 70% of the earth, linking producers and consumers across continents.
Flexibility: Different vessel types (tankers, bulk carriers, container ships, LNG carriers) handle specific cargo needs.
1.2 Freight: The Price of Shipping
In simple terms, freight is the cost of transporting cargo from one point to another. Freight rates vary depending on:
Type of cargo (dry bulk, liquid, containerized)
Distance and route (short haul vs. long haul)
Vessel size and availability
Market conditions (supply of ships vs. demand for goods)
Freight costs are crucial because they directly affect commodity prices, corporate profits, and inflation worldwide.
1.3 Logistics and Its Broader Scope
While shipping focuses on transport, logistics covers the entire chain: storage, warehousing, customs clearance, last-mile delivery, and supply chain management. Logistics companies such as Maersk, DHL, FedEx, and MSC coordinate multi-modal transport systems that integrate shipping, trucking, rail, and air.
2. The Baltic Exchange and Baltic Index
2.1 History of the Baltic Exchange
The Baltic Exchange is a London-based institution founded in the mid-18th century. Initially, it provided a marketplace for shipowners and merchants to negotiate contracts. Today, it is the world’s leading source of maritime market information, freight assessments, and shipping benchmarks.
2.2 What is the Baltic Dry Index (BDI)?
The BDI is a composite index that tracks the cost of transporting raw materials by sea, specifically dry bulk commodities such as:
Iron ore
Coal
Grains (wheat, corn, soybeans)
Bauxite, alumina, and other minerals
It is published daily by the Baltic Exchange and reflects the average of freight rates on major shipping routes worldwide.
2.3 How the BDI is Calculated
The index is derived from assessments of freight brokers who provide daily estimates of charter rates for different ship sizes. It combines data from four main dry bulk carrier classes:
Capesize (largest ships, mainly carrying iron ore & coal, 150,000+ DWT)
Panamax (medium size, often for coal & grain, 60,000–80,000 DWT)
Supramax (40,000–60,000 DWT, flexible routes & cargoes)
Handysize (smaller vessels, 10,000–40,000 DWT, short routes, regional trade)
The weighted average of these daily rates produces the BDI value.
2.4 Why is the BDI Important?
Economic Indicator: It is considered a leading indicator of global trade activity. Rising BDI suggests strong demand for raw materials and growth, while falling BDI indicates slowing trade.
Price Benchmark: Used by miners, steelmakers, traders, and shipping companies to negotiate contracts.
Financial Market Tool: Hedge funds, analysts, and investors watch the BDI to forecast commodity cycles and global GDP trends.
3. The Economics of Freight Markets
3.1 Supply Side: The Shipping Fleet
The supply of vessels is relatively inelastic in the short term. It takes 2–3 years to build new ships, so when demand spikes, freight rates can rise sharply. Conversely, during downturns, excess ships push rates lower.
3.2 Demand Side: Global Commodity Trade
Demand for shipping depends on global consumption of raw materials:
China’s steel production drives iron ore imports.
Power plants drive coal shipments.
Food security drives grain exports from the US, Brazil, and Ukraine.
3.3 Freight Rate Cycles
The shipping industry is notoriously cyclical:
Boom: High demand, limited supply → skyrocketing freight rates.
Bust: Overbuilding of ships, economic slowdown → rates collapse.
This volatility makes freight trading attractive but risky.
4. Trading and Investment Using the Baltic Index
4.1 Physical Shipping Contracts
Shipowners lease vessels to charterers (traders, miners, commodity houses) through:
Voyage Charter: Hire for a single trip.
Time Charter: Hire for a specific time period.
Bareboat Charter: Hire vessel without crew/equipment.
Freight rates are negotiated based on BDI benchmarks.
4.2 Freight Derivatives and Forward Freight Agreements (FFAs)
To manage volatility, traders use FFAs, financial contracts that lock in freight rates for future dates.
Example: A steelmaker importing iron ore may buy FFAs to hedge against rising shipping costs.
Speculators also trade FFAs purely for profit, betting on future freight movements.
4.3 ETFs and Shipping Stocks
Investors gain exposure to freight and shipping through:
Shipping company stocks (Maersk, Cosco, Hapag-Lloyd, Frontline)
Exchange-traded funds (ETFs) that track shipping indices
Commodities like iron ore, coal, and grains, which correlate with freight rates
4.4 Role of Banks and Hedge Funds
Financial institutions use the BDI for forecasting, asset allocation, and even as a proxy for inflation and GDP. Hedge funds trade freight derivatives to profit from global trade cycles.
5. Logistics and Supply Chain Dynamics
5.1 Container Shipping vs. Bulk Shipping
Container Shipping: Handles manufactured goods (electronics, clothing, cars). Measured in TEUs (Twenty-foot Equivalent Units). Freight benchmark = Shanghai Containerized Freight Index (SCFI).
Bulk Shipping: Handles raw commodities (ore, coal, grain). Benchmark = BDI.
5.2 Supply Chain Bottlenecks
Events like the COVID-19 pandemic and Suez Canal blockage (2021) highlighted vulnerabilities:
Congested ports delayed shipments.
Container shortages raised freight prices.
Geopolitical tensions (Russia-Ukraine war) disrupted grain and oil transport.
5.3 Role of Technology
Digital platforms, blockchain, and AI are transforming logistics:
Real-time cargo tracking
Smart contracts for freight payments
Automated port operations
6. Case Studies
6.1 The 2008 Shipping Boom and Bust
Pre-2008: China’s rapid industrial growth caused freight rates to skyrocket (BDI hit 11,793 points in May 2008).
Post-2008: Global financial crisis slashed demand; oversupply of ships led to a crash (BDI dropped below 700 points in late 2008).
6.2 COVID-19 Pandemic
Early 2020: Demand collapsed, ships idled, freight rates fell.
Mid-2020 onward: Recovery + container shortages led to record high container freight prices.
6.3 Russia-Ukraine War (2022)
Disrupted Black Sea grain exports.
Increased insurance costs for vessels in conflict zones.
Re-routed trade flows reshaped freight markets.
Conclusion
Shipping, freight, and logistics are the hidden arteries of global trade. The Baltic Dry Index (BDI) stands as a critical barometer of world economic health, linking shipping costs to broader market cycles. Traders, investors, and policymakers watch it closely to gauge demand for raw materials, predict inflation, and assess the global growth outlook.
While the industry faces volatility, geopolitical risks, and environmental pressures, it is also entering a period of transformation driven by decarbonization, digitalization, and new trade patterns.
For anyone interested in global markets—whether a trader, economist, or policy planner—the Baltic Index remains one of the most powerful yet underappreciated indicators of where the world economy is heading.
META 1H + GEX Game Plan for Tue, Sep 16META Eyes 774 Gamma Wall — Will the Push Hold or Fade? 🔥
Market Structure (1-Hour View)
* Strong breakout: META ripped from 745 support through 760 and tapped a new short-term high at ≈774, now consolidating near 764–768.
* Trend support: Rising lower trendline sits near 757–760, with broader base around 745–748.
* Momentum: MACD just eased from a strong push; Stoch RSI cooled toward mid-zone — a sign that META may pause before the next leg.
Key Levels to Watch
* Resistance: 768.5 (immediate cap), 774.1 (recent high / call wall), and 780–800 if squeeze extends.
* Support: 760 (first intraday shelf), 757.1–756.5, and 745.0 (major gamma + HVL pivot).
GEX Read (Sep 16)
* Highest positive NETGEX / Gamma magnet: 774.1
* 2nd Call Wall: ~780, 3rd Call Wall: ~800.
* Put walls / supports: 745 (massive -76% GEX level) and 735.
* Options sentiment: Calls ~27%, IVR ~8.3, IVx ~33.4 → option premiums moderate, decent for debit spreads.
Implication:
* As long as META holds above 760, dealers may allow an upper pin toward 774.
* A daily close >774 opens a squeeze toward 780–800.
* Lose 760/757, and hedging can drag price quickly toward 745 gamma/put wall.
Trade Scenarios
1) Bullish Breakout
* Trigger: Hourly close >768.5–770 with strong tape.
* Entry: 770.5–772 on retest.
* Targets: 774.1 → 780, stretch to 800 if flows remain strong.
* Stop: Below 764.
* Options: 775/780 call debit spread expiring this week.
2) Range Fade
* Trigger: Failure to reclaim 770 and a 30–60m rejection wick.
* Entry: 768–769.5 short.
* Targets: 760, then 757.
* Stop: Above 772.
* Options: 770P or 768/760 put spread for quick fade.
3) Breakdown From Key Pivot
* Trigger: Clean 1H break <757 with retest fail.
* Entry: 756–757 short.
* Targets: 745.0 gamma/put wall, extended 735 if momentum accelerates.
* Stop: Back above 760.
* Options: 755/745 put spread for a measured pullback.
Scalping & Swing Notes
* Early in session watch 764–768 chop zone. Quick scalps inside may whipsaw — wait for a clear break.
* EMA/VWAP retests that hold above 764–765 favor continuation; fails below 760 lean bearish.
Risk & Management
* Scale out partials at first target; trail stops if META trends toward 774+.
* Be mindful of IV crush if breakout stalls — especially on same-week options.
This analysis is for educational purposes only and does not constitute financial advice. Always manage risk and trade your plan.

World Bank & Emerging Market DevelopmentUnderstanding Emerging Markets
1. Defining Emerging Markets
An “emerging market” is typically defined as an economy that is not yet fully developed but exhibits high growth potential. They are characterized by:
Rising GDP growth rates.
Rapid urbanization and industrialization.
Expanding financial markets.
Increasing foreign direct investment (FDI).
Growing importance in global trade.
Examples include India, Brazil, South Africa, Turkey, Mexico, Vietnam, and Indonesia, as well as frontier economies like Kenya, Bangladesh, and Ethiopia.
2. Characteristics of Emerging Markets
Demographics: Large young populations, creating both opportunities (labor force, consumption) and challenges (employment, education).
Infrastructure Needs: Roads, ports, electricity, and digital networks are often underdeveloped.
Governance Challenges: Issues of corruption, weak institutions, and political instability persist.
Vulnerability to Shocks: They depend on commodities, remittances, and global capital flows, making them exposed to volatility.
Dual Economies: Often a mix of modern urban centers with advanced industries and rural areas dependent on agriculture.
The World Bank: An Overview
1. Structure of the World Bank Group (WBG)
The World Bank is part of the World Bank Group, which includes:
IBRD (International Bank for Reconstruction and Development) – provides loans to middle-income and creditworthy low-income countries.
IDA (International Development Association) – provides concessional loans and grants to the poorest countries.
IFC (International Finance Corporation) – promotes private sector development.
MIGA (Multilateral Investment Guarantee Agency) – offers political risk insurance and credit enhancement.
ICSID (International Centre for Settlement of Investment Disputes) – provides arbitration facilities for investment disputes.
2. Objectives of the World Bank
Reducing extreme poverty.
Promoting sustainable economic development.
Facilitating investment in infrastructure, education, health, and governance.
Supporting private sector growth and job creation.
Strengthening resilience to climate change and global crises.
World Bank’s Role in Emerging Market Development
1. Financing Infrastructure
One of the World Bank’s biggest contributions is funding infrastructure projects: roads, ports, power plants, water systems, and digital networks. Infrastructure lays the foundation for industrialization, trade, and productivity growth.
In India, the World Bank has funded rural electrification and metro transport systems.
In Africa, it has supported the Africa Power Project to expand electricity access.
2. Poverty Reduction Programs
The World Bank invests heavily in programs aimed at reducing poverty and inequality. Examples include:
Conditional cash transfers in Latin America.
Rural development projects in South Asia.
Healthcare and vaccination programs in Sub-Saharan Africa.
3. Strengthening Institutions and Governance
Emerging markets often face weak institutional frameworks. The World Bank provides technical assistance to improve governance, transparency, tax collection, and public financial management.
4. Promoting Private Sector Development
Through the IFC, the World Bank fosters private enterprise, small and medium enterprises (SMEs), and access to finance. It mobilizes private investment in sectors such as energy, manufacturing, and digital technology.
5. Crisis Response and Resilience
Emerging markets are vulnerable to financial crises, pandemics, natural disasters, and climate shocks. The World Bank provides rapid financing and policy support in times of crisis. For example:
During COVID-19, the Bank committed billions for vaccines and health system strengthening.
In food crises, it has supported agricultural productivity and emergency aid.
Case Studies of World Bank in Emerging Markets
1. India
The World Bank has invested in education projects like Sarva Shiksha Abhiyan, enhancing literacy and enrollment rates.
It has supported clean energy projects, such as solar parks and wind farms.
World Bank loans have also been directed towards digital governance and financial inclusion (Aadhaar-linked systems).
2. Brazil
The World Bank has funded projects in Amazon rainforest conservation.
It has also supported urban infrastructure in cities like São Paulo and Rio de Janeiro.
Programs addressing inequality and slum rehabilitation have benefited from World Bank assistance.
3. Sub-Saharan Africa
In Kenya, the World Bank financed the Geothermal Energy Expansion project.
In Ethiopia, it has invested in agriculture modernization and irrigation.
Across Africa, the IDA is the largest source of concessional financing, focusing on health, infrastructure, and governance.
4. Vietnam
Transitioned from a centrally planned to a market economy with World Bank guidance.
Major infrastructure projects (roads, ports, and power grids) were co-financed.
Poverty rates fell dramatically from over 70% in the 1980s to under 6% today.
Successes of World Bank in Emerging Markets
Poverty Reduction – Countries like Vietnam, India, and Bangladesh have seen significant poverty reduction with World Bank support.
Infrastructure Development – Roads, ports, and energy systems financed by the Bank have fueled industrialization.
Human Capital – Investments in education and health have improved literacy, reduced infant mortality, and increased life expectancy.
Private Sector Growth – Through the IFC, the Bank has boosted SME development, job creation, and entrepreneurship.
Global Integration – World Bank programs helped countries integrate into global trade and attract FDI.
Emerging Challenges and Future Role
1. Climate Change and Sustainability
Emerging markets are among the most vulnerable to climate shocks. The World Bank is increasingly focusing on green financing, renewable energy, and climate resilience.
2. Digital Transformation
The future of development is digital. The Bank supports digital finance, e-governance, and broadband connectivity to bridge the digital divide.
3. Inequality and Inclusive Growth
Even as GDP grows, inequality remains high in emerging markets. World Bank programs are now emphasizing inclusive growth, targeting women, rural populations, and marginalized groups.
4. Geopolitical Tensions and Multipolarity
As China expands its influence through the Asian Infrastructure Investment Bank (AIIB) and Belt & Road Initiative (BRI), the World Bank faces competition in development finance. Collaborations and new models of financing will define the future.
5. Health and Pandemic Preparedness
The COVID-19 pandemic revealed the fragility of health systems. The Bank is likely to expand investments in universal health coverage, vaccine development, and pandemic resilience.
Conclusion
The relationship between the World Bank and emerging market development is a story of both achievement and controversy. On one hand, the Bank has helped lift millions out of poverty, build transformative infrastructure, and create opportunities for growth and integration into the world economy. On the other, it has been criticized for policies that sometimes exacerbated inequality, debt, or environmental harm.
As the global landscape shifts—with climate change, digital transformation, geopolitical rivalries, and health crises at the forefront—the World Bank’s role in emerging markets will evolve. Its challenge will be to balance financing with sustainability, growth with inclusivity, and global integration with local autonomy.
Ultimately, the World Bank remains a cornerstone of development finance, and for emerging markets, it will continue to be a vital partner in the pursuit of prosperity, stability, and resilience in the 21st century.
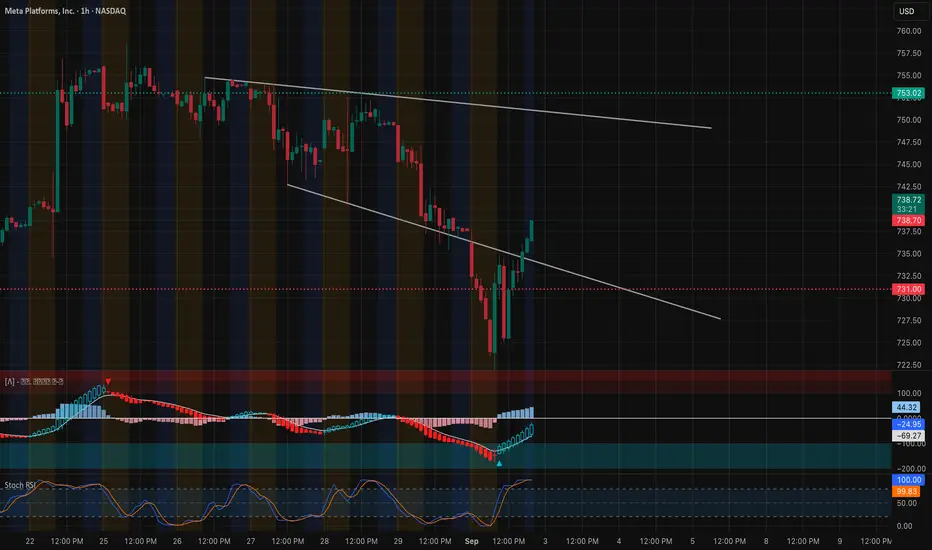
META 45Minutes Time frameMETA 45-Minute Snapshot
Current Price: $765.70 USD
Change: +1.81% from the previous close
Market Cap: $1.86 Trillion
P/E Ratio: 25.95
EPS: $27.56
Intraday High: Not available
Intraday Low: Not available
🔎 Technical Indicators
RSI (14): Neutral
MACD: Neutral
Moving Averages:
5-period SMA: Not available
10-period SMA: Not available
20-period SMA: Not available
50-period SMA: Not available
📈 Market Sentiment
Pivot Points:
R1: Not available
R2: Not available
R3: Not available
S1: Not available
S2: Not available
S3: Not available
📅 Outlook
Bullish Scenario: A breakout above the current price could lead to further gains.
Bearish Scenario: A drop below the current price may test support levels.
Overall Bias: Neutral, with mixed signals from moving averages and momentum indicators.

META Sep 2025 Monthly Support & Resistance LinesOverview:
These purple lines act as Support and resistance lines when the price moves into these lines from the bottom or the top direction. Based on the direction of the price movement, one can take long or short entries.
Trading Timeframes
I usually use 30min candlesticks to swing trade options by holding 2-3 days max. Anyone can also use 3hr or 4hrs to do 2 weeks max swing trades for massive up or down movements.
I post these 1st week of every month and they are valid till the end of the month.

META | Buy & Sell Setup | 12 Sep 2025 – 10:48 EDTMETA | Buy & Sell Setup | 12 Sep 2025 – 10:48 EDT
Buy Zone: 766.66 – 757.95
Sell Zone: 752.01 – 743.77
Scenario : Buy
Entry: 758.00
Stop Loss: 746.20
Targets:
TP1 → 796.25
Analysis:
From Buy Zone (766.66 – 757.95) creates possibilities for a buy move.
Scenario 2 : Sell
Entry: 746.20
Stop Loss: 758.00
Targets:
TP1 → 721.91
TP2 → 691.30
Analysis:
From Sell Zone (752.01 – 743.77) creates possibilities for a sell move.
Stay alert on updates here.
⚠️ Disclaimer: This idea is shared for educational purposes only and should not be considered financial advice. Please do your own analysis before making trading decisions.

META 1D Time frame Meta Platforms (META) Daily Snapshot
Current Price: $765.70
Change: +1.78% from the previous close
Intraday Range: $753.43 – $766.30
Volume: 10,564,233 shares traded
Market Cap: $1.86 trillion
P/E Ratio: 25.95
EPS: $27.56
Beta: 1.42 → higher volatility than the market
🔎 Key Levels
Resistance:
R1: $764.73 (near-term)
R2: $771.51 (next zone)
Support:
S1: $745.67 (immediate)
S2: $738.89 (secondary)
S3: $732.75 (long-term)
📈 Technical Indicators
RSI (14): 52.41 → neutral, balanced buying and selling
MACD: 1.46 → positive, upward momentum
ADX (14): 14.16 → weak trend strength
Moving Averages:
5-day SMA: $745.11 → Buy
10-day EMA: $748.66 → Buy
50-day SMA: $739.04 → Buy
200-day SMA: $651.23 → Buy
📌 Market Sentiment
Catalysts: Positive momentum and analyst upgrades
Sector Strength: Tech sector strong, with Meta leading gains
AI Investment: Meta plans to invest heavily in AI over the coming years, expected to benefit the broader AI and data infrastructure ecosystem
📅 Outlook
Bullish Scenario: Break above $764.73 could push toward $771.51 and higher
Bearish Scenario: Drop below $745.67 may test support at $738.89
Overall Bias: Moderately bullish, with momentum positive but near-term resistance to watch

META Platforms — Can Bulls Escape With $800 Loot?📈 META Money Heist: Bullish Thief Swing/Day Trade Plan! 💰🔥
Date: 08 September 2025
Asset: META Platforms, Inc.
Trading Style: Money Heist Plan with Thief Strategy (Swing/Day Trade) 🦹♂️
Plan: Bullish (Pullback in the LSMA Moving Average) – Bulls charging for upside momentum! 🚀
🎯 Entry: Any Price Level – Thief Using Layer Strategy
Deploy multiple limit orders (layering style entries) at $730.00, $740.00, $750.00 (scale up layers based on your preference).
Be a stealthy trader, sniping entries during pullbacks for max profits! 🕵️♂️
🛑 Stop Loss: Thief SL at $710.00
Dear Ladies & Gentlemen (Thief OG's), adjust your SL based on your strategy and risk tolerance. Protect your loot! 🛡️
Please adapt your SL to your own strategy, risk appetite, and style — take profits when it makes sense for you.
🎯 Target: Resistance + Overbought Zone + Trap Ahead
Escape with your stolen profits before the trap! Aim for $800.00 target. 🏃♂️💨
📝 Note: Dear Thief OG's
I’m not dictating your TP – it’s your heist! Take profits at your own risk and make the market your playground. 💸
💡 Why This Plan? Thief Strategy + Market Edge
The Thief Plan is a cunning, layered approach to "steal" profits from market pullbacks, aligning with META’s bullish technicals (near 52-week highs, above 200-day SMA). By stacking limit orders, you capitalize on dips in the LSMA moving average, riding the bulls’ strength with precision. Backed by strong fundamentals, macro trends, and greedy sentiment, this setup is primed for a high-reward heist! 🤑
📊 META Stock Sentiment & Market Outlook (08 Sept 2025)
🔢 Real-Time Data Overview
📈 Day Change: +0.51% (↑ $3.80)
📏 52-Week Range: $479.80 - $796.25
💰 Market Cap: $1.89T 🏆
😊 Investor Sentiment Outlook
Retail & Institutional Mood
🟢 Consensus Sentiment: Bullish (Greed Phase)
Analysts’ Price Target Avg: $822.41 (9.30% upside).
42/47 analysts rate META as "Buy" 🟢.
Institutions love AI-driven ad growth + strong cash flow. 💪
Fear & Greed Index
⚖️ Stock Market Sentiment Score: 53/100 (Neutral to Greed)
Driven by market momentum, options activity, and low volatility.
🔄 Crypto Sentiment: Neutral (53/100).
📉 Fundamental & Macro Score Points
Fundamental Strength ✅
💸 Valuation:
P/E Ratio: 27.32 (below peers’ avg 35.47).
Free Cash Flow: $57.63B (projected to hit $198.64B by 2035).
Profit Margin: 39.99% (industry leader).
🚀 Growth Catalysts:
AI boosting ad engagement.
Reality Labs innovation (long-term bet).
⚠️ Risks:
Regulatory scrutiny (antitrust/data privacy) 🚨.
High reliance on ad revenue (98% of total).
Macroeconomic Factors 🌍
📅 Upcoming Events:
CPI Inflation Report (11 Sept).
Fed Meeting (16-17 Sept) 🏦.
📊 Market Volatility: VIX stable (low fear).
🐂 Overall Market Outlook: BULLISH (LONG)
⏳ Short-Term: ✅
Price near 52-week high + above 200-day SMA.
Target upside: $900+ (Bank of America, DBS Bank).
📅 Long-Term: ✅
AI monetization + metaverse potential.
Undervalued by 29% (DCF model).
🎯 Key Takeaways
😊 Sentiment: Greed-driven optimism (institutional + retail).
💰 Fundamentals: Strong cash flow + EPS growth ($27.54).
🌍 Macro: Monitor CPI/Fed for volatility triggers.
⚠️ Risk: Regulatory risks offset by growth bets.
✅ Verdict: Bullish alignment across sentiment, fundamentals, and technicals.
📡 Related Pairs to Watch (in USD)
NASDAQ:AAPL
NASDAQ:GOOGL
NASDAQ:MSFT
NASDAQ:AMZN
NASDAQ:NVDA
✨ “If you find value in my analysis, a 👍 and 🚀 boost is much appreciated — it helps me share more setups with the community!”
#META #MoneyHeistTrade #BullishSetup #ThiefStrategy #SwingTrading #DayTrading #AIStocks #TechStocks #TradingView #StockMarket #FearAndGreed #BullMarket

New Setup : $METABullish ATR break and bullish crossover
Price action is not perfect with lower lows and not yet a higher high.
Waiting for a trigger with a very low risk to take

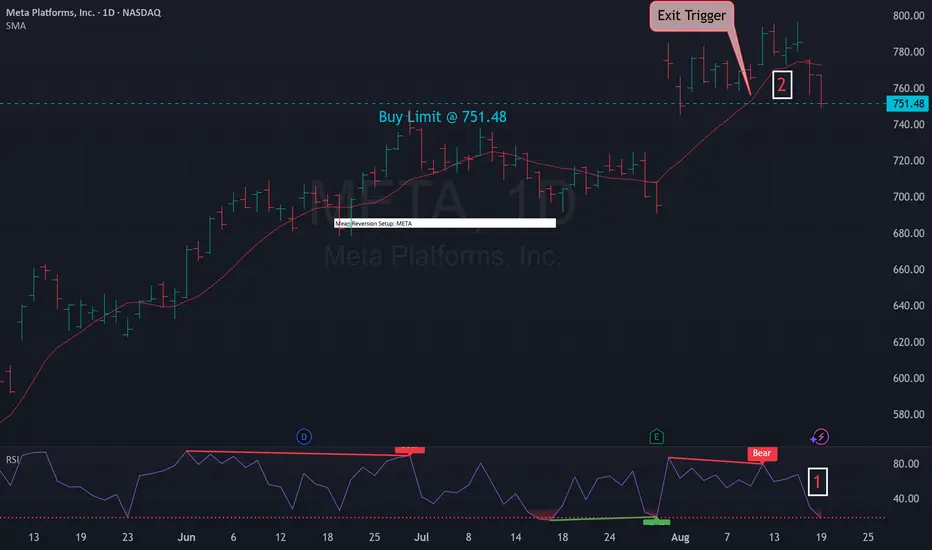
Mean Reversion Setup: META1. RSI in oversold region
2. Price likely to rebound back the the mean
Trade Rules:
Entry Trigger - RSI has cross below oversold region, enter limit buy at close price
Exit Trigger - Close at market when close price cross above exit trigger (Red Line)
Buy Limit @ 751.48
Entered Long @ 100.99
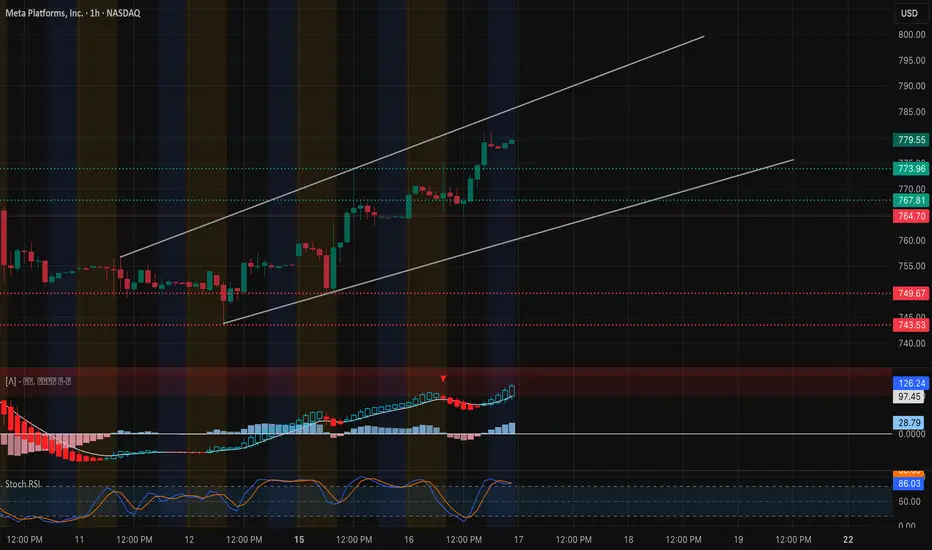
META: Bulls Eye Key Level for Sept 17 – Swing & Scalp Setups1-Hour Chart Technical View
META is riding a clean ascending channel, holding a steady higher-high/higher-low pattern. Friday’s move left a bullish Change of Character (CHoCH) near $772 and confirmed strength with closes above $779. Current intraday trend is supported by the 9 EMA > 21 EMA alignment, and momentum oscillators (MACD, Stoch) continue to lean bullish with no major divergence yet.
* Immediate Support: $774 and $768 (mid-channel / intraday demand)
* Major Support: $764.7 (strong breakout retest zone)
* Upside Zone: $788–$795 is first key resistance; a break targets the $800 call wall and potentially $820 if momentum accelerates.
GEX & Options Flow
Options data shows stacked call gamma above spot:
* Call Walls: $795 (3rd call wall), $800 (highest positive NET GEX & key resistance), then $820.
* Put Defense: $747.5 HVL (09/19) with larger put walls around $720 and $710.
* GEX Bias: Net call gamma dominates, suggesting dealers hedge by buying dips, which often dampens downside volatility and supports gradual grind-ups.
IV Rank is modest (IVR ~8.6) with IVx ~33.9, implying option premiums are relatively low for directional plays.
Trade Thoughts & Suggestions
* Swing Idea: As long as $774 holds, risk-defined swing longs can target $795–$800 with room toward $820 if $800 breaks on volume.
* Scalp Idea: Watch 1-hour re-tests of $779/$774 for quick intraday longs, or fade a failed breakout above $795 if volume thins.
* Risk Zone: A sustained break below $764.7 would flip structure short-term and open $749.5 then $743.7.
Quick Take
META is technically strong with bullish gamma support. For Sept 17, price action favors controlled dip-buys until $800 is tested. Scalp traders can play the $779–$788 range; swing traders can look for $795–$820 extensions.
Disclaimer: This analysis is for educational purposes only and does not constitute financial advice. Always do your own research and manage risk before trading.
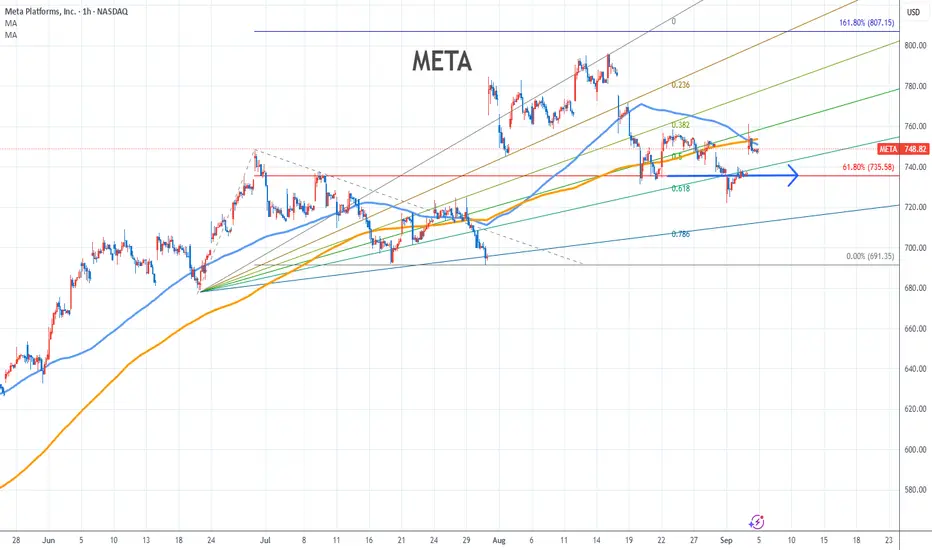
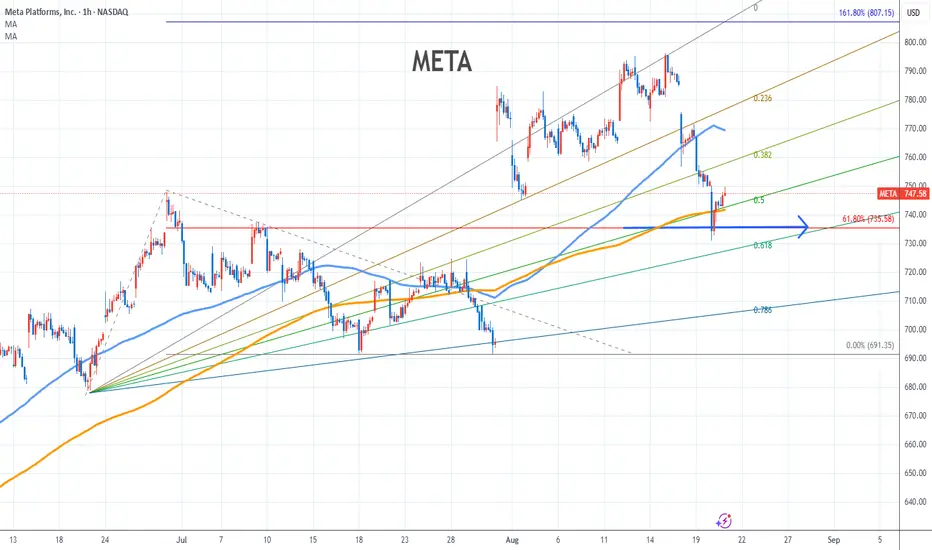
Meta Stock Chart Fibonacci Analysis 090425Trading Idea
1) Find a FIBO slingshot
2) Check FIBO 61.80% level
3) Entry Point > 736/61.80%
Chart time frame:B
A) 15 min(1W-3M)
B) 1 hr(3M-6M)
C) 4 hr(6M-1year)
D) 1 day(1-3years)
Stock progress:A
A) Keep rising over 61.80% resistance
B) 61.80% resistance
C) 61.80% support
D) Hit the bottom
E) Hit the top
Stocks rise as they rise from support and fall from resistance. Our goal is to find a low support point and enter. It can be referred to as buying at the pullback point. The pullback point can be found with a Fibonacci extension of 61.80%. This is a step to find an entry-level position. 1) Find a triangle (Fibonacci Speed Fan Line) that connects the high (resistance) and low (support) points of the stock in progress, where it is continuously expressed as a Slingshot, 2) and create a Fibonacci extension level for the first rising wave from the start point of the slingshot pattern.
When the current price goes over the 61.80% level, that can be a good entry point, especially if the SMA 100 and 200 curves are gathered together at 61.80%, it is a very good entry point.
As a great help, TradingView provides these Fibonacci speed fan lines and extension levels with ease. So if you use the Fibonacci fan line, the extension level, and the SMA 100/200 curve well, you can find an entry point for the stock market. At least you have to enter at this low point to avoid trading failure, and if you are skilled at entering this low point, with the fibonacci6180 technique, your reading skill of to chart will be greatly improved.
If you want to do day trading, please set the time frame to 5 minutes or 15 minutes, and you will see many of the low points of rising stocks.
If you prefer long-term range trading, you can set the time frame to 1 hr or 1 day
META Technical Analysis-September 3META rebounded strongly off the 721–725 demand zone, breaking through its descending trendline and regaining short-term momentum. The MACD has flipped bullish with a rising histogram, while Stoch RSI is pushing higher, suggesting momentum is building but still has room before becoming overextended.
* Resistance: The first major test sits at 740–745. Beyond that, the bigger ceiling is at 752–753, which has repeatedly acted as supply.
* Support: Immediate support now lies at 731–732. A deeper retest into 725–721 would be the key level for bulls to defend.
* Trend: While still inside a broader downtrend channel, this breakout shows early signs of strength — bulls will need to clear 745 to flip momentum decisively.
🔍 Options / GEX Confirmation
* Resistance Clusters:
* 745–750 → heavy call wall.
* 752–753 → reinforced by strong call resistance, making this the main upside barrier.
* Support Layers:
* 731–732 → strong GEX support.
* 725–721 → backed by highest negative gamma / put support.
This confirms that 745–753 is the resistance zone to watch into September 3, while 731–725 is the support band that must hold for bulls to stay in control.
🎯 Trade Scenarios
* Bullish: Hold above 731 and break through 745 → opens room for a test of 752–753 into September 3. If this clears, upside momentum could carry toward 760.
* Bearish: Failure to hold 731 or rejection at 745–753 → risks a pullback to 725–721, and losing that would drag price toward 715.
🧠 Final Take
META is showing signs of recovery after a steep decline, with the 745–753 zone now the key battleground into September 3. Clearing it would signal a shift in momentum and potentially extend toward 760. If sellers defend that zone, expect chop or a pullback into the 725–721 demand base before another attempt higher.
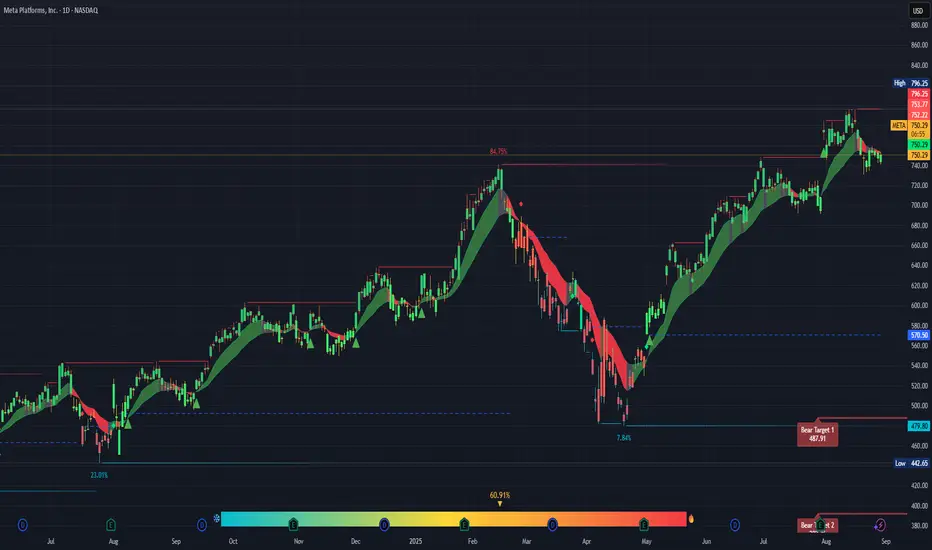
Meta....Which way?The Good
Trend: The longer-term trend is still up. You’ve had a strong run from the April low around ~$570 to the July high near ~$796. That’s nearly a 40% move.
Support Zone: The $740–$750 range looks like near-term support. Today’s close at $750.30 is sitting right on it. If this level holds, it’s constructive.
Momentum: Even with the recent pullback, the green trend ribbon shows the stock has mostly stayed in bullish structure since May.
The Risks
Resistance overhead: META hit a wall at $796.25 (previous high) and pulled back sharply. Until price reclaims that area, it’s a ceiling.
Distribution signs: The topping candles in July–August show selling pressure near the highs. If $740 fails, the next support is closer to $700–$710.
Bearish targets: Your chart shows a “Bear Target 1” at $487.91. That’s extreme, but it signals risk if the broader market turns.
Cost vs. Benefit
Upside: If $750 holds, META could retest $780–$796 (a potential ~6% upside).
Downside: If $740 breaks, META could revisit $700 (a ~7% downside), and if sentiment really cracks, $570 isn’t out of the question.
Brutally Honest Take
Right now META looks neutral to cautiously bullish—the longer trend is intact, but short-term momentum is shaky. This isn’t a “high-probability breakout” spot; it’s a wait-for-confirmation level. If you’re trading, the risk/reward is about even here.
Meta on the RiseIf Meta breaks above the highlighted resistance zone, it could continue its upward momentum

META Stock Chart Fibonacci Analysis 082625Trading Idea
1) Find a FIBO slingshot
2) Check FIBO 61.80% level
3) Entry Point > 736/61.80%
Chart time frame:C
A) 15 min(1W-3M)
B) 1 hr(3M-6M)
C) 4 hr(6M-1year)
D) 1 day(1-3years)
Stock progress:C
A) Keep rising over 61.80% resistance
B) 61.80% resistance
C) 61.80% support
D) Hit the bottom
E) Hit the top
Stocks rise as they rise from support and fall from resistance. Our goal is to find a low support point and enter. It can be referred to as buying at the pullback point. The pullback point can be found with a Fibonacci extension of 61.80%. This is a step to find entry level. 1) Find a triangle (Fibonacci Speed Fan Line) that connects the high (resistance) and low (support) points of the stock in progress, where it is continuously expressed as a Slingshot, 2) and create a Fibonacci extension level for the first rising wave from the start point of slingshot pattern.
When the current price goes over 61.80% level , that can be a good entry point, especially if the SMA 100 and 200 curves are gathered together at 61.80%, it is a very good entry point.
As a great help, tradingview provides these Fibonacci speed fan lines and extension levels with ease. So if you use the Fibonacci fan line, the extension level, and the SMA 100/200 curve well, you can find an entry point for the stock market. At least you have to enter at this low point to avoid trading failure, and if you are skilled at entering this low point, with fibonacci6180 technique, your reading skill to chart will be greatly improved.
If you want to do day trading, please set the time frame to 5 minutes or 15 minutes, and you will see many of the low point of rising stocks.
If you want to prefer long term range trading, you can set the time frame to 1 hr or 1 day
“Magnificent Seven Face-Off: Who’s Leading — and Who’s Losing — Picture a battleground of tech giants, each vying for supremacy in a year defined by AI, retail mania, and relentless volatility. Here’s how the Magnificent Seven stack up in 2025—with the numbers to prove it:
Performance Recap: YTD Returns (2025)
Meta (META): +18.6% — the surprising standout so far.
StatMuse
Microsoft (MSFT): +14.6% — steady leadership in cloud and AI.
StatMuse
NVIDIA (NVDA): +6.0% — still strong, but cooling from peak runs.
StatMuse
Amazon (AMZN): –6.1% — under pressure from margin concerns.
StatMuse
Tesla (TSLA): –10.6% — dragged down by fears of slowing demand.
StatMuse
Broader Comparison (including Apple & Alphabet)
Apple (AAPL): –8.7% — struggling despite loyal brand strength.
FinanceCharts
+1
Alphabet (GOOGL): +9.7% — solid, but overshadowed by its peers.
FinanceCharts
The Insight: Who’s Winning—and Why
Meta’s comeback is astonishing. Its nearly +19% return shows that scale and monetization recovery can still surprise.
Microsoft’s +14.6%? That’s textbook: enterprise dominance, AI investments, and stable fundamentals.
NVIDIA, at +6%, commanded 2023–2024. Now, it’s hitting profitability and valuation resistance.
Apple’s negative—despite product strength—suggests overexposure to macro pressures and high expectations.
Amazon’s dip reflects concerns over costs and retail softness.
Tesla’s sharp decline highlights EV sector cooling and margin pressures.
Alphabet’s +9.7% is respectable, but its deep bench of winners masks slower gains right now.
The Takeaway: Where the Real Opportunity Might Lie
The comeback king: Meta is flying under the radar here—maybe it’s time to reevaluate.
Tech still wins—in variation: NVIDIA isn’t dominating, but Microsoft is offering safer, AI-powered upside.
Don’t sleep on the cheap: Apple, Amazon, and Tesla may still recover—especially if markets rotate.
Balance hype with fundamentals: Alphabet’s steady climb amid chaos is a lesson in calm consistency.
TL;DR
Among the Magnificent Seven in 2025:
META (+18.6%) and MSFT (+14.6%) are outperforming.
Others—NVDA (+6%), GOOGL (+9.7%), AAPL (–8.7%), AMZN (–6.1%), TSLA (–10.6%)—are mixed or lagging.
Big picture: AI darling NVIDIA is cooling off, Microsoft is thriving, Meta is exceeding expectations—and valuation is the new battleground.

Meta Could Be Fighting HigherMeta Platforms recently pulled back, but some traders may think it’s still fighting higher.
The first pattern on today’s chart is the gap to new all-time highs after quarterly results beat estimates. That may reflect strong fundamentals in the social-media giant.
Second is the weekly close of $736.67 from February 14. META stalled at the level in late June but held it last week. Has old resistance become new support?
Third, stochastics are turning up from an oversold condition.
Next, the rising 50-day simple moving average potentially suggests an intermediate-term uptrend remains in effect. The 8-day exponential moving average (EMA) is also above the 21-day EMA. That may be consistent with a short-term uptrend.
Last, META is an active underlier in the options market. (Its average daily volume of 453,000 contracts ranks tenth in the S&P 500 over the last month, according to TradeStation data.) That could help traders take positions with calls and puts.
TradeStation has, for decades, advanced the trading industry, providing access to stocks, options and futures. If you're born to trade, we could be for you. See our Overview for more.
Past performance, whether actual or indicated by historical tests of strategies, is no guarantee of future performance or success. There is a possibility that you may sustain a loss equal to or greater than your entire investment regardless of which asset class you trade (equities, options or futures); therefore, you should not invest or risk money that you cannot afford to lose. Online trading is not suitable for all investors. View the document titled Characteristics and Risks of Standardized Options at www.TradeStation.com . Before trading any asset class, customers must read the relevant risk disclosure statements on www.TradeStation.com . System access and trade placement and execution may be delayed or fail due to market volatility and volume, quote delays, system and software errors, Internet traffic, outages and other factors.
Securities and futures trading is offered to self-directed customers by TradeStation Securities, Inc., a broker-dealer registered with the Securities and Exchange Commission and a futures commission merchant licensed with the Commodity Futures Trading Commission). TradeStation Securities is a member of the Financial Industry Regulatory Authority, the National Futures Association, and a number of exchanges.
Options trading is not suitable for all investors. Your TradeStation Securities’ account application to trade options will be considered and approved or disapproved based on all relevant factors, including your trading experience. See www.TradeStation.com . Visit www.TradeStation.com for full details on the costs and fees associated with options.
Margin trading involves risks, and it is important that you fully understand those risks before trading on margin. The Margin Disclosure Statement outlines many of those risks, including that you can lose more funds than you deposit in your margin account; your brokerage firm can force the sale of securities in your account; your brokerage firm can sell your securities without contacting you; and you are not entitled to an extension of time on a margin call. Review the Margin Disclosure Statement at www.TradeStation.com .
TradeStation Securities, Inc. and TradeStation Technologies, Inc. are each wholly owned subsidiaries of TradeStation Group, Inc., both operating, and providing products and services, under the TradeStation brand and trademark. When applying for, or purchasing, accounts, subscriptions, products and services, it is important that you know which company you will be dealing with. Visit www.TradeStation.com for further important information explaining what this means.

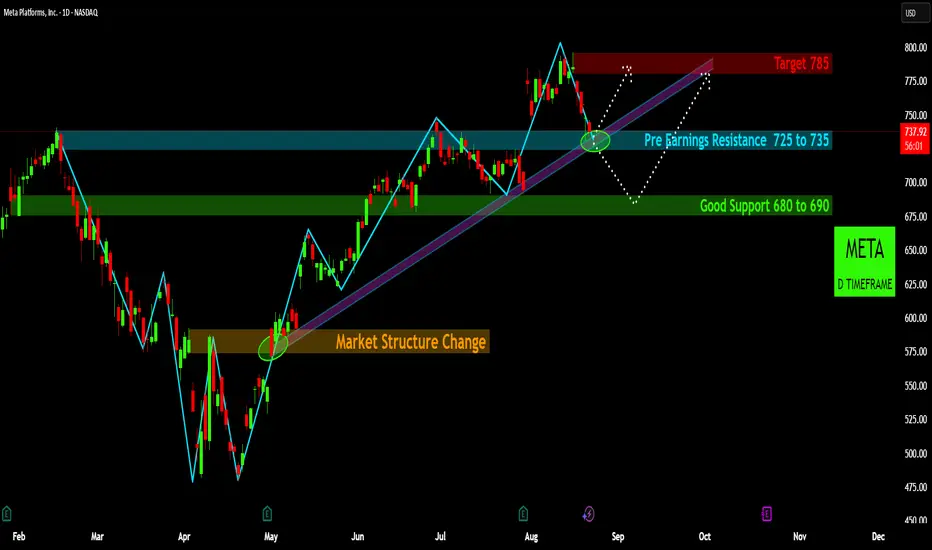
META's Uptrend: What to Watch NextMETA Stock: Key Levels & Potential Trades
Uptrend intact: META has been in a strong uptrend since May, consistently finding support along the green trendline and making higher highs.
Current Level: The stock is currently retraced back to $725 and $735 zone, which was Pre Earnings Resistance Area.
Potential Trades:
Bullish: If META can stay above $735, we can target $785.
Key Support: If it struggles at this resistance or pulls back, look for strong support in the
680−690 range.
The Overall Uptrend is still intact.
Disclaimer:
The information provided in this chart is for educational and informational purposes only and should not be considered as investment advice. Trading and investing involve substantial risk and are not suitable for every investor. You should carefully consider your financial situation and consult with a financial advisor before making any investment decisions. The creator of this chart does not guarantee any specific outcome or profit and is not responsible for any losses incurred as a result of using this information. Past performance is not indicative of future results. Use this information at your own risk. This chart has been created for my own improvement in Trading and Investment Analysis. Please do your own analysis before any investments.
META Stock Chart Fibonacci Analysis 082025Trading Idea
1) Find a FIBO slingshot
2) Check FIBO 61.80% level
3) Entry Point > 735/61.80%
Chart time frame:B
A) 15 min(1W-3M)
B) 1 hr(3M-6M)
C) 4 hr(6M-1year)
D) 1 day(1-3years)
Stock progress:C
A) Keep rising over 61.80% resistance
B) 61.80% resistance
C) 61.80% support
D) Hit the bottom
E) Hit the top
Stocks rise as they rise from support and fall from resistance. Our goal is to find a low support point and enter. It can be referred to as buying at the pullback point. The pullback point can be found with a Fibonacci extension of 61.80%. This is a step to find entry level. 1) Find a triangle (Fibonacci Speed Fan Line) that connects the high (resistance) and low (support) points of the stock in progress, where it is continuously expressed as a Slingshot, 2) and create a Fibonacci extension level for the first rising wave from the start point of slingshot pattern.
When the current price goes over 61.80% level , that can be a good entry point, especially if the SMA 100 and 200 curves are gathered together at 61.80%, it is a very good entry point.
As a great help, tradingview provides these Fibonacci speed fan lines and extension levels with ease. So if you use the Fibonacci fan line, the extension level, and the SMA 100/200 curve well, you can find an entry point for the stock market. At least you have to enter at this low point to avoid trading failure, and if you are skilled at entering this low point, with fibonacci6180 technique, your reading skill to chart will be greatly improved.
If you want to do day trading, please set the time frame to 5 minutes or 15 minutes, and you will see many of the low point of rising stocks.
If you want to prefer long term range trading, you can set the time frame to 1 hr or 1 day
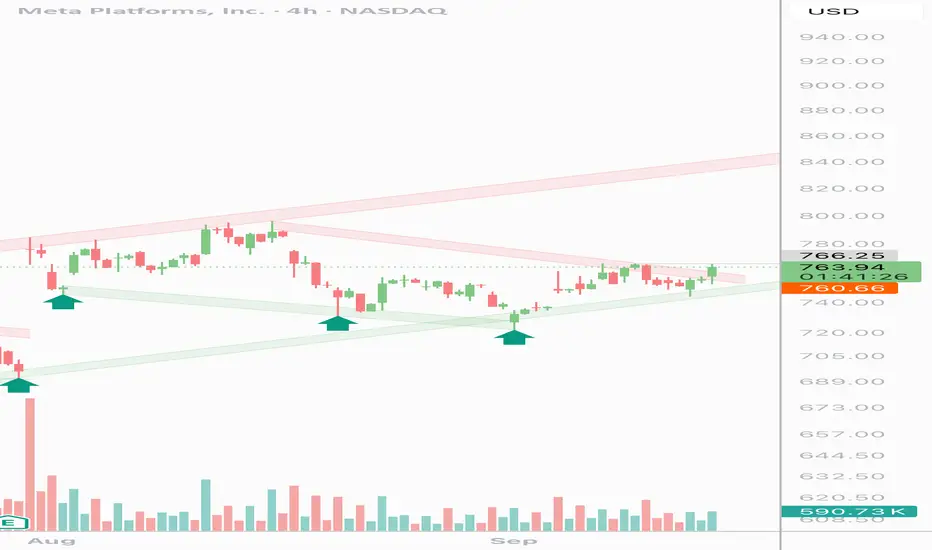
$META: Narrative Extended🏛️ Research Notes
Exploring non-linear dynamics
Original Structure After witnessing the outcome I was intrigued to see how extended narrative would look like.
Logical Continuation

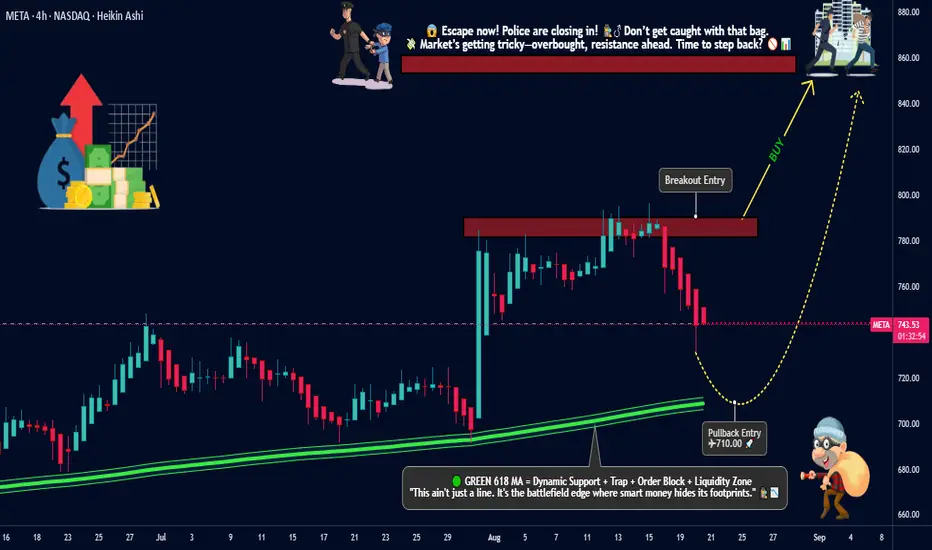
META Platforms Inc. Heist: Breakout Loot vs Pullback Entry🚨META Platforms Inc. Stock Heist Plan🚨
💎Asset: META Platforms Inc. (Swing Trade Robbery)
💎Plan: Bullish Break-In
📈 Breakout Entry: 790.00 (Vault Door Break)
📉 Pullback Entry: 710.00+ (Sweet Spot for the Thieves)
🔑 Any perfect pullback after 710.00, OG thieves may layer orders at chosen levels – stack the loot, DCA style!
🛑 Stop Loss (SL): Thief SL parked @ 675.00 (but remember OG’s—adjust based on your risk appetite & personal robbery strategy).
🎯 Target (Escape Point): 850.00 (Police barricade spotted! Don’t get greedy—take the cash and run before sirens go off 🚔💨).
🕵️♂️ Thief Trader Notes:
Use layering method (multiple limit orders) for maximum loot collection.
Don’t panic if guards (market makers) try to set traps; patience is the true thief’s weapon.
Adjust SL to protect your robbery stash.
Stay sharp—volatility = more doors to break in!
⚠️ Trading Alert for OG’s:
News & earnings reports are like security alarms—avoid entering new trades at that time.
Use a trailing SL to lock in profits once you’re in the getaway car 🚗💨.
💥 If you like this META Heist Plan, smash the Boost Button 💥 and join the robbery crew. Together we loot the markets, one breakout at a time! 🤑💰🏆