Cup and HandlePossible stop under handle low or MC/mid cup..or under 162.5 if you are being conservative (o:
C is too far away for stop, some use the last pivot low..
Can be volatile so if you do not like entry today, wait until tomorrow perhaps..
Not a recommendation
Moderna, Inc. Shs Cert Deposito Arg Repr 0.0526315789 Shs
No trades
Market insights

MRNA: a bigger cup with a handle pattern is formingMRNA’s short-, long- and mid-term trend charts are presented.
In both the weekly and daily charts the trend continues to be rising.____
Prompt: New traders should take some time and carefully read the post entitled 'You can't beat the market' that is located in my profile.
Disclaimer
The author of this text is not an investment advisor. The preceding content is intended to be used for informational and educational purposes only.
It is not an advice or inducement for the purchase or sale of the products mentioned. Before making any investment based on your own personal circumstances,
it is very important to do your own research and analysis and also take independent financial advice from a professional to verify any information provided here.

The HERCULES portfolio The HERCULES portfolio is introduced.
The stocks that make up the portfolio were selected according to the following criteria:
1) belong to different business sectors
2) the sectors have great future growth prospects
3) their medium to long-term trend is upward
4) be growth shares
5) be financially healthy
6) either be profitable or have the prospect of becoming
7) their technical picture reveals that they will likely over perform the market.
Below are presented the mid-term trend charts of the stocks that make up the portfolio.
The HERCULES portfolio is designed so as to, although it is aggressive, let the investor to sleep calm at night.
In case of general market sharp correction the stocks of HERCULES portfolio have the potential to come back into their upward trend.
New stocks may be added to the portfolio in the coming period and some removed from it depending on their course.
Next follows the mid-term performance chart of HERCULES portfolio without the CRSR.
Prompt: New traders should take some time and carefully read the post entitled 'You can't beat the market' that is located in my profile.
Disclaimer
The author of this text is not an investment advisor. The preceding content is intended to be used for informational and educational purposes only.
It is not an advice or inducement for the purchase or sale of the products mentioned. Before making any investment based on your own personal circumstances,
it is very important to do your own research and analysis and also take independent financial advice from a professional to verify any information provided here.

Clean Setup in MRNAIt hasn't broken out yet, but MRNA looks poised to continue higher. I wouldn't mind a starter here because risk is so easy to manage. This name seems like it will be obvious in hindsight, but people overlook it now because they want the hot new stock. This technology is revolutionary and will become brand name. It doesn't have the upside that it once had, but that doesn't mean you shouldn't want to own it.

MRNA, RSI Indicator left the overbought zone on Feb 11, 2021This is a signal that MRNA's price could be shifting from an uptrend to a downtrend. Traders may consider selling the stock or exploring put options. Tickeron's A.I.dvisor looked back and found 24 similar cases where MRNA's RSI Indicator left the overbought zone, and in 19 of them led to a successful outcome. Odds of Success: 79%. Current price $180.71 is above $74.10 the highest resistance line found by Tickeron A.I. Throughout the month of 01 /11/21 - 02/11/21, the price experienced a +56% Uptrend. During the week of 02/04/21 - 02/11/21, the stock enjoyed a +6% Uptrend growth.
Bearish Trend Analysis
The RSI Indicator demonstrated that the stock has entered the overbought zone. This may point to a price pull-back soon.
The Stochastic Indicator demonstrated that the ticker has stayed in the overbought zone for 4 days. The longer the ticker stays in the overbought zone, the sooner a price pull-back is expected.
Following a 3-day decline, the stock is projected to fall further. Considering past instances where MRNA declined for three days, the price rose further in 50 of 62 cases within the following month. The odds of a continued downward trend are 79%.
MRNA broke above its upper Bollinger Band on January 29, 2021. This could be a sign that the stock is set to drop as the stock moves back below the upper band and toward the middle band. You may want to consider selling the stock or exploring put options.

MRNA long Fisher confirms again possible new highsLooking at side way consolidation to be over
here are the criterias on weekly chart
Fisher transform Positive
3&8 ema + on Weekly
3&8 ema + on 3 Days
8&34 ema + on weekly
Some basic E.W. to match
Weekly pivot respected
Wrong analysis if break 395 again in my books

MRNA - Ceiling is hereTrade MRNA with caution and strict SL.
It may blow past the resistance band, but there is a risk of a sharp turnaround due to the parabolic rise in price and valuation.


breaking up once again the price discounted taken into account the dilution of public offering of 17,600,000 shares of common stock , some more clarification and positive news about phase one and this going up more

MRNA flawed cup and handleNeed more volume on the handle and ideally should be at least 5 days long. Tight SL at $170

MRNA: a very perfect cup with a handle pattern to be true?MRNA’s short-, mid- and long-term trend are presented. In both the weekly and daily charts the trend continues to be rising.
We remain bullish as long as the mid-term trend is rising regardless of the short-term moves. ___
Prompt: New traders should take some time and carefully read the post entitled 'You can't beat the market' that is located in my profile.
Disclaimer
The author of this text is not an investment advisor. The preceding content is intended to be used for informational and educational purposes only.
It is not an advice or inducement for the purchase or sale of the products mentioned. Before making any investment based on your own personal circumstances,
it is very important to do your own research and analysis and also take independent financial advice from a professional to verify any information provided here.

$MRNA at the ATH .. breakout measured move is not completeAt the all time high levels. the measured move on the triangle breakout is not completed yet
once the new high is made .it can escalate fast

MDRN cup & handle move upIDX:MDRN
I think we can see a nice move up for MDRN. I'm bullish long term on Moderna's mRNA technology. What do you think guys?

$MRNA C/H this trade only works out if it breaks 78 and holdsCup and handle. Pretty simple here. Dont want to drop too much and need to break the previous highs to make moves. Targeting the 1.618 here.

190 in short rangeIf only we get supply at 180-185 (high volumes with downbars), first step will be 190, with secondary target at 220.


$MRNAWith the spinning top, it means that traders are in disagreement. There is a negative bias on the daily for it to go to the middle Bollinger. In the short term, it will trend up and retrace to about $170 and move back down to the $145-$150. The yellow dotted line indicates the potential move.

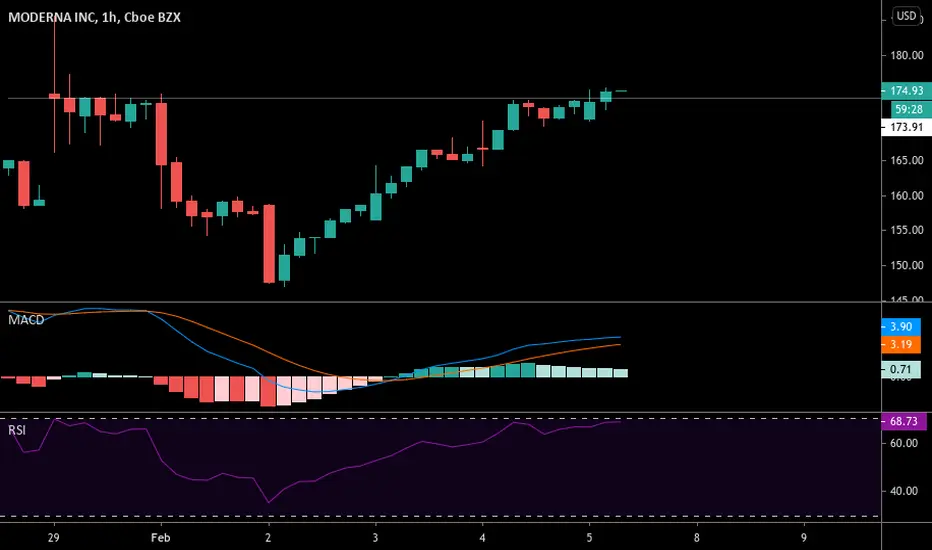
MRNA seems ready to continue its risingThe short-term trend chart of MODERNA is presented. ___
Prompt: New traders should take some time and carefully read the post entitled 'You can't beat the market' that is located in my profile.
Disclaimer
The author of this text is not an investment advisor. The preceding content is intended to be used for informational and educational purposes only.
It is not an advice or inducement for the purchase or sale of the products mentioned. Before making any investment based on your own personal circumstances,
it is very important to do your own research and analysis and also take independent financial advice from a professional to verify any information provided here.


Moderna trends again to ATHModerna takes another try to go over ATH.
With good vaccancies and news in background, this stock is lacking behind other companies and will break to new ATH.

