MRVL watch $101-102: Double Golden zone may pause the UptrendMRVL trying to catch up to its semi-conductor brethren.
It just spiked into Dual Goldens at $101.40 and 102.47.
Look for a Break-n-Retest or a Dip-to-Fib like $93.xx zone.
Trade ideas

MRVL Short IdeaMRVL Short Idea. Classic bearish divergence on both the RSI and MacD at the 2021 ath. Market participants just confirmed $94 as resistance with confirmation. Seems like a low risk short here as long as price doesn't get back above $94. Let's see what happens. Kangs.

MRVL - RSI Back Above 50, Eyes Fibonacci Targets at 99 and 112MRVL - CURRENT PRICE : 86.00 - 88.00
MRVL is showing early signs of bullish continuation after finding support near the 50-day EMA and rebounding with positive momentum. The price structure remains healthy as it trades above the EMA 50, suggesting the medium-term trend is still intact.
Key Technical Highlights :
1) Price Above EMA 50
The stock price is holding above the EMA 50, showing that the uptrend remains valid and buyers are still in control.
2) RSI Above 50 and Not Overbought
RSI has crossed back above the 50 level, confirming improving momentum while staying below overbought territory, leaving more room for upside.
3) MACD Structure
Although the MACD line is still below the signal line, both are positioned above the zero level, indicating the overall market tone remains positive with potential for a new bullish crossover.
Based on Fibonacci extension, potential upside targets are at :
1st Target: USD 99.00 (0.618 level)
2nd Target: USD 112.00 (1.000 level)
ENTRY PRICE : 86.00 - 89.00
FIRST TARGET : 99.00
SECOND TARGET : 112.00
SUPPORT : 80.50

MRVL: watching for bottom formation in coming monthsPrice continues to act in line with the trend structure outlined in the October update, starting a pullback after reaching the mid-term resistance zone and now reacting from the first level of support.
While a final push lower toward the 50-day MA remains possible in the near term, I’ll be watching for bottoming signs and the formation of a new base over the coming weeks and months.
Chart:
Previously:
• On downside potential (Aug 11):
Chart:
www.tradingview.com
• On support (Aug 25):
Chart:
www.tradingview.com
• On resistance zone (Oct 2):
Chart:
www.tradingview.com
• On pullback potential (Oct 10):
Chart:
See weekly review:

MRVL | Another Semi Run Coming | LONGMarvell Technology, Inc. engages in the design, development, and sale of integrated circuits. Its products include data processing units, security solutions, automotive, coherent DSP, DCI optical modules, ethernet controllers, ethernet PHYs, ethernet switches, linear driver, PAM DSP, transimpedance amplifiers, fibre channel, HDD, SSD controller, storage accelerators, ASIC, and Marvell government solutions. It operates through the following geographical segments: United States, Singapore, Israel, India, China, and Others. The company was founded by Wei Li Dai and Pantas Sutardja in 1995 and is headquartered in Wilmington, DE.

$MRVL pullback below $75 sets up new long to $100+MRVL is consolidating in an expanding triangle (bullish) chart formation however price action looks a bit extended here.
I think it's likely that we pullback from here into one of the support levels below, and then that will setup a fresh long up to the upper resistance levels on the chart.
Let's see how the idea plays out over the coming weeks.

wait for pullback to get in to MRVLThe resistance is at current price level of 82 and been rejected three times. It is possible it will break up this time but to be safe, let's see if it pull back or break up with a bullish signal before going long.

Ai nfraExpected to see growth as we see a strong bounce from lower. Channel and weekly RSI has potential to extend higher.

Marvell - Marvelous comebackNASDAQ:MRVL price action has seen steady uptrend returning after closing above the US$80.00 psychological level. we expect MRVL to have a good run up 109 and 128 over the longer-term period. Momentum is rising across all short, mid, and long-term indicator. Prices to queue is at 79.75 and 75.00.

MRVLTechnical Overview
Current Price: Around $67.35
Major Uptrend Line: A long-term rising trendline from 2019 remains intact, supporting the broader bullish structure.
Key Support & Buy Zones
Primary Buy Zone: $63.34 – $61.44
This zone aligns with historical price congestion and the major uptrend support.
Secondary Buy Zone: $50.86 – $50.73
Deeper support from previous accumulation areas.
Stop Loss: A daily close below $46 would invalidate the bullish setup and signal potential trend reversal.
Resistance & Target Levels
Target 1: $92
Strong historical resistance; a break above this level could open the door for further upside.
Target 2: $127
The previous all-time high area and next major upside objective.
Trend & Momentum
Trend: Despite recent volatility, the long-term structure shows higher lows, indicating the primary trend is still up.
Momentum: The stock recently bounced from the buy zone near $63, suggesting buyers are active. Sustaining above $63 is key for the next bullish leg.
Trading Strategy Idea
Aggressive Entry: Accumulate near $63–61 with a stop below $46.
Conservative Entry: Wait for a clear break and daily close above $70 to confirm renewed momentum toward $92.
Summary:
Marvell Technology remains in a long-term uptrend with critical support at $63–61. Holding above this zone favors a move toward $92 and possibly $127, while a close below $46 would negate the bullish outlook.

Marvel. Short for now. Long Later.Marvel was a short idea for me at like $77. Now I am looking for lower and potential longs. I will only long in the box if we get there. Its the only sensible yearly and fib level that would justify a long term entry for me. I will wait and if we get there I am in. I create these charts way in advance so I have a plan when we get there. This is a very long term mindset.
I always get messages from mods to explain my trades. I often cant. It comes from almost 10 years of looking at charts. I know trend, levels and my proprietary fib pulls. My record shows for itself. I don't believe anyone should ever copy trade me. All my trades are long term holds and heat is expected in the near term.

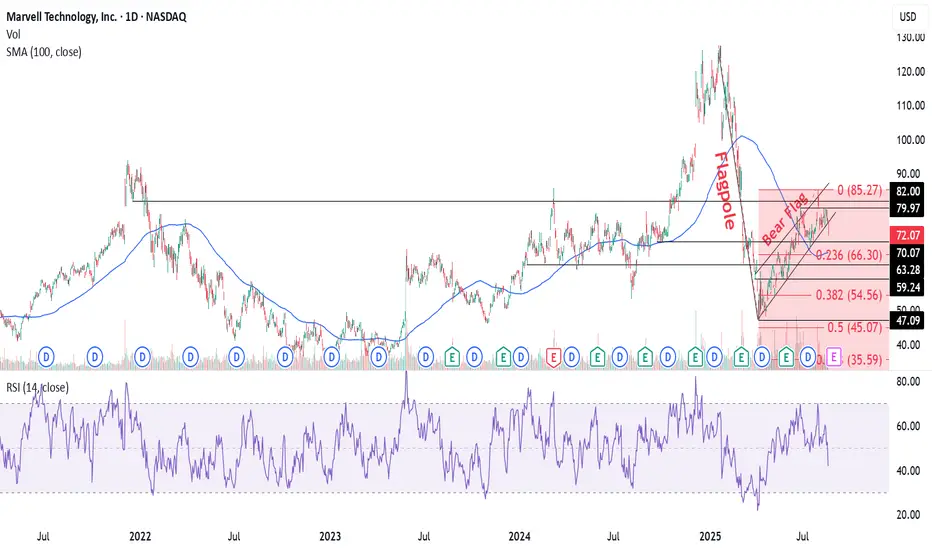
MRVL Hidden Trend: Navigating the Silent DeclineMRVL Bear Flag Pattern
The MRVL chart indicates a bear flag formation, suggesting a continuation of the downtrend from its all-time high of $127.48 in January 2025. After hitting a low of $47.09 in April 2025, the stock consolidated between $47-$85. The recent breach below the sideways channel reflects the bear flag's flagpole, echoing the preceding downward trend.
Technical Indicators
The stock trades below its 50 DMA ($74.28) and 200 DMA ($83.13), reinforcing bearish sentiment. The daily RSI at 42 further underscores weakening momentum.
Trading Strategy
• Entry: $72-$70
• 1st Target : 100 DMA at $66.84, aligning with the 0.236 Fibonacci extension level at $66.30
• Next Targets : $63.28, $59.24, and $54.56
• Stop Loss : $80
Potential Downside
Should bearishness persist, the stock may revisit its 52-week low of $47.09, marking a significant support level.
MRVL Earnings Play--Don’t Miss Out
# 🚀 MRVL Earnings Play (8/28 AMC) 🚀
💎 **Moderate Bullish | 75% Conviction** 💎
🎯 **Trade Setup**
📊 Ticker: \ NASDAQ:MRVL
🔀 Direction: CALL 📈
🎯 Strike: 80.00
📅 Expiry: 2025-08-29
💵 Entry: 2.23 (ASK)
📦 Size: 1 contract (risk 💸 \$223)
🎯 Profit Target: 6.69 (200%)
🛑 Stop: 1.12 (-50%)
⏰ Timing: Pre-earnings close (8/28 AMC)
⚡️ **Why Bullish?**
* 🚀 AI/data-center sector tailwinds
* 📈 Heavy OTM call OI at \$78–85 (dealer hedging fuel)
* 🔥 Pre-earnings drift (+2.49% today)
* 📊 IV elevated but not extreme → room for upside
✅ **Execution Rule**: In before close, out within 2h post-earnings or at stop/target.
---
### 📌 Suggested TradingView Tags
\#MRVL #Marvell #EarningsPlay #OptionsTrading #CallOptions #WeeklyOptions #BullishSetup #MomentumTrading #TradeIdeas #StockMarket 🚀📊

MRVL $80 Call: Balanced Risk, High-Reward LEAP Trade!
## 💎 MRVL \$80 LEAP – Long-Term Semiconductor Bullish Play! (Sep 2026 Expiry) 💎
### 🔑 Market Summary
* 📊 **Momentum:** Weekly RSI shows short-term bullish recovery; monthly chart signals caution → mixed to moderately bullish
* ⚖️ **Options Flow:** Favorable volatility environment supports LEAP strategy
* 🏦 **Institutional Sentiment:** Mixed; some accumulation noted, but bearish long-term trend remains a caution
* 🌐 **Sector Context:** Semiconductor market recovery potential, but watch for broader bearish drivers
---
### 📈 Trade Setup
* 🟢 **Direction:** LONG CALL
* 🎯 **Strike:** \$80.00
* 💵 **Entry Price:** \~\$15.50
* 📅 **Expiry:** Sep 18, 2026 (\~13 months)
* 📊 **Size:** 1 contract
* ⏰ **Entry Timing:** Market open
* 📈 **Confidence Level:** 75%
---
### 💥 Risk & Reward
* 🏆 **Profit Target:** \$31.00 (100%+ potential upside; aggressive target \~\$46.00)
* 🛑 **Stop Loss:** \$10.50 (30–40% of entry price)
* ⚡ **Key Risks:** Bearish monthly momentum, semiconductor sector headwinds, potential bull trap
* 🔄 **Recommendation:** Enter cautiously, monitor weekly momentum for continuation signals
---
### 🔥 Hashtags for Viral Sharing
\#MRVLLEAP #MRVLOptions #Semiconductors #LongTermCall #LEAPs #BullishPlay #TradingViewAlerts #WallStreet

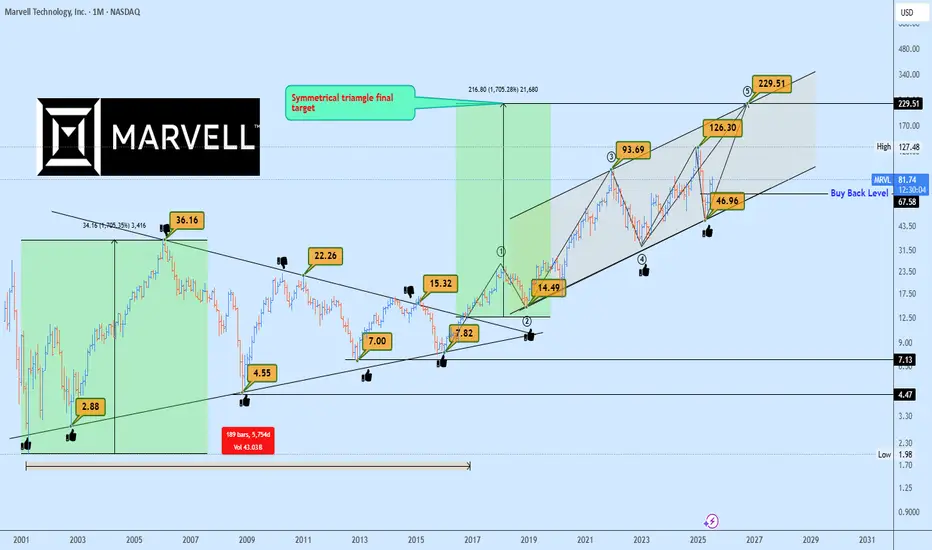
MRVL Massive 15-Years Symmetrical Breakout Targets AheadMarvell Technology (MRVL) has just completed a monumental breakout from a 15-years symmetrical triangle, a rare and powerful long-term accumulation structure. This type of macro consolidation typically precedes a major directional expansion, and in this case, the breakout confirmed bullish continuation.
Currently, MRVL is forming a rising channel structure, with price bouncing cleanly from the lower boundary confirming demand and the continuation phase of the macro move.
The 1:1 projection from the symmetrical triangle gives us a clear target trajectory, with the final leg potentially extending to $229, aligning perfectly with the upper boundary of the rising channel.
In the short to mid-term, the ideal buyback opportunity rests near $67.50, should the market retest previous breakout support or the lower boundary of the channel once more. This zone offers asymmetric risk-to-reward potential for long-term investors and swing traders alike.
Key Targets
📈 $67.50 – Buyback Opportunity Zone
📈 $229 – Rising Channel Top / 1:1 Expansion Target
A breakout this large is no coincidence, it’s backed by years of price compression and institutional positioning. Now is the time to watch closely.
📩 Drop your view in the comments and share your stock requests for quick analysis.
Only stock assets will be accepted under this post.
MRVL | Ichimoku Breakout Setup with Fractal and MACDMarvell Technology (MRVL) just printed a clean bullish breakout setup across multiple technical systems. Here's the breakdown:
Why This Setup Matters
Ichimoku Cloud: Price has decisively cleared the cloud with bullish Tenkan-Kijun alignment. The Senkou Span A is rising, and the cloud ahead is thin — suggesting low resistance and potential acceleration.
Fractal Support: Multiple upward fractals formed near the $73–$74 support zone, validating the base before the breakout. Price broke the most recent fractal high, triggering a potential continuation.
MACD Momentum: A bullish crossover just occurred, with the histogram flipping positive — a classic momentum confirmation following consolidation.
Trade Parameters
Entry: $76.02
Stop: $70.41 (below the recent flat Kijun and cloud base)
Target: $89.93 (R1 pivot zone and psychological resistance)
Risk:Reward Ratio: 2.48
Projected Move: +18.35%
Additional Confluence
The Kumo breakout occurred alongside a flat Kijun and a narrowing cloud — a textbook edge-to-trend signal.
Price structure has formed higher lows since June.
Potential for strong institutional interest heading into earnings.
Risk Notes
Watch for rejection around $78.50 (prior resistance zone).
The upcoming cloud twist is narrow — if the Tenkan turns flat, a short-term pullback could occur before continuation.
Let me know in the comments if you're watching MRVL or trading this breakout. I’ll post an update if we get confirmation above $78 with volume.

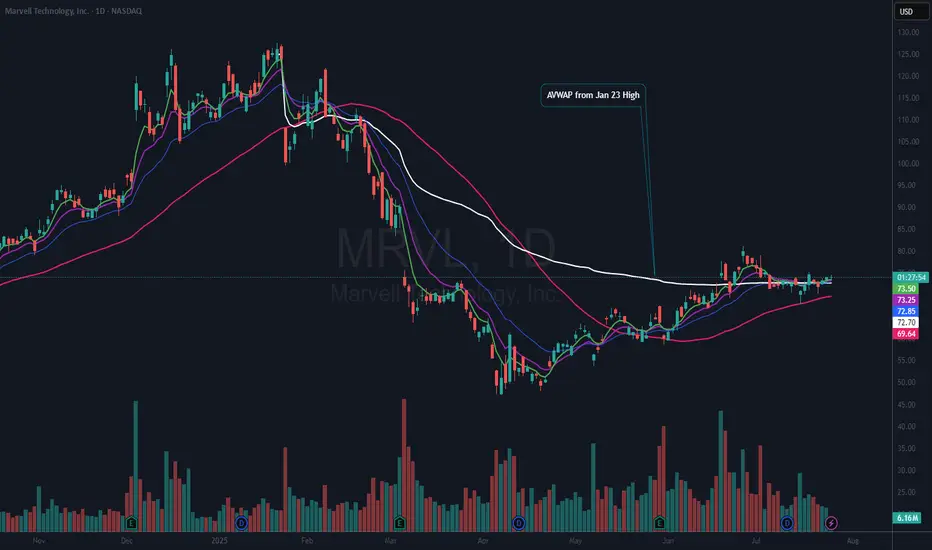
$MRVL Nice Risk Reward HereNASDAQ:MRVL is still basing so this could be quite an early trade. However, I did put on a ½ size position yesterday as it rose above the 21 EMA (blue). I like that it is over the AVWAP from the Jan 23rd all-time high (ATH). That means that by price and volume the majority of stockholders are at or near breakeven since that ATH. Which also tells me that there are not many sellers left and that the stock has a chance of entering a stage 2 uptrend.
My current stop will be based on a solid close below the 50 DMA (red). I want to add to my position “if” we can get a good follow-thru day above $75.26.
If you like this idea, please make it your own and follow “your” trading rules. Remember, it is your money at risk.
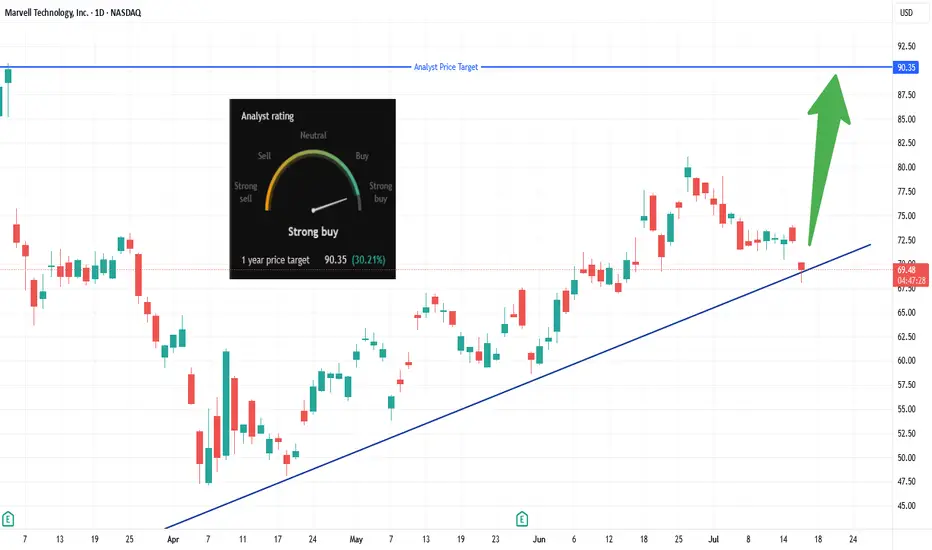
MRVL Long Breakout Setup, Eyes $90 Target!Looking to enter long on a clear breakout above $70.13 (today’s high).
• Entry: Above $70.13
• Stop-Loss: Below today’s low (~$68.50) to protect capital
• Target: $90.35 – per analyst consensus (~+30%)
✅ Why:
📈 Trendline bounce & momentum: Price holding strong above an ascending trendline from April suggests buyers are stepping in.
🏢 AI-chip catalyst: Marvell’s custom ASICs are gaining traction with Amazon, Microsoft, and Google—data-center demand is surging.
💰 Analyst confidence: Consensus is “Strong Buy” with average targets between $90–$94 (some as high as $133).
🧩 Market & Sector Tailwinds: AI chip stocks rallying; Marvell poised as lower-cost custom-chip alternative to Nvidia—and undervalued vs peers.
*** Be sure to follow us for more trade setups! ***
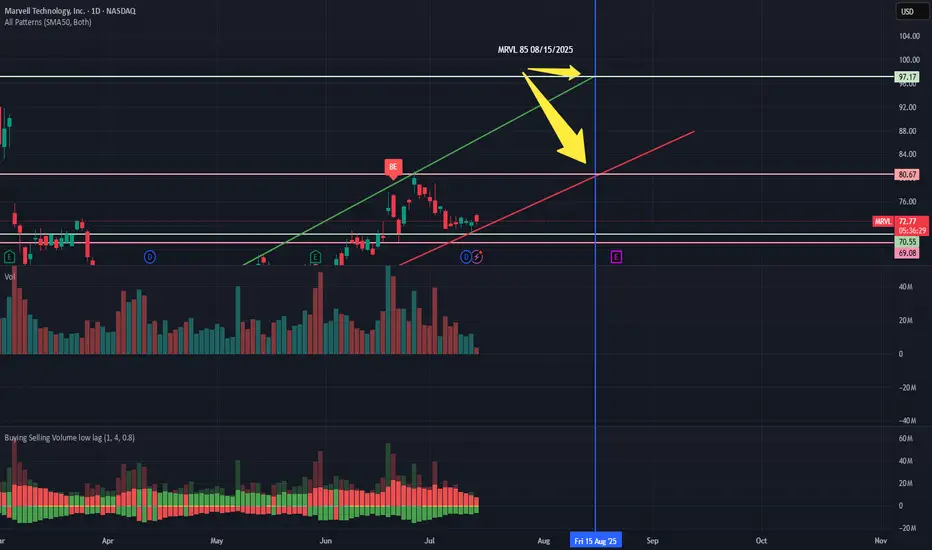
MRVL Trading Idea For Q2 EarningsNFA
I bought a few contracts for Call options for MRVL 08/15/2025 85 C last week.
Let's see how it plays out up to the earnings announcement and a few days beyond. :)
GLTA
MRVL watch $64.40/43: proven Double Fib holding up the recovery MRVL trying to recover with the chip sector.
Up against a proven Double Fib at $64.40/43.
Look for a Dip-to-Fib or Break-n-Retest entry.

MRVL BullishIncreased volatility on weekly tf as indicated by BBWP. Significant volume increase on the weekly as well. Momentum indicators pointed up. Resistance 1 @ $78-80. Resistance 2 @ $85-$95 range. Psychological Resistance @$100. I have calls dated Aug.15th. $100 strike. Decent enough lotto ticket i think and if it hits it could be huge.....

MRVL .. a marvel move when you use TA like a childNot a fan of TA and think its just making excuses to draw lines and pretend that how life works....
but here are some doodles I came up with...it was too cluttered so I left the simplest one up and the rest follow just in a closer view...
Just top to bottom at the first two pivot peaks and then parallel channel to the bottom and use decimals for each line to replicate.
The others here are low to low bow connects with their equal reversal lines attached to their peaks, in between the bows.
And the dark blue is the same line from above but it is attached to every high peak thats important down the whole fall.
Blue lines:
Green lines:
Teal lines:
All together up close:
1hr chart....
but they are super secret
and the indicators I use with them

MRVL has broken out of a bullish patternMRVL has broken out of a bullish consolidation pattern, signaling a potential continuation of upward momentum. The price action suggests a move toward the $80 level is underway.
