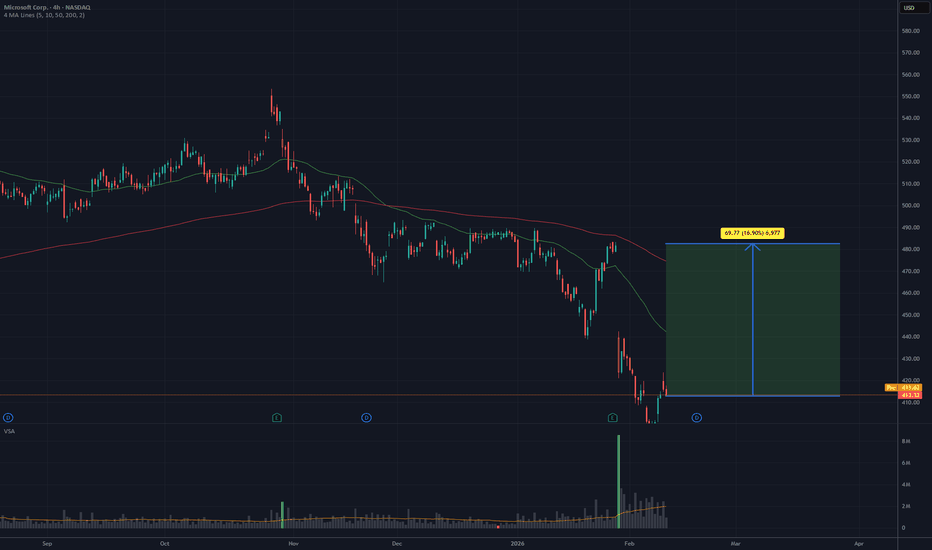
Microsoft: a major technical support at $350–$400Should Microsoft stock once again be considered in a DCA zone, after having corrected on the stock market since last November and now being the most expensive (in valuation terms) among the Magnificent 7 stocks?
This is the question I will address in this new analysis on TradingView. Feel free to f
Microsoft Corp.
No trades
Key facts today
Microsoft (MSFT) shares fell about 17% this year, driven by AI business risks and competition from Google's Gemini and Anthropic's Claude, losing roughly $613 billion in market value.
Microsoft has launched a pilot with eight publishers, including People and the Associated Press, investing over $10 million to simplify licensing for AI-generated content.
Microsoft, alongside Alphabet and Amazon, has committed $68 billion for AI and cloud investments in India by 2030, aiding the nation's aim to be a global AI hub.
675 ARS
105.44 T ARS
291.72 T ARS
About Microsoft Corp.
Sector
Industry
CEO
Satya Nadella
Website
Headquarters
Redmond
Founded
1975
IPO date
Mar 13, 1986
Identifiers
2
ISIN ARDEUT110285
Microsoft Corp engages in the development and support of software, services, devices, and solutions. It operates through the following business segments: Productivity and Business Processes; Intelligent Cloud; and More Personal Computing. The Productivity and Business Processes segment comprises products and services in the portfolio of productivity, communication, and information services of the company spanning a variety of devices and platform. The Intelligent Cloud segment refers to the public, private, and hybrid serve products and cloud services of the company which can power modern business. The More Personal Computing segment encompasses products and services geared towards the interests of end users, developers, and IT professionals across all devices. The firm also offers operating systems; cross-device productivity applications; server applications; business solution applications; desktop and server management tools; software development tools; video games; personal computers, tablets; gaming and entertainment consoles; other intelligent devices; and related accessories. The company was founded by Paul Gardner Allen and William Henry Gates III in 1975 and is headquartered in Redmond, WA.
Related stocks
It's a time for MSFT - 15 % potential profit - 480 USDMicrosoft shares are currently in a clear phase of strong sell-off following the peak in October/November 2025 (~$540–550+), where a classic breakout occurred followed by a breakdown of the uptrend. The decline from the high has already reached ~24–25%, and in 2026 alone the stock has lost more than
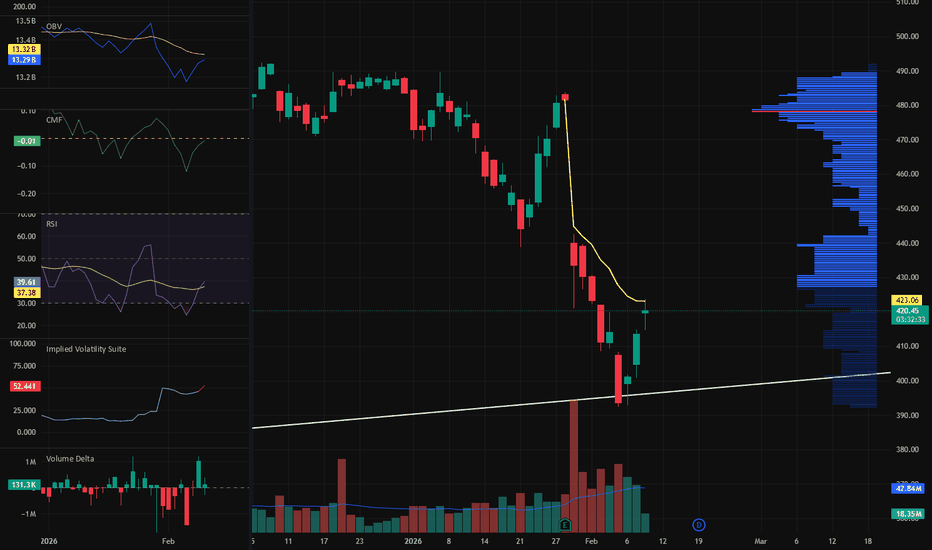
MSFT 424 Is the Real Test for BuyersJust like I mentioned earlier, 424 is the real test for buyers, and today’s action confirms it. Buyers were much more aggressive yesterday, but once sellers showed up again at 424, the bid clearly softened. That tells me this level is being actively defended and remains the most important area for s
MICROSOFT (MSFT) Market update, Weekly Insight.Fundamental Analysis:
As of today, Microsoft shares are valued are at 404.37, the company market cap stands at 3.09T, with a P/E ratio of 25.30 and dividend yield of 84.1%. an announcement was made on Wednesday that top security leader Charlie Bell will take on a new role, and that Hayete Gallot wi
MSFT (USA) - About to Bounce Or Heading to the Bottom ?Microsoft has been one of the dominant performers of the past decade, up roughly 630% over the last 10 years and was at its peak before this recent heavy pullback which has wiped out its gains for the year. As a software and cloud computing giant , it still very much sits at the centre of enterp
Microsoft - The worst day in 5 years!🚀Microsoft ( NASDAQ:MSFT ) remains bullish despite the crash:
🔎Analysis summary:
Today Microsoft created its worst day in five years. But at the same time, Microsoft is also approaching a significant confluence of support. And if we soon see bullish confirmation, Microsoft will just create an
Microsoft $MSFT finally reached the strong monthly demand $396Microsoft NASDAQ:MSFT stock has finally reached the strong monthly demand $396. We talked about this imbalance a few weeks ago in another analysis after seeing the dark cloud cover bearish piercing pattern in the monthly timeframe.
It took a few months half a year to pull back to this imbalance.
$MSFT testing Major Support 200 EMA - Pass or Fail??NASDAQ:MSFT : my bet is long-term upside as long as it holds the 200 EMA (purple) and the major support at 413.
Support: 413
Major resistance: 553
If 413 fails: next levels 389 → 345
200 EMA: it’s the market’s “long-term average price.” When price is above it, the trend is usually healthy; when
See all ideas
Summarizing what the indicators are suggesting.
Oscillators
Neutral
SellBuy
Strong sellStrong buy
Strong sellSellNeutralBuyStrong buy
Oscillators
Neutral
SellBuy
Strong sellStrong buy
Strong sellSellNeutralBuyStrong buy
Summary
Neutral
SellBuy
Strong sellStrong buy
Strong sellSellNeutralBuyStrong buy
Summary
Neutral
SellBuy
Strong sellStrong buy
Strong sellSellNeutralBuyStrong buy
Summary
Neutral
SellBuy
Strong sellStrong buy
Strong sellSellNeutralBuyStrong buy
Moving Averages
Neutral
SellBuy
Strong sellStrong buy
Strong sellSellNeutralBuyStrong buy
Moving Averages
Neutral
SellBuy
Strong sellStrong buy
Strong sellSellNeutralBuyStrong buy
Displays a symbol's price movements over previous years to identify recurring trends.
ATVI4499883
Activision Blizzard, Inc. 4.5% 15-JUN-2047Yield to maturity
6.31%
Maturity date
Jun 15, 2047
ATVI5026499
Activision Blizzard, Inc. 2.5% 15-SEP-2050Yield to maturity
6.19%
Maturity date
Sep 15, 2050
See all MSFT bonds


