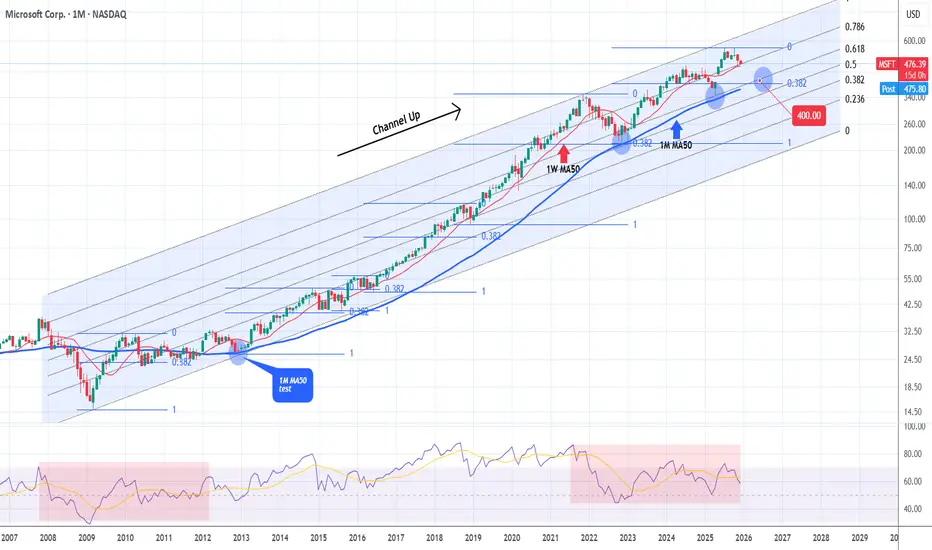
MICROSOFT testing the most important Support of the Cycle.Microsoft (MSFT) hit last month its 1W MA50 (red trend-line) and held. The rebound seems short-lived however as again half-way through December, the market is about to re-test that Support again.
This is a critical Support level for the Bull Cycle that started upon the November 2022 market bottom, as the last two times this broke, the price pulled-back to the 1M MA50 (blue trend-line).
That level has in fact been the ultimate long-term Support since 2012, the most important level of the Channel Up that started after the 2008 Housing Crisis.
We also see here that almost all of the strong bearish corrections within this pattern, hit the 0.382 Fibonacci retracement level and rebounded.
As a result, if 1W MA50 breaks again, we expect the subsequent correction / Bear Cycle to hit $400 at least.
---
** Please LIKE 👍, FOLLOW ✅, SHARE 🙌 and COMMENT ✍ if you enjoy this idea! Also share your ideas and charts in the comments section below! This is best way to keep it relevant, support us, keep the content here free and allow the idea to reach as many people as possible. **
---
💸💸💸💸💸💸
👇 👇 👇 👇 👇 👇
Microsoft Corp.
No trades
Market insights
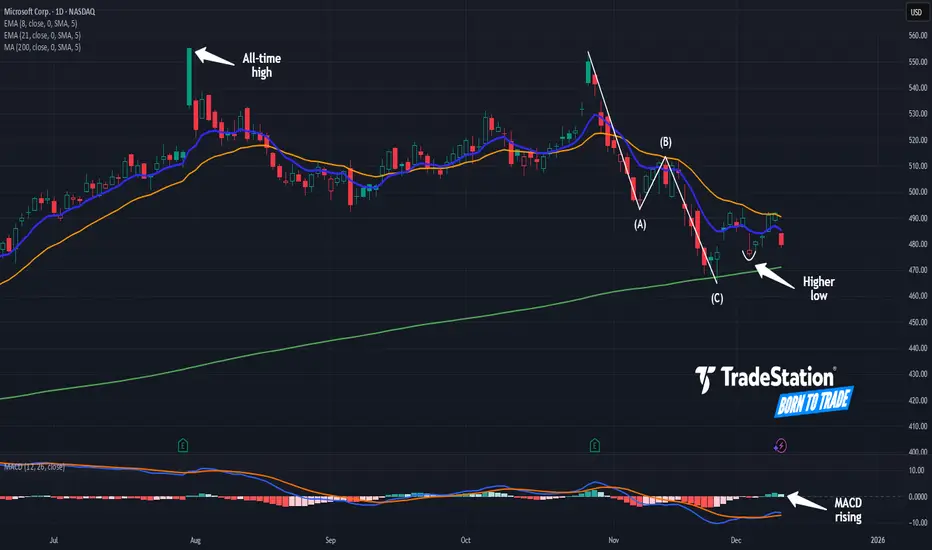
Microsoft May Be TurningMicrosoft struggled in November, but some traders may think it’s turning this month.
Consider the slide after MSFT jumped in late October. MACD was falling throughout the period, giving bulls little opportunity for a rally despite strong quarterly results.
However, a few things seem to the changing.
First, MACD has turned higher. That may suggest that short-term momentum has grown more bullish.
Second, the software giant tested and held its 200-day simple moving average. That may confirm its longer-term uptrend remains intact.
Third, prices made a higher low this month compared with late November.
Next, the pullback may be viewed as a finished A-B-C corrective wave. Completion of that pattern could mark an end to the selling pressure.
Finally, MSFT is an active underlier in the options market. (Its average daily volume of 328,000 contracts ranks 11th in the S&P 500, according to TradeStation data.) That may help traders take positions with calls and puts.
TradeStation has, for decades, advanced the trading industry, providing access to stocks, options and futures. If you're born to trade, we could be for you. See our Overview for more.
Past performance, whether actual or indicated by historical tests of strategies, is no guarantee of future performance or success. There is a possibility that you may sustain a loss equal to or greater than your entire investment regardless of which asset class you trade (equities, options or futures); therefore, you should not invest or risk money that you cannot afford to lose. Online trading is not suitable for all investors. View the document titled Characteristics and Risks of Standardized Options at www.TradeStation.com . Before trading any asset class, customers must read the relevant risk disclosure statements on www.TradeStation.com . System access and trade placement and execution may be delayed or fail due to market volatility and volume, quote delays, system and software errors, Internet traffic, outages and other factors.
Securities and futures trading is offered to self-directed customers by TradeStation Securities, Inc., a broker-dealer registered with the Securities and Exchange Commission and a futures commission merchant licensed with the Commodity Futures Trading Commission). TradeStation Securities is a member of the Financial Industry Regulatory Authority, the National Futures Association, and a number of exchanges.
Options trading is not suitable for all investors. Your TradeStation Securities’ account application to trade options will be considered and approved or disapproved based on all relevant factors, including your trading experience. See www.TradeStation.com . Visit www.TradeStation.com for full details on the costs and fees associated with options.
Margin trading involves risks, and it is important that you fully understand those risks before trading on margin. The Margin Disclosure Statement outlines many of those risks, including that you can lose more funds than you deposit in your margin account; your brokerage firm can force the sale of securities in your account; your brokerage firm can sell your securities without contacting you; and you are not entitled to an extension of time on a margin call. Review the Margin Disclosure Statement at www.TradeStation.com .
TradeStation Securities, Inc. and TradeStation Technologies, Inc. are each wholly owned subsidiaries of TradeStation Group, Inc., both operating, and providing products and services, under the TradeStation brand and trademark. When applying for, or purchasing, accounts, subscriptions, products and services, it is important that you know which company you will be dealing with. Visit www.TradeStation.com for further important information explaining what this means.
MSFT Selling Pressure Activated — Time to Short!🔥 MSFT Bearish Profit Playbook — Thief-Style Layer Attack Activated! 🔥
Asset: MSFT — Microsoft Corporation (NASDAQ)
Style: Swing / Day-Trade Playbook 📉💼
📉 Plan: Bearish Pressure Play — Smart Sell-Side Thief Approach
Microsoft is showing potential exhaustion on the upside, and this setup focuses on a structured bearish move using a layered sell-limit strategy (Thief Layer Method) 😎🕵️♂️.
🎯 Entry Strategy (Thief Layer Method)
Using the thief-style multi-layer approach, we stack multiple sell-limit orders at different levels to catch premium liquidity:
Sell Limit Layers:
$500, $490, $480
(You can increase or adjust layers based on your own risk tolerance.)
This method aims to fade upward pushes, catching price exhaustion during liquidity grabs.
🛑 Stop Loss (Risk Control)
This is the Thief SL @ $510 🛑
Note: Dear Ladies & Gentlemen (Thief OG’s), I’m not recommending that you use only my stop-loss. It’s your money — your rules. Manage your risk like a pro. 💼⚠️
🎯 Target (Exit Zones)
We are aiming toward strong support zones + potential oversold zones where bearish momentum may slow.
Main Target: $450
Trap may form — escape with profits before the market police catch us 🚓💨
Note: Dear Ladies & Gentlemen (Thief OG’s), I’m not recommending using only my target. Exit where you feel safe and profitable. 🏦✨
📊 Market Summary (Clean, TV-Safe Explanation)
Bearish attempt based on overextended zones
Layered entries help clip premium during upside wicks
Targeting liquidity pockets near support
SL above structural invalidation
Setup respects TradingView House Rules: No financial advice, no promises, no signals, educational thief-style humor only ✔️
🔗 Related Pairs to Watch (Correlation Insights)
Because MSFT is a heavyweight in tech + NASDAQ index weighting:
1️⃣ NASDAQ:QQQ (NASDAQ 100 ETF)
Strongly correlated
If QQQ rejects from local resistance → MSFT bearish play strengthened
QQQ weakness = tech sector weakness
2️⃣ AMEX:SPY (S&P500 ETF)
Broader market risk sentiment
SPY pullback often pressures mega-caps like MSFT
3️⃣ NASDAQ:AAPL (Apple Inc.)
Moves similarly during liquidity rotations
Apple weakness = added pressure to mega-cap tech basket
4️⃣ NASDAQ:NVDA (Nvidia Corp.)
High-beta tech name
When NVDA loses momentum, MSFT downside probability increases through sector rotation
5️⃣ NASDAQ:GOOGL (Alphabet Inc.)
If large-cap tech corrects collectively, MSFT rarely moves opposite
Perfect correlation watch ⚡
Watching these pairs helps confirm bearish bias through sector-wide confirmation, not isolated signals.
✨ “If you find value in my analysis, a 👍 and 🚀 boost is much appreciated — it helps me share more setups with the community!”
⚠️ Disclaimer:
This is a thief-style trading strategy just for fun.
Educational only — not financial advice. Trade at your own risk. 😄🕵️♂️

MSFT Potential Upside Squeeze SetupMSFT is currently forming a constructive structure with clearly defined levels.
On the downside, the 475 put support has been defended three separate times, signaling strong positioning interest and consistent absorption of selling pressure. Price continues to hold above the HVL , with an extremely narrow transition zone and a broadening upward-tilted positive GEX profile — all reinforcing structural stability.
If price breaks upward from the first call wall at 480 , this typically favors continuation rather than any sustained move lower.
Upside levels :
The next major call resistance sits at 500 — which also aligns with the 8/8 level on the MM grid system . This creates a very strong confluence, making 500 a significant resistance zone.
If price cleanly accepts and pushes through 500, dealer hedging flows can accelerate, potentially triggering an upside squeeze — with an initial upside extension capped near 520 .
If momentum continues to build above 500, the next substantial call resistance sits at 520 , currently the second-largest call wall on the chain.
As long as price remains above HVL and the 475 support zone holds, the risk-reward skew favors continuation to the upside, with 480 as the trigger level and 500 as the speculative call-positioning target .
However — critical risk scenario:
If 475 breaks and we do not see a fast rebound from the 470/460 negative squeeze zone , this could initiate a sharp downward move and a trend shift. Currently, the largest protective put concentration sits at 475 — and the put side only begins to melt if price can reclaim 480 .
At least based on the aggregated options chain, MSFT is now under immense compression with clear trigger points .
MSFT tightening under GEX squeeze pressure

$MSFT double top into resistance is a loud sell signalGM traders — just re-entered a NASDAQ:MSFT short. The double top into resistance was a loud “sell” signal for me.
Fundamental backdrop is lining up too: several outlets citing Reuters/enterprise checks say Microsoft cut AI sales growth targets after reps missed quotas and customers were slower to adopt “AI agents.” That reads as near-term demand friction for parts of Copilot/agent monetization.
Even if Azure remains strong, this kind of headline is a sentiment hit — it suggests the AI revenue ramp may be bumpier than bulls were pricing in.
MSFT - 4 months DOUBLE TOP══════════════════════════════
Since 2014, my markets approach is to spot
trading opportunities based solely on the
development of
CLASSICAL CHART PATTERNS
🤝Let’s learn and grow together 🤝
══════════════════════════════
Hello Traders ✌
After a careful consideration I came to the conclusion that:
- it is crucial to be quick in alerting you with all the opportunities I spot and often I don't post a good pattern because I don't have the opportunity to write down a proper didactical comment;
- since my parameters to identify a Classical Pattern and its scenario are very well defined, many of my comments were and would be redundant;
- the information that I think is important is very simple and can easily be understood just by looking at charts;
For these reasons and hoping to give you a better help, I decided to write comments only when something very specific or interesting shows up, otherwise all the information is shown on the chart.
Thank you all for your support
🔎🔎🔎 ALWAYS REMEMBER
"A pattern IS NOT a Pattern until the breakout is completed. Before that moment it is just a bunch of colorful candlesticks on a chart of your watchlist"
═════════════════════════════
⚠ DISCLAIMER ⚠
The content is The Art Of Charting's personal opinion and it is posted purely for educational purpose and therefore it must not be taken as a direct or indirect investing recommendations or advices. Any action taken upon these information is at your own risk.

MSFT Swing Buy Setup — Multi-Factor Bullish Confirmation📈 MSFT QuantSignals V3 Swing Analysis | 2025-12-08
MSFT Swing Signal — 2025-12-08
• Direction: BUY CALLS
• Confidence: 65%
• Horizon: 18 days → 2025-12-26 expiry
• Strike Focus: $460.00
• Entry Range: $33.70
• Target 1: $49.80
• Stop Loss: $23.50
• 1W Move: +1.49%
• 2W Move: +2.15%
• Volume: 1.0× vs prior swing
• Swing Range: $480.08 – $492.30
⚠️ Moderate Risk: Consider reducing position size due to moderate confidence.
🎯 TRADE RECOMMENDATION
Direction: BUY CALLS
Confidence Level: 65% (MEDIUM)
Conviction: Medium
⚠️ KATY–LLM CONFLICT DETECTED
Conflict: Direction
LLM Recommendation: BUY CALLS
Katy AI Chart Prediction: BUY PUTS (-1.40% predicted move)
Katy Confidence: 50%
Proceed with caution — signals do not fully align.
🧠 ANALYSIS SUMMARY
Katy AI Outlook
Predicts STRONG_BULLISH trajectory targeting $520+ within 3 weeks
Driven by earnings momentum + AI leadership catalysts
Technical Analysis
Resistance: $493.50 (today’s high)
Support: $482.87 (VWAP)
Trading near 90% of swing range → potential breakout
Bullish divergence across momentum indicators
No major candlestick reversal patterns detected
Market Context
Overall Market: STRONG BULLISH
SPY: Bullish
QQQ: Bullish
Strong alignment with tech-sector momentum.
News Sentiment
Bullish — MSFT featured in favorable TA articles
Instacart x ChatGPT partnership strengthens MSFT AI dominance
Options Flow
PCR 1.31 → bearish-leaning flow
Heavy volume at $420 puts suggests hedging rather than bearish direction
Low theta decay ideal for swings
Risk Level: MODERATE
Watch for clean breakout above $493.50.
💰 TRADE SETUP
Expiry: 2025-12-26 (18 days)
Recommended Strike: $460.00 (0.881 delta — balanced)
Entry Range: $33.10–$34.30 (use exact real-time bid/ask)
Target 1: $49.80 (+50%)
Target 2: $66.40 (+100%)
Stop Loss: $23.50 (-30%)
Position Size: 3% of portfolio

$MSFT establishing HTF support at 200 day MATagged 200 day MA and bounced. Slight retest already happened. If the daily doesn't form a bear flag then it could easily target the gap at 495.
Options flow supports exactly that with call flow for the next two weeks expirations targeting 495 and 500
Emerging Market vs Developed Market1. Definitions
Developed Markets
Developed markets are countries with high economic maturity, advanced financial systems, strong institutions, and stable political environments. Their characteristics include high GDP per capita, industrial sophistication, deep capital markets, and steady (though slower) economic growth. Examples include USA, UK, Canada, Japan, Germany, France, Australia, and Singapore.
Emerging Markets
Emerging markets are economies transitioning from developing to developed status. They show rapid industrialization, expanding middle-class populations, improving institutions, and increasing integration with global markets. Examples include India, China, Brazil, Indonesia, South Africa, Mexico, Turkey, and Vietnam.
2. Key Characteristics
2.1 Economic Growth
Emerging Markets:
Faster GDP growth, driven by urbanization, industrial expansion, rising consumption, digital adoption, and favorable demographics. Annual growth often ranges from 4–7%.
Developed Markets:
Slower but stable growth, typically 1–3%, due to market maturity, ageing demographics, and saturated industries.
Implication: EMs offer growth potential; DMs offer stability.
2.2 Income Levels and Living Standards
Developed Markets:
High income, advanced infrastructure, strong social welfare systems, high productivity.
Emerging Markets:
Lower but rapidly rising incomes, infrastructure still developing, large segments transitioning to formal economy.
2.3 Financial Markets and Institutions
Developed Markets:
Deep, liquid, and highly regulated financial markets. Stock exchanges (e.g., NYSE, NASDAQ, LSE) exhibit high transparency and strong corporate governance.
Emerging Markets:
Growing markets but with lower liquidity, higher volatility, and varying investor protections. Institutional reforms are ongoing.
2.4 Currency Stability
Developed Markets:
Stable currencies, low inflation, credible central banks.
Emerging Markets:
More prone to currency fluctuations, inflation spikes, and external shocks due to reliance on imported commodities and foreign capital.
2.5 Political and Regulatory Environment
Developed Markets:
Predictable policies, rule of law, strong regulatory systems.
Emerging Markets:
More political uncertainty, policy shifts, regulatory inconsistencies. However, some EMs like India are rapidly improving regulatory transparency.
2.6 Demographics
Emerging Markets:
Young, expanding populations — a positive for long-term consumption and labor supply.
Developed Markets:
Ageing populations — leading to higher healthcare spending, slower consumption growth, and labor shortages.
3. Opportunities in Emerging vs Developed Markets
3.1 Investment Opportunities
Emerging Markets
Higher returns due to rapid growth.
Sectors like technology, fintech, manufacturing, renewable energy, and infrastructure show exceptional potential.
Underpenetrated markets allow companies to grow at scale.
Developed Markets
Stable and predictable returns.
Strong corporate governance and reduced risk of fraud or systemic failures.
Advanced industries like AI, biotechnology, cloud computing, clean tech, and high-end manufacturing.
3.2 Consumer Market Potential
EMs have massive, growing middle classes. Consumption is expected to double in many EMs in the next two decades.
DMs have saturated markets, with growth reliant on innovation rather than new customers.
3.3 Capital Flows
Investors often chase high growth in EM equities, debt, and startups.
DMs attract long-term, stable institutional capital due to reliability of returns.
4. Risks in Emerging vs Developed Markets
4.1 Market Volatility
Higher in EMs, due to currency risks, political events, commodity dependence, and lower liquidity.
DMs show lower volatility thanks to robust financial systems.
4.2 Geopolitical and Policy Risks
EMs often face elections, reforms, or geopolitical pressures that can shift markets abruptly.
DMs are more predictable, although events like Brexit or US political gridlocks still create uncertainty.
4.3 Currency and Inflation Risks
EM currencies can depreciate sharply in global stress periods.
DMs maintain low inflation and strong central bank credibility.
4.4 Structural Challenges
EMs face challenges like corruption, weak judiciary, infrastructure gaps, and bureaucratic hurdles.
DMs deal with challenges like high public debt, low productivity growth, and ageing populations.
5. Comparative Overview
5.1 Growth vs Stability
Emerging markets = growth, opportunity, volatility
Developed markets = stability, safety, lower returns
5.2 Innovation and Technology Adoption
DMs lead in innovation due to research ecosystems.
EMs leapfrog technology — e.g., India’s digital payments boom, China’s e-commerce leadership.
5.3 Trade and Globalization
EMs are increasingly integrated into global supply chains.
DMs dominate global trade policies, IMF, World Bank, and monetary influence (USD, Euro, Yen).
5.4 Corporate Structures
DMs have multinationals with global footprints.
EMs are producing new giants (e.g., Reliance, Tata, Alibaba, BYD, Samsung).
6. Examples
Emerging Markets
India: Fastest-growing major economy, tech innovation, digital transformation.
China: Manufacturing hub, consumption growth.
Brazil: Natural resources, agriculture economy.
Indonesia & Vietnam: Manufacturing and consumption boom.
Developed Markets
USA: World’s largest and most innovative economy.
Japan: High-tech industries, strong institutions.
Germany: Industrial powerhouse.
UK & Canada: Stable financial systems.
7. Which Is Better for Investors?
Emerging Markets Are Ideal If You Want:
High long-term growth potential
Exposure to rising consumption
High-return equity opportunities
Portfolio diversification
Developed Markets Are Ideal If You Want:
Safety and predictability
Lower volatility
Strong governance
Blue-chip stability
Best Strategy:
A balanced portfolio that mixes both — e.g., EM for growth + DM for stability — provides optimal long-term results.
8. Conclusion
Emerging and developed markets represent two ends of the global economic spectrum. Emerging markets offer high growth, rising consumer demand, innovation, and long-term opportunities, but with higher risks and volatility. Developed markets deliver stability, security, and robust institutions, though with slower growth.
Understanding the differences helps investors, businesses, and policymakers choose the right strategies. In today’s interconnected world, both market types are essential components of global economic progress. A combination of the dynamism of emerging markets and the reliability of developed markets provides a balanced and powerful approach to global investment and economic engagement.
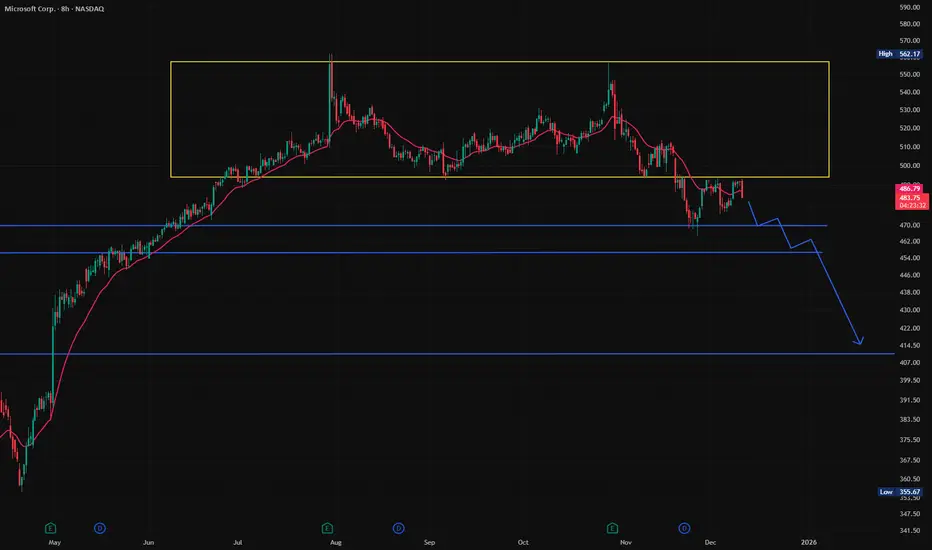
$MSFT Horizontal consolidation If the current context remain, I would see NASDAQ:MSFT doing horizontal consolidation between range $467-$556
MSFT: Next Long Term Buy ZoneMicrosoft has staged a strong rally since the April tariff-related selloff, rebounding significantly but ultimately failing to set a new meaningful high in October. While the company’s earnings have remained relatively strong, it is still a publicly traded stock and therefore susceptible to broader market conditions that could trigger a pullback.
After my analysis on META identified a strong trade/buy zone around $600 and below, I’ve noticed a very similar setup forming on Microsoft, one that could present an excellent buying opportunity if a deeper drop materializes.
From a purely technical standpoint, using volume-based tools, I see several reasons to be prepared for a potentially larger pullback in this stock.
To start, I’ve marked two major zones to outline the volume-price action: the first is the consolidation range before the tariff driven decline, and the second is the volume profile of the subsequent uptrend.
You’ll notice that price broke out of the previous consolidation range without any meaningful retracement back into that fair value zone, essentially melting up. This creates thin structural support that can easily give way if meaningful sell-side pressure emerges.
Secondly, price has failed twice above the Value Area High of the uptrend’s fair value range near $538. These failures resulted in a failed auction that drove price to the opposite end of the range at $472. What concerns me most is the rejection at the Point of Control (the most heavily traded zone), highlighted in blue. Price reacted sharply from that level, forming a resistance zone that has not been reclaimed, an indication of potential weakness.
Third, price is now losing the uptrend anchored VWAP from the previous swing low. In my view, this is a major support level that typically signals trend continuation, where buyers should be stepping in to defend price. That is not occurring. If price breaks below the Value Area Low where the most recent swing low sits I would be concerned about a possible waterfall move that could bring price back into previous support zones.
If such a drop does occur, I will not panic. Instead, I will recognize it as a potential major buying opportunity in a fundamentally strong and profitable company one that could represent nearly a 25% decline from the highs.
Only time will tell..

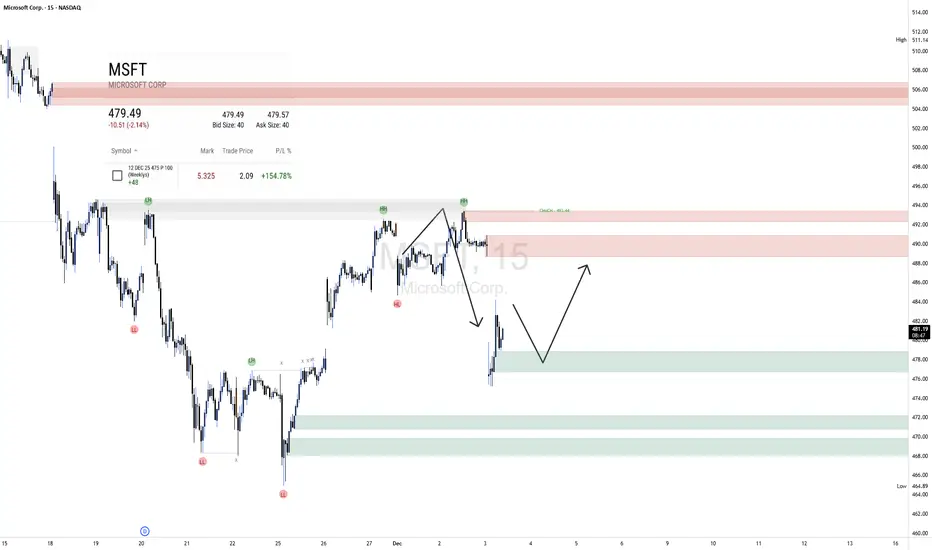
MSFT LongBroader Market Structure
MSFT on the 15-minute chart is in a short-term uptrend following a sequence of higher lows and higher highs from the $464 area. The key structural shift occurred when price printed a CHoCH at $492.44, breaking above the previous swing high and confirming bullish intent. Before that, the market had transitioned from lower lows into a clear higher-low structure, signaling accumulation before expansion. The recent drop from the $492–$494 supply is corrective, not impulsive, which suggests we’re seeing a pullback rather than a reversal unless demand fails.
Supply & Demand Zones
The upper supply around $492–$494 has shown clear weakness for buyers; price rejected immediately with strong momentum and multiple wicks showing absorption and aggressive selling. Higher up, the major supply at $504–$507 remains a strong distribution zone where price previously dropped sharply, indicating institutional control. On the demand side, the closest zone at $478–$475 is fresh and unmitigated; buyers stepped in with strength from that area earlier, producing a decisive rally and ultimately the CHoCH. A deeper demand below $470–$466 is even more important because it initiated the entire trend shift and contains protected lows.
Price Action in the Marked Region
Price is currently declining from supply and pushing toward the green demand region. The move down is controlled rather than impulsive, indicating sell-side momentum is fading as it approaches prior buyer interest. The marked projection makes sense: a dip into $478–$475 would allow liquidity collection before a bounce toward the $488–$492 supply above. If demand holds, expect responsive buying with a clean bullish engulfing candle or long-wick rejection.
Trade Bias, Direction & Invalidation
The bias for now is bullish, looking for a pullback to demand and continuation upward. The expected direction is a retest of $478–$475 followed by a rally toward $488–$492.
A key invalidation level is a clean 15-minute close below $475—if that level breaks, sellers likely target the deeper $470–$466 demand, and the bullish thesis weakens significantly.
Momentum & Candle Behavior
Momentum currently favors sellers in the short term, but the drop is stepping rather than impulsive, suggesting exhaustion into demand. Look for a shift in candle behavior—such as a bullish engulfing bar, absorption wick, or displacement candle—to confirm buyer strength returning.
MSFT PullbackPattern Identified: Bearish Double Top pattern confirmed on Microsoft ( NASDAQ:MSFT ) with neckline break and clear measured move objectives. Neckline Break Triggers Measured Move to Gap Fill.
Key Confluence:
First Top: Initial rejection
Second Top: Failed breakout, lower high
Neckline: Support connecting swing lows between tops
Confirmation: Neckline break & retest completed
Measured Move Calculation:
TP1: Distance from highest top to neckline, projected onto the breakout zone = $430
TP2: Gap fill zone from May 1st, 2025 = $400
SL: Above Neckline at previous confirmation

QS V3 Weekly Call Opportunity – MSFT Bullish TrendMSFT Weekly Signal | 2025-12-05
MSFT Weekly Call Option
Direction: Buy Calls (Long / Bullish)
Strike: $482.50
Entry Price: $5.62 – $5.70
Profit Target 1: $8.90 (≈60% gain)
Profit Target 2: $11.20 (≈100% gain)
Stop Loss: $3.90 (≈30% loss)
Expiry: Dec 12, 2025 (7 days)
Position Size: 2% of portfolio
Confidence: 58%
Rationale: Katy AI predicts upward trajectory to ~$497 by Friday; MACD bullish divergence suggests potential multi-day reversal.
Risk Notes: High – Friday expiration with gamma effects; low VIX may reduce premium capture. Monitor actively.


Quant signals MSFT Weekly PUT: Institutional Bearish MomentumDirection: BUY PUTS (SHORT)
Confidence: 65% (Medium)
Strike: $475.00
Entry Price: $4.10
Target 1: $6.15 (50% gain)
Target 2: $8.20 (100% gain)
Stop Loss: $2.87 (30% loss)
Expiry: 2025-12-05 (2 days)
Position Size: 2% of portfolio
Weekly Momentum: BEARISH (-2.82%)
Options Flow: Bearish (PCR 18.23) – heavy institutional put buying
Technical: Oversold RSI 5.2, session low $475.28, resistance $493.50
News: Microsoft lowers AI software sales quotas – negative catalyst
Risk: Medium – Katy AI conflicts (neutral-to-bullish), high gamma risk
MSFT Weekly PUT Signal #2
Direction: BUY PUTS (SHORT)
Confidence: 65% (Medium)
Strike: $482.50
Entry Price: $3.30
Target 1: $4.95 (50% gain)
Target 2: $6.60 (100% gain)
Stop Loss: $2.31 (30% loss)
Expiry: 2025-12-05 (2 days)
Position Size: 3% of portfolio
Weekly Momentum: NEUTRAL (+0.08%)
Options Flow: Bearish (PCR 14.10) – heavy institutional put buying
Technical: Overbought RSI 85.2, weekly high $493.50, support $475.20
News: Negative AI sales catalyst
Risk: Medium – Katy AI conflicts (bullish prediction), requires active management
$MSFT Bottom $455 oversold $425NASDAQ:MSFT Is a predictable machine $455 is the bottom margin for error could drop $425 in oversold situation.
All their fundamentals align and show the same pattern every time.
typically around this time we should see a dip which finds support at the last wave's highs.
there really isnt more explanation needed for this...
unless... we have a yen carry trade unwind.. that's a different story..

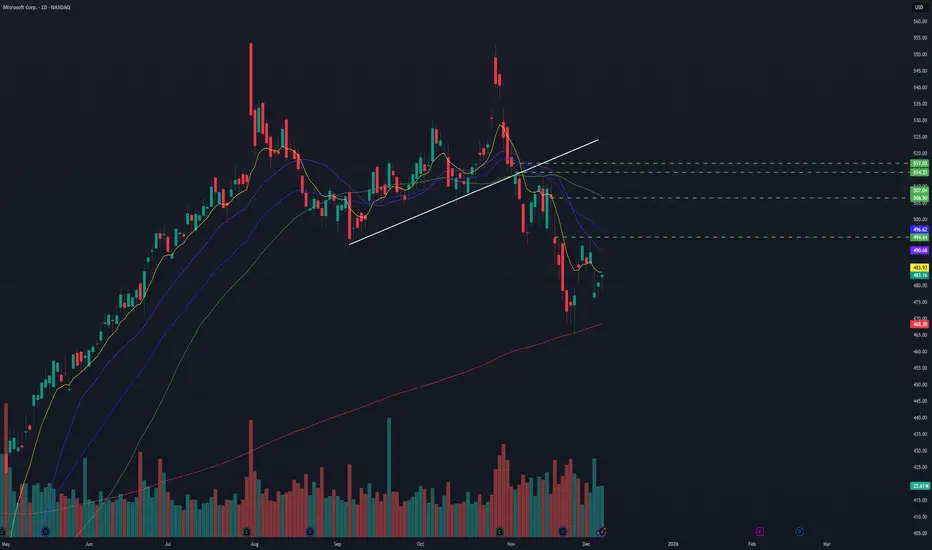
MICROSOFT Hit a WALL. DOUBLE TOPPED and WILL DROPPrice action has confirmed and triggered a double top pattern.
Calling tops in tech is dangerous as we all know.
But as Tech fatigue hits, and selloffs quicken, the risk of a deeper shakeout increases.
Remember US stock market is 230% of GDP.
With increasing Job Losses.

Trading Global Indices: Opportunities, Strategies, and RisksUnderstanding Global Indices
A global index is a benchmark that tracks the performance of a group of stocks representing a specific market. Examples include the S&P 500 in the United States, the FTSE 100 in the United Kingdom, the DAX 40 in Germany, the Nikkei 225 in Japan, and the Nifty 50 in India. There are also broader indices such as the MSCI World Index or MSCI Emerging Markets Index, which capture performance across multiple countries.
These indices are usually weighted by market capitalization, meaning larger companies have a greater impact on index movement. When traders buy or sell an index, they are effectively trading the overall direction of that economy or market rather than betting on the success or failure of a single firm.
Why Traders Choose Global Index Trading
One of the biggest advantages of trading global indices is diversification. Since an index contains many stocks, the risk associated with one company’s poor performance is reduced. This makes indices relatively more stable compared to individual equities, especially during periods of company-specific volatility.
Another major reason is liquidity. Popular indices such as the S&P 500, Dow Jones, Nasdaq, and DAX are among the most liquid instruments in the world. High liquidity ensures tight spreads, efficient price discovery, and smooth execution, which is particularly attractive for intraday traders and institutional participants.
Global indices are also highly responsive to macroeconomic events. Interest rate decisions, inflation data, employment numbers, geopolitical developments, and central bank policies all influence index movement. For traders who enjoy macro-driven strategies, indices offer a direct way to express views on economic growth or slowdown.
Instruments Used to Trade Global Indices
Traders can access global indices through multiple instruments. Index futures are widely used by professional traders and institutions, offering leverage and standardized contracts traded on regulated exchanges. Index options provide strategies for hedging, income generation, and volatility trading.
For retail traders, contracts for difference (CFDs) and exchange-traded funds (ETFs) are common choices. CFDs allow traders to speculate on price movements without owning the underlying asset, while ETFs provide a simpler way to invest in an index through the stock market. Each instrument has its own cost structure, risk profile, and suitability depending on the trader’s objectives.
Key Drivers of Global Index Movements
Global indices are influenced by a combination of economic, political, and psychological factors. Monetary policy is one of the most important drivers. Interest rate hikes or cuts by central banks such as the Federal Reserve, ECB, or RBI directly impact equity valuations and index trends.
Economic data releases like GDP growth, inflation, manufacturing indices, and employment reports often cause sharp short-term moves. Strong data typically supports bullish sentiment, while weak data can trigger sell-offs.
Corporate earnings also play a significant role. Since indices are composed of major companies, quarterly earnings seasons often bring increased volatility. Strong earnings across sectors can lift an index, while widespread disappointments can drag it down.
Geopolitical events, trade policies, wars, sanctions, and global crises can lead to risk-off or risk-on behavior across global indices. In times of uncertainty, capital often flows out of equities into safe-haven assets, putting pressure on indices worldwide.
Trading Strategies for Global Indices
Index trading supports a wide range of strategies. Trend-following is one of the most common approaches, as indices often move in sustained trends driven by economic cycles. Traders use moving averages, trendlines, and momentum indicators to capture these moves.
Range trading is effective during periods of consolidation, when indices move between well-defined support and resistance levels. Breakout strategies are popular around major economic announcements, where indices can move sharply once key levels are breached.
Swing trading focuses on capturing medium-term moves over days or weeks, often based on technical patterns combined with macro themes. Long-term investors, on the other hand, use indices to participate in economic growth over years, benefiting from compounding and reinvested dividends.
Risk Management in Index Trading
Despite their diversification benefits, global indices are not risk-free. Market-wide crashes, such as those seen during financial crises or pandemics, can cause rapid and deep declines. Proper risk management is therefore essential.
Using stop-loss orders, controlling position size, and avoiding excessive leverage are fundamental principles. Traders should also be aware of correlation risk, as global indices often move together during periods of stress, reducing the benefits of diversification across regions.
Understanding trading hours is another key aspect. Different indices are most active during their local market sessions, and volatility can spike when major markets overlap.
Role of Global Indices in a Trading Portfolio
Global indices play a crucial role in portfolio construction. They can be used as core holdings to represent equity exposure, while other instruments such as commodities, bonds, or currencies are added for balance. Active traders use indices to hedge exposure in individual stocks or sectors, especially during uncertain market conditions.
For Indian traders, global indices also provide international exposure beyond domestic markets. Movements in the US or European indices often influence Asian markets, making global index analysis valuable even for local trading decisions.
Conclusion
Trading global indices offers a powerful way to participate in the world’s financial markets with diversification, liquidity, and strong macroeconomic relevance. Whether used for short-term trading, swing strategies, or long-term investment, indices reflect the collective behavior of economies and investors worldwide. Success in global index trading depends on understanding economic drivers, choosing the right instruments, applying disciplined strategies, and managing risk effectively. In an increasingly interconnected world, mastering global index trading is an essential skill for modern market participants.

MSFT out of a falling wedge, consolidating and accumulatingHello.
MSFT catches my attention as it seems out of a falling wedge and entering a consolidation. During this consolidation it may accumulate and i see two possible targets:
Upwards to 512.02
Downwards to 464.46
In this chart short EMA (9) is green and long EMA (200) is red. It seems price is playing around with EMA 200 without being able to go down any further. So price could go down to look for buyers around the EAM 9 and then try to make a double bottom at 464.46. Price also could find sellers right at EMA 200 and go up to the zone where consolidation has its high.
Now, consider there is an sell order block that remains untested and pricing could also go to 552.17 to retest. Do do that probably the price will go down first.
-- In Spanish--
Este es MSFT en dias. De lejos pareciera no tener nada interesante. Pero si empezamos a trazar lineas de tendencia se ve mas interesante.
El precio viene cayendo en un Falling Wedge o Cuña Bajista y ya rompio tendencia. El precio salio y ahora consolida entre los 492.9 y los 474.5. Esta consolidacion es suficiente amplia para scalps diarios pero esto es lo que me parece interesante. Si el precio saliera de esta zona de consolidacion pudiera ir a los 512.02 o a los 464.46.
El precio al parecer juega con la EMA 200 y no ha podido bajar mas. El precio pudiera subir a buscar compradores a la EMA 9 para luego bajar e intentar hacer un doble piso en los 464.46. O el preci pudiera encontrar vendedores ahi en la EMA 200 y llegar hasta el extremo superior de la consolidacion y romper mas hacia arriba.
Vamos a ver que ocurre.

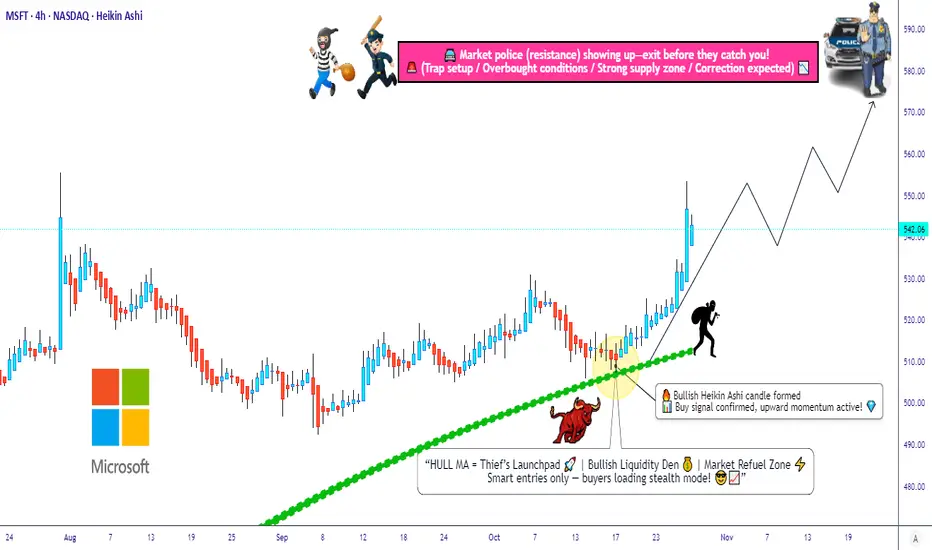
MSFT Market Blueprint: From Pullback to Profit Zone💼 Asset: Microsoft Corporation (MSFT) — NASDAQ
Type: Swing Trade Setup
Bias: Bullish Pullback Play
🔍 Plan Overview
MSFT is showing a clean bullish pullback confirmation with the Hull Moving Average acting as dynamic support. A Heikin Ashi reversal doji candle has appeared — a strong hint that buyers are gaining control again 🟢.
Momentum looks ready to shift back to the upside as the pullback finds its footing. The plan focuses on catching this move with layered entries (a.k.a. “Thief Strategy” style).
⚙️ Entry Plan (Layered “Thief” Style Method)
This approach uses multiple limit orders to build a strong position during pullbacks. You can add or adjust based on your own risk appetite.
📍 Layered Entry Points:
🟩 520.00 — first buy zone (initial position)
🟩 530.00 — second layer (confirmation add-on)
🟩 540.00 — third layer (momentum add)
💡 Tip: You can increase or decrease the number of layers depending on volatility or confidence in trend continuation.
🔒 Stop Loss (SL)
🛑 Thief OG’s SL idea: 510.00
Note: Dear Ladies & Gentlemen (Thief OG’s), I’m not recommending to stick strictly to my SL — trade with your own risk management. Make money and protect it wisely. 💰
🎯 Target Profit (TP)
🎯 Target zone: 580.00
The “Police Force” (strong resistance zone) is waiting up there — where the market could become overbought or trap late buyers. That’s where we take our profit and vanish with gains like pros 😎.
Note: Dear Ladies & Gentlemen (Thief OG’s), again — you can set your own TP. This level is my personal exit zone for safety and profit lock.
🔗 Related Pairs & Market Watchlist
Keep an eye on correlated tech giants and ETFs to confirm momentum:
💻 NASDAQ:AAPL (Apple Inc.) – often leads the NASDAQ tech sentiment.
🌐 NASDAQ:GOOGL (Alphabet Inc.) – confirms sector strength.
📊 NASDAQ:QQQ (NASDAQ 100 ETF) – index pressure or breakout signal for techs.
⚙️ AMEX:XLK (Tech Sector ETF) – broader sector health indicator.
🧠 Correlation Insight:
When Apple ( NASDAQ:AAPL ) or Google ( NASDAQ:GOOGL ) show the same bullish reversal near their moving averages, it reinforces MSFT’s bullish continuation. Strong moves on NASDAQ:QQQ and AMEX:XLK also validate that the entire tech sector is moving in sync.
⚠️ Disclaimer
This is a Thief-style trading strategy, designed for educational and entertainment purposes only — just for fun 🎭.
Trade responsibly and manage your risk accordingly.
✨ “If you find value in my analysis, a 👍 and 🚀 boost is much appreciated — it helps me share more setups with the community!”
#MSFT #SwingTrade #BullishSetup #TechStocks #LayeredEntry #HeikinAshi #HullMA #TradingPlan #StockMarket #ThiefStyle #TradingView #Investing #NASDAQ #PriceAction
$MSFT worth a watchNASDAQ:MSFT volumes at these levels are few few few (fiuuuu)
Fortunately, 50wEMA is doing a good job like support.
But we have to be bullish, right????

MSFT DIC 2025MSFT rejected 554-560 (15.9B sold).
Key SUP 465;
lose -> 450 then 422-395.
Upside reclaim 500 (EPS) ->525.
#MSFT #QQQ #XLK #SPY
