META Platforms — Can Bulls Escape With $800 Loot?📈 META Money Heist: Bullish Thief Swing/Day Trade Plan! 💰🔥
Date: 08 September 2025
Asset: META Platforms, Inc.
Trading Style: Money Heist Plan with Thief Strategy (Swing/Day Trade) 🦹♂️
Plan: Bullish (Pullback in the LSMA Moving Average) – Bulls charging for upside momentum! 🚀
🎯 Entry: Any Price Level – Thief Using Layer Strategy
Deploy multiple limit orders (layering style entries) at $730.00, $740.00, $750.00 (scale up layers based on your preference).
Be a stealthy trader, sniping entries during pullbacks for max profits! 🕵️♂️
🛑 Stop Loss: Thief SL at $710.00
Dear Ladies & Gentlemen (Thief OG's), adjust your SL based on your strategy and risk tolerance. Protect your loot! 🛡️
Please adapt your SL to your own strategy, risk appetite, and style — take profits when it makes sense for you.
🎯 Target: Resistance + Overbought Zone + Trap Ahead
Escape with your stolen profits before the trap! Aim for $800.00 target. 🏃♂️💨
📝 Note: Dear Thief OG's
I’m not dictating your TP – it’s your heist! Take profits at your own risk and make the market your playground. 💸
💡 Why This Plan? Thief Strategy + Market Edge
The Thief Plan is a cunning, layered approach to "steal" profits from market pullbacks, aligning with META’s bullish technicals (near 52-week highs, above 200-day SMA). By stacking limit orders, you capitalize on dips in the LSMA moving average, riding the bulls’ strength with precision. Backed by strong fundamentals, macro trends, and greedy sentiment, this setup is primed for a high-reward heist! 🤑
📊 META Stock Sentiment & Market Outlook (08 Sept 2025)
🔢 Real-Time Data Overview
📈 Day Change: +0.51% (↑ $3.80)
📏 52-Week Range: $479.80 - $796.25
💰 Market Cap: $1.89T 🏆
😊 Investor Sentiment Outlook
Retail & Institutional Mood
🟢 Consensus Sentiment: Bullish (Greed Phase)
Analysts’ Price Target Avg: $822.41 (9.30% upside).
42/47 analysts rate META as "Buy" 🟢.
Institutions love AI-driven ad growth + strong cash flow. 💪
Fear & Greed Index
⚖️ Stock Market Sentiment Score: 53/100 (Neutral to Greed)
Driven by market momentum, options activity, and low volatility.
🔄 Crypto Sentiment: Neutral (53/100).
📉 Fundamental & Macro Score Points
Fundamental Strength ✅
💸 Valuation:
P/E Ratio: 27.32 (below peers’ avg 35.47).
Free Cash Flow: $57.63B (projected to hit $198.64B by 2035).
Profit Margin: 39.99% (industry leader).
🚀 Growth Catalysts:
AI boosting ad engagement.
Reality Labs innovation (long-term bet).
⚠️ Risks:
Regulatory scrutiny (antitrust/data privacy) 🚨.
High reliance on ad revenue (98% of total).
Macroeconomic Factors 🌍
📅 Upcoming Events:
CPI Inflation Report (11 Sept).
Fed Meeting (16-17 Sept) 🏦.
📊 Market Volatility: VIX stable (low fear).
🐂 Overall Market Outlook: BULLISH (LONG)
⏳ Short-Term: ✅
Price near 52-week high + above 200-day SMA.
Target upside: $900+ (Bank of America, DBS Bank).
📅 Long-Term: ✅
AI monetization + metaverse potential.
Undervalued by 29% (DCF model).
🎯 Key Takeaways
😊 Sentiment: Greed-driven optimism (institutional + retail).
💰 Fundamentals: Strong cash flow + EPS growth ($27.54).
🌍 Macro: Monitor CPI/Fed for volatility triggers.
⚠️ Risk: Regulatory risks offset by growth bets.
✅ Verdict: Bullish alignment across sentiment, fundamentals, and technicals.
📡 Related Pairs to Watch (in USD)
NASDAQ:AAPL
NASDAQ:GOOGL
NASDAQ:MSFT
NASDAQ:AMZN
NASDAQ:NVDA
✨ “If you find value in my analysis, a 👍 and 🚀 boost is much appreciated — it helps me share more setups with the community!”
#META #MoneyHeistTrade #BullishSetup #ThiefStrategy #SwingTrading #DayTrading #AIStocks #TechStocks #TradingView #StockMarket #FearAndGreed #BullMarket
MTADB trade ideas

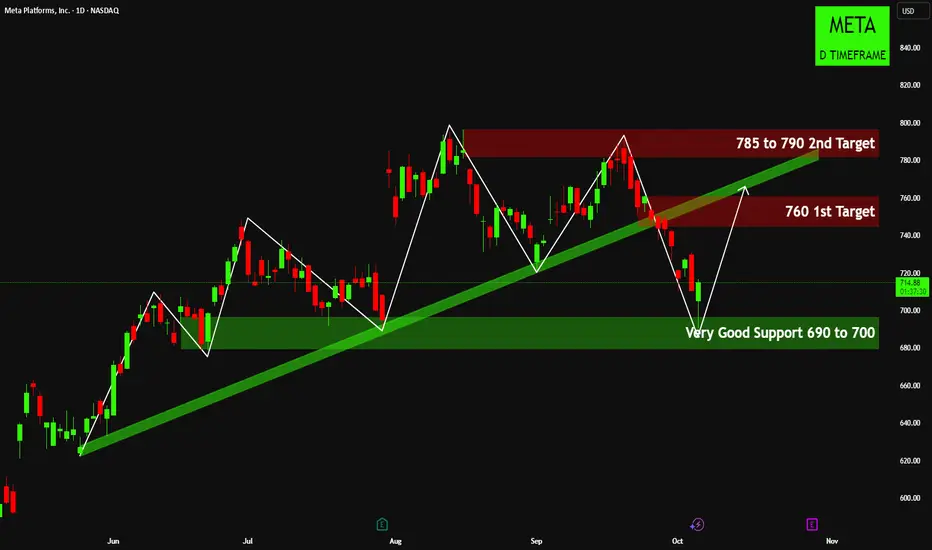
META: Strong Bounce from 690-700 - Is the Reversal to 760 on?META: Strong Bounce from 690-700 - Is the Reversal to 760 on?
After a sustained bearish period since September 19th, Meta Platforms (META) has just printed a strong bullish candle, confirming a robust bounce from the "Very Good Support 690 to 700" zone.
This decisive reaction from key demand suggests a potential reversal, with the "760 1st Target" now in immediate focus for bullish momentum to reclaim previous levels and test the broken trendline.
A successful break and sustained close above the 760 mark would clear the path for the "785 to 790 2nd Target," aiming to challenge prior swing highs and solidify a new upward trend.
Maintaining price action firmly above the 690-700 support is absolutely critical to validate this bullish shift and continue the recovery path.
Disclaimer:
The information provided in this chart is for educational and informational purposes only and should not be considered as investment advice. Trading and investing involve substantial risk and are not suitable for every investor. You should carefully consider your financial situation and consult with a financial advisor before making any investment decisions. The creator of this chart does not guarantee any specific outcome or profit and is not responsible for any losses incurred as a result of using this information. Past performance is not indicative of future results. Use this information at your own risk. This chart has been created for my own improvement in Trading and Investment Analysis. Please do your own analysis before any investments.
META SHORTMeta AI is disgustingly worthless.
Why do we need AI agents in our messages, when it cannot accurately identify the conversations of the day, and it can never summarize things as they go along. Waste of space and function in our messaging services from Meta.
Because of this I was like... I would short Meta because of that, and then looking at the chart we see TONS of BEARISH pressure.
If we close a third red candle, I can see us hitting the RED channels drawn, with a potential to retrace to 200EMA
Suggested plays;
Very short term, weekly PUTS
Mid term, CSP at 200EMA
If we go below BOTTOM RED 4PX CHANNEL LINE- LOAD UP SHARES
IF WE HIT 200EMA, SELL SHORTS AND COVER TO LONG
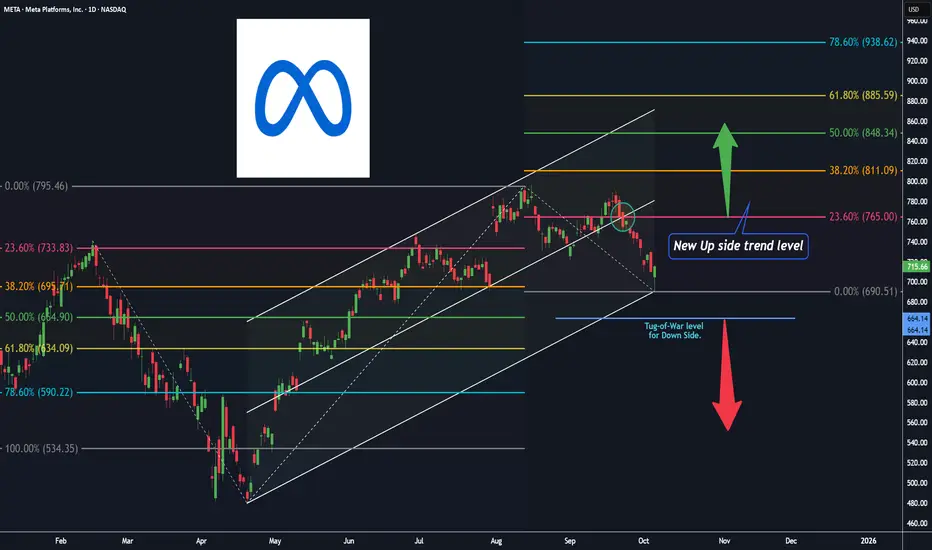
Meta platforms, D ( Channel + 2 Fibonacci Extensions up & down )Hey Traders and Investors, I hope you all are doing well in your life.
market is nature's response and Price is the God .
Let's check the market with the help of natural levels tool : Trend Based Fibonacci Extension in addition with Trend Channel .
After forming almost a ' Head and Shoulders ' pattern on Daily chart, Meta platforms has given a pull-back ( base for Fib-Extension UP level tool on the right side , $690.51 ).
The Pull-back trend expect to continue till the retest level of 23.6% ( $765 ) of Fib-Extension UP level tool on the right side .
The most near level for the re-test is the 50% level ( $664.14 ) of Fib-Extension Down level tool on the left side , for a new UP trend Entry ( investors ).
Note: The marked Circle ⭕ enclosed candle is the important level candle, Up Trend channel's 50% trend line is intersecting with 23.6% of Fib-Extension UP level tool on the right side .
Keep on checking this Level for your future trading decisions.
" Buy 🟢 "above $731 with the stop loss🔻of $690 for the
🎯 Target 1: $765
🎯 Target 2: $811
🎯 Target 3: open.
" Sell 🔴 " below $664 with the stop loss🔺of $690 for the
🎯 Target 1: $634
🎯 Target 2: $590
🎯 Target 3: open.
Smart Levels is Smart Trading 👨🎓
⚠ RISK DISCLAIMER :
All content provided by "TradeWithKeshhav" is for information & educational purposes only.
It does not constitute any financial advice or a solicitation to buy or sell any securities of any type. All investments / trading involve risks. Past performance does not guarantee future results / returns.
Always do your own analysis before taking any trade.
Regards :
Team @TradeWithKeshhav
Happy Trading and Investing!
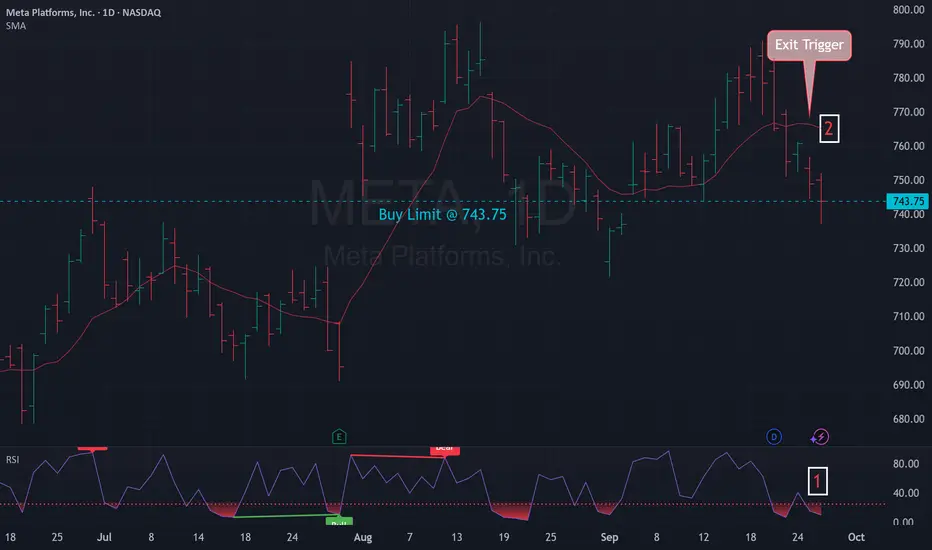
Mean Reversion Setup: META1. RSI in oversold region
2. Price likely to rebound back the the mean
Trade Rules:
Entry Trigger - RSI has cross below oversold region, enter limit buy at close price
Exit Trigger - Close at market when close price cross above exit trigger (Red Line)
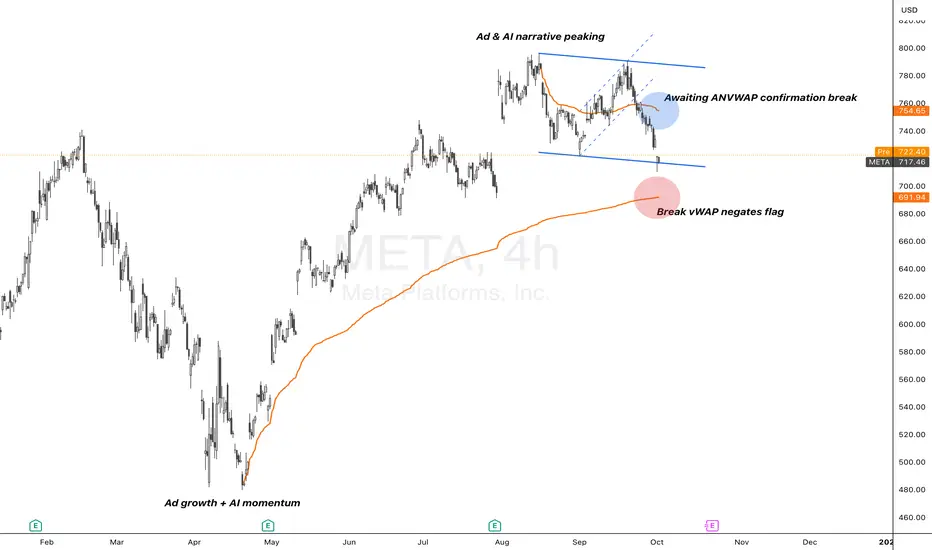
META | AI Capex Drive vs $754 Decision PointMeta’s recent earnings reinforced the AI and ad monetisation story, with revenue growth, margin expansion, and aggressive capex guidance ($64–72B). Deals like the $14B CoreWeave cloud agreement and plans to personalize ads via AI chats keep the structural AI narrative alive. These catalysts provide fuel for investors to stay engaged with the stock despite higher spend.
On the 4H chart, META’s bullish flag structure has retraced toward anchored VWAP support. The $754 anchored VWAP is the key decision point:
If price reclaims and holds above → structure remains constructive with scope for continuation.
If price stays capped below → flag negation risks deeper correction into VWAP trendline support.
Takeaway: $754 anchored VWAP is the line that separates continuation from correction.
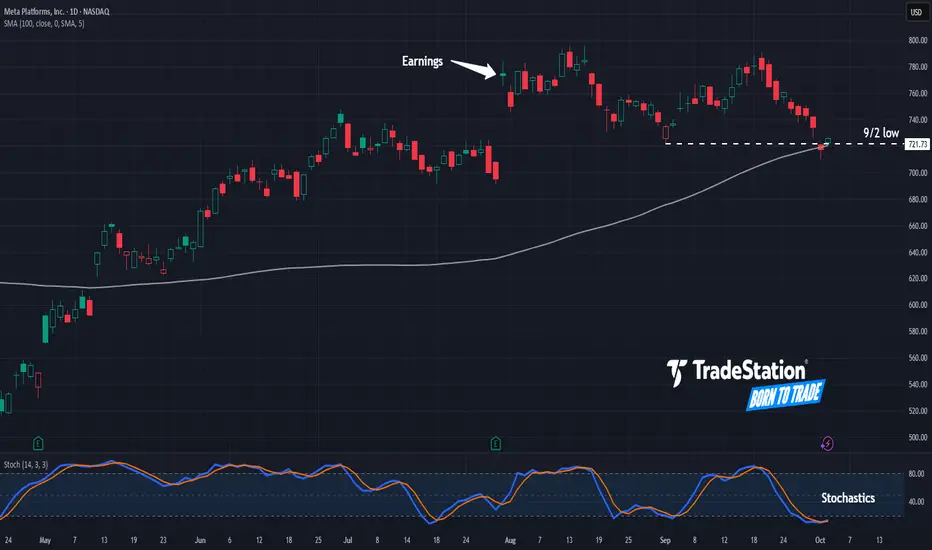
Meta May Be OversoldMeta Platforms has been sliding, and some traders may think the social-media giant is oversold.
The first pattern on today’s chart is the September 2 low of $721.73. META fell below that level yesterday but is now trying to recover. Traders may look for support at such an intermediate-term level.
Second, prices tested the 100-day simple moving average for the first time since early May. Is a longer-term uptrend in place?
Third, stochastics have dipped to an oversold condition.
Next, earnings are expected near the end of this month. Notice how prices jumped following the last report.
Finally, META is an active underlier in the options market. (Its 320,000 average contracts per session ranks 11th in the S&P 500, according to TradeStation data.) That could help traders take positions with calls and puts.
TradeStation has, for decades, advanced the trading industry, providing access to stocks, options and futures. If you're born to trade, we could be for you. See our Overview for more.
Past performance, whether actual or indicated by historical tests of strategies, is no guarantee of future performance or success. There is a possibility that you may sustain a loss equal to or greater than your entire investment regardless of which asset class you trade (equities, options or futures); therefore, you should not invest or risk money that you cannot afford to lose. Online trading is not suitable for all investors. View the document titled Characteristics and Risks of Standardized Options at www.TradeStation.com . Before trading any asset class, customers must read the relevant risk disclosure statements on www.TradeStation.com . System access and trade placement and execution may be delayed or fail due to market volatility and volume, quote delays, system and software errors, Internet traffic, outages and other factors.
Securities and futures trading is offered to self-directed customers by TradeStation Securities, Inc., a broker-dealer registered with the Securities and Exchange Commission and a futures commission merchant licensed with the Commodity Futures Trading Commission). TradeStation Securities is a member of the Financial Industry Regulatory Authority, the National Futures Association, and a number of exchanges.
Options trading is not suitable for all investors. Your TradeStation Securities’ account application to trade options will be considered and approved or disapproved based on all relevant factors, including your trading experience. See www.TradeStation.com . Visit www.TradeStation.com for full details on the costs and fees associated with options.
Margin trading involves risks, and it is important that you fully understand those risks before trading on margin. The Margin Disclosure Statement outlines many of those risks, including that you can lose more funds than you deposit in your margin account; your brokerage firm can force the sale of securities in your account; your brokerage firm can sell your securities without contacting you; and you are not entitled to an extension of time on a margin call. Review the Margin Disclosure Statement at www.TradeStation.com .
TradeStation Securities, Inc. and TradeStation Technologies, Inc. are each wholly owned subsidiaries of TradeStation Group, Inc., both operating, and providing products and services, under the TradeStation brand and trademark. When applying for, or purchasing, accounts, subscriptions, products and services, it is important that you know which company you will be dealing with. Visit www.TradeStation.com for further important information explaining what this means.
Meta Looking BullishA head and shoulders pattern seems to be forming. The head appears to have just completed, and only the right shoulder is missing before potentially reaching new all-time highs. It’s something to keep an eye on, as the setup looks bullish.

META watch $701-711: Key Support Zone to hold the High GroundMETA retracing from our Double Golden zone (see below)
It has fallen hard into key support zone at $701.51-711.04
Bulls need to hold this for at least a while or it will get ugly.
.
Previous post warning of the Double Golden zone:
Hit BOOST and FOLLOW for more such PRECISE and TIMELY charts.
=========================================================
.

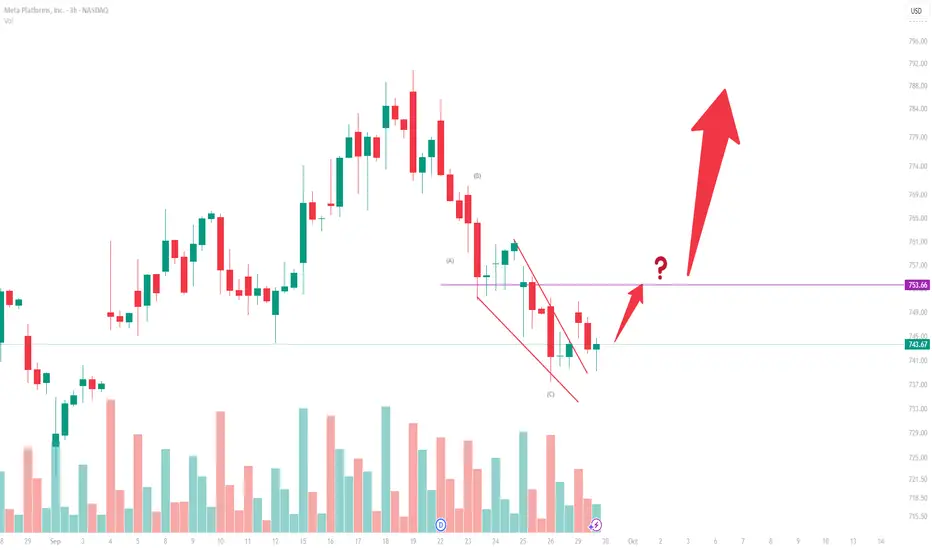
META (3H) — Elliott Wave AnalysisStructure
The chart displays a zigzag corrective pattern labeled (A) → (B) → (C).
Wave (C) unfolds inside a falling wedge (ending diagonal), a common terminal structure at the end of corrections.
The breakout attempt from this wedge suggests that Wave (C) may be complete.
Wave (A)
A sharp, impulsive decline in five subwaves.
Defines the start of the correction.
Wave (B)
A three-wave upward retracement.
Retraces roughly 0.38–0.50 of Wave (A), consistent with zigzag proportions.
Wave (C)
A five-wave structure contained within a converging wedge.
Subwave (v) shows diminishing momentum, typical of an ending diagonal.
The upward break through the wedge top signals the potential termination of Wave (C).
Key Level
753.66 is the critical resistance.
A confirmed move above 753.66 validates that the (A)–(B)–(C) correction has ended and a new impulsive sequence may be starting.
Failure to reclaim 753.66 leaves the risk that the bounce is only a temporary rally within a larger correction.
Alternate Scenario
A new low beneath the Wave (C) termination point would invalidate the completion view, implying the correction is extending.
Forex Market AnalysisIntroduction
The foreign exchange (Forex) market is the largest and most liquid financial market globally, with an average daily turnover exceeding $8 trillion. Unlike stock markets, which are centralized, the Forex market is decentralized, operating 24 hours a day across global financial hubs, including London, New York, Tokyo, and Sydney. Forex trading involves the exchange of one currency for another, usually quoted in currency pairs such as EUR/USD, GBP/JPY, or USD/INR. The objective of Forex analysis is to understand market behavior, predict future price movements, and develop strategies for profitable trading.
Forex market analysis is broadly categorized into fundamental analysis, technical analysis, and sentiment analysis, each playing a critical role in decision-making. Understanding these approaches, combined with risk management, helps traders navigate the complexities of global currency markets.
1. Structure of the Forex Market
The Forex market consists of several participants:
Commercial Banks – The largest players, providing liquidity to the market and facilitating currency transactions for clients.
Central Banks – Influence currency values through monetary policy, interest rate decisions, and interventions.
Hedge Funds and Investment Firms – Engage in speculative trading and arbitrage opportunities.
Corporations – Manage currency risk due to international trade and investments.
Retail Traders – Individual traders accessing the market via brokers and trading platforms.
The market operates in three major sessions:
Asian Session (Tokyo, Hong Kong, Singapore) – Characterized by low volatility, often setting the initial trend for the day.
European Session (London, Frankfurt) – High liquidity and volatility, major economic data releases happen here.
North American Session (New York) – High volatility overlaps with London session, critical for trend continuation or reversal.
2. Key Drivers of Forex Market Movements
Forex prices fluctuate due to multiple factors:
2.1 Macroeconomic Indicators
Economic data from countries heavily influence currency valuation:
Gross Domestic Product (GDP) – A strong GDP indicates economic growth, increasing currency demand.
Inflation Rate – High inflation can devalue a currency unless matched by interest rate hikes.
Unemployment Rate – Lower unemployment signals economic strength, supporting currency appreciation.
Trade Balance – A trade surplus strengthens a currency, while a deficit can weaken it.
2.2 Central Bank Policies
Central banks control money supply, influencing currency strength:
Interest Rates – Higher rates attract foreign capital, boosting currency value.
Quantitative Easing (QE) – Increases money supply, often weakening the currency.
Interventions – Direct buying or selling of currencies to stabilize markets.
2.3 Geopolitical Events
Political stability and global events create volatility:
Elections, trade wars, sanctions, or conflicts can cause sharp currency swings.
Brexit in 2016 caused significant GBP volatility due to uncertainty.
2.4 Market Sentiment
Market psychology affects short-term price action:
Traders’ perception of risk vs. safety drives flows into risk-on or risk-off currencies.
Safe-haven currencies like USD, JPY, and CHF rise during global uncertainty.
3. Types of Forex Market Analysis
3.1 Fundamental Analysis
Fundamental analysis evaluates a currency’s intrinsic value by studying economic indicators, political stability, and monetary policies.
Example: If the US Federal Reserve signals a rate hike while the European Central Bank maintains low rates, the USD may strengthen against the EUR.
Long-term trends are usually driven by fundamentals.
Traders rely on economic calendars to track critical releases like NFP (Non-Farm Payrolls), CPI (Consumer Price Index), and interest rate decisions.
Advantages:
Predicts long-term trends.
Useful for carry trades (earning interest rate differentials).
Limitations:
Short-term volatility can override fundamentals.
Requires continuous monitoring of global developments.
3.2 Technical Analysis
Technical analysis studies past price movements to forecast future trends using charts and indicators.
Chart Patterns: Head and shoulders, double tops/bottoms, triangles, flags.
Trend Analysis: Identifying upward, downward, or sideways trends.
Indicators: Moving Averages, RSI (Relative Strength Index), MACD, Bollinger Bands.
Support & Resistance Levels: Key zones where prices often reverse.
Advantages:
Works for short-term and intraday trading.
Provides entry, exit, and stop-loss levels.
Limitations:
Can be misleading during extreme news events.
Requires discipline and risk management to avoid overtrading.
3.3 Sentiment Analysis
Sentiment analysis gauges trader behavior and market positioning:
Commitment of Traders (COT) Reports: Show positions of commercial and speculative traders.
Retail Sentiment: Broker platforms provide data on long vs. short positions.
Market sentiment can create contrarian trading opportunities when the majority is overly bullish or bearish.
4. Popular Forex Trading Strategies
4.1 Trend Following
Trades with the market trend (uptrend or downtrend).
Tools: Moving averages, trendlines, MACD.
Best for markets with strong directional movement.
4.2 Range Trading
Buying near support and selling near resistance in sideways markets.
Tools: RSI, Bollinger Bands, support/resistance zones.
Suitable for low volatility periods.
4.3 Breakout Trading
Trading when price breaks key support/resistance levels.
Tools: Volume indicators, volatility measures.
Can capture strong momentum but carries higher risk of false breakouts.
4.4 Carry Trade
Borrowing in low-interest currency and investing in high-interest currency.
Profitable when interest rate differentials are stable.
Sensitive to sudden volatility and geopolitical risks.
4.5 Scalping
Short-term trading aiming for small profits per trade.
Requires high liquidity, tight spreads, and fast execution.
5. Risk Management in Forex
Risk management is crucial due to high leverage (up to 1:500 in some brokers):
Position Sizing: Avoid risking more than 1–2% of capital per trade.
Stop-Loss Orders: Limit losses on adverse moves.
Take-Profit Orders: Secure gains when price reaches target.
Diversification: Avoid concentrating on a single currency pair.
Leverage Control: Use leverage responsibly to prevent margin calls.
Emotional discipline is also vital. Overtrading and revenge trading often result from poor risk management.
6. Market Trends and Recent Developments
The Forex market is influenced by evolving global conditions:
US Dollar Dominance: USD remains the reserve currency, heavily influencing global liquidity.
Emerging Market Currencies: Currencies like INR, BRL, and TRY are more volatile but offer higher returns.
Cryptocurrency Influence: Bitcoin and stablecoins are increasingly part of global liquidity dynamics.
Geopolitical Risks: Trade wars, sanctions, and conflicts continue to impact currency correlations.
Example: In 2025, tightening US monetary policy and European energy crises caused significant EUR/USD volatility. Similarly, USD/INR movements have been sensitive to RBI policy and global oil prices.
7. Tools and Resources for Forex Analysis
Traders rely on both platforms and data for analysis:
Trading Platforms: MetaTrader 4/5, cTrader, NinjaTrader for charting and execution.
Economic Calendars: Forex Factory, Investing.com, DailyFX.
News Sources: Bloomberg, Reuters, Financial Times.
Analytical Tools: Autochartist, TradingView, and AI-powered signals.
Combining tools ensures informed decision-making, blending both technical and fundamental perspectives.
8. Psychological Aspects of Forex Trading
Trading success is not only analytical but psychological:
Discipline: Stick to a trading plan without impulsive decisions.
Patience: Wait for high-probability setups.
Emotional Control: Fear and greed can cloud judgment.
Consistency: Focus on long-term profitability rather than short-term gains.
Experienced traders often maintain journals, track performance metrics, and review mistakes for continuous improvement.
9. Conclusion
Forex market analysis is a multidimensional process involving economic, technical, and psychological factors. Successful trading requires:
Understanding global macroeconomic conditions and central bank policies.
Applying technical tools to identify trends, support/resistance, and price patterns.
Analyzing market sentiment to gauge trader behavior.
Implementing disciplined risk management and emotional control.
The Forex market’s 24-hour nature, high liquidity, and global integration present both immense opportunities and risks. By combining analytical rigor with strategic discipline, traders can navigate this dynamic market and enhance profitability.
In essence, Forex analysis is an ongoing learning journey. Traders who consistently integrate market data, adopt structured strategies, and maintain disciplined risk management can achieve sustainable success in the ever-evolving foreign exchange landscape.
META Slips Toward $710 – Bearish Gamma Pressures Build (Oct 2)Intraday (15-Min Chart)
Meta faced heavy selling pressure, sliding into the $718–$719 area after failing to hold higher levels. On the 15-min chart, the stock is caught in a descending wedge, attempting to stabilize but with momentum still fragile. MACD remains in negative territory, while Stoch RSI is curling back up from oversold, hinting at a short-term relief bounce.
* Resistance zones: $721.8 and $734.3 overhead.
* Support levels: $716.3 first, then $710.2 as the key near-term floor.
* Upside trigger: A breakout above $722 could spark a recovery push toward 730–735.
* Downside risk: Loss of $710 exposes deeper downside toward 705–700.
Bias intraday: still heavy; META must reclaim above 722 to avoid continued selling.
Options / GEX (1-Hour Chart)
Gamma positioning reinforces the bearish tone.
* Negative GEX concentration: $715 is highlighted as the highest negative gamma zone, acting as a magnet for dealers to keep pressure lower.
* Put walls: Stacked at $725, $720, and deeper at $705, confirming downside support zones.
* Call walls: Light resistance sits higher at $750 and $755, but flow is weak.
* Sentiment: Call positioning is only ~30%, showing options traders are skewed bearish.
This structure suggests META remains under gamma drag — unless price can reclaim 730+, downside remains favored with $710 as a battleground.
My Thoughts
For Oct 2, META is in a vulnerable spot. Intraday scalps lean bearish under $722, with downside targets at $716 and $710. For options traders, the setup favors put spreads targeting 710–705, while aggressive longs would need a breakout above 730 to regain control.
Bias: META remains weak; $710 is the critical pivot. Break it, and bears push harder. Hold it, and a relief rally may form.
Disclaimer: This analysis is for educational purposes only and does not constitute financial advice. Always do your own research and manage risk before trading.

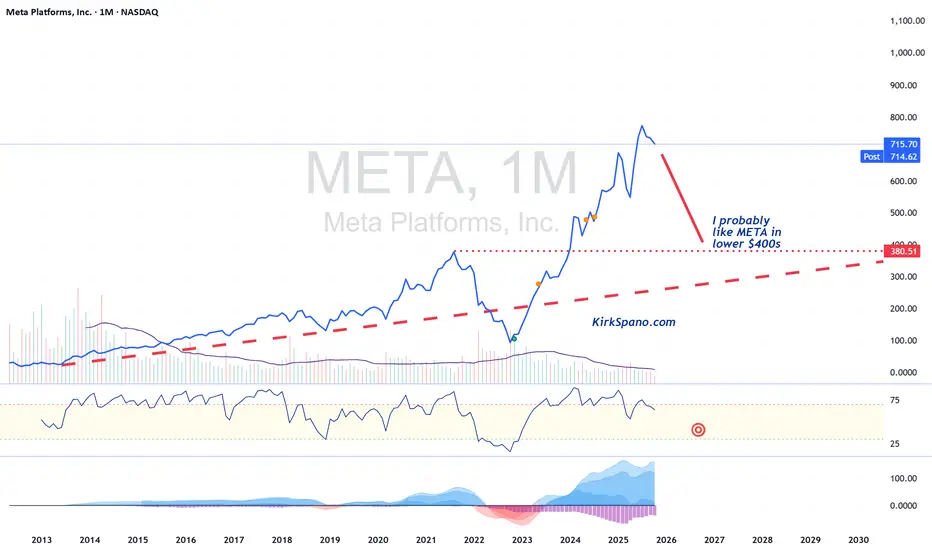
META Correction in 2026 I bought Facebook after their busted IPO and made about 5x and 10x on parts of my money. I should have held so I could have bought half of Wisconsin. My bad.
I don't love Zuck, but the public can't quit Facebook, or Instagram, or Messenger, or Whatsapp... and I think META is in the oligopoly of AI, VR & AR that is developing.
Mega caps are stretched and financing issues for AI will cause a hiccup at some point. I think 2026, year 2 of the Presidential cycle, is the year of hiccups.
I would buy META in the $400s - lower if there's a wider global credit crisis.
The Dynamics of the Global Metals MarketIntroduction
The metals market plays a fundamental role in the global economy, serving as the backbone of industrial production, infrastructure development, technological innovation, and trade. From construction and automotive manufacturing to electronics and renewable energy systems, metals such as iron, copper, aluminum, nickel, and precious metals like gold and silver are indispensable. The metals market operates through a complex network of producers, traders, investors, and consumers, driven by global supply-demand dynamics, price fluctuations, and geopolitical influences.
Understanding how the metals market works requires examining the intricate mechanisms that govern mining, refining, pricing, trading, and consumption. This essay explores the structure, participants, and economic functions of the global metals market, with special emphasis on commodity exchanges, price formation, market trends, investment dynamics, and the influence of global factors such as industrialization, technological change, and sustainability transitions.
1. Structure of the Global Metals Market
1.1 Primary and Secondary Metals Markets
The metals market can be broadly categorized into two segments — the primary market, which deals with newly mined and refined metals, and the secondary market, which focuses on recycled or scrap metals.
Primary Metals Market:
The primary market begins with mining operations where raw ores are extracted from the earth. These ores undergo processing and refining to produce pure metals or alloys. The primary market includes large-scale mining corporations such as BHP, Rio Tinto, and Vale, which dominate global production of metals like iron ore, copper, and aluminum.
Secondary Metals Market:
The secondary market handles recycling and reprocessing of scrap metals. It plays a critical role in promoting sustainability and reducing the carbon footprint of the metals industry. For example, recycled aluminum requires only about 5% of the energy needed to produce new aluminum from bauxite ore.
1.2 Classification by Metal Type
Metals are also classified into three categories based on their properties and uses:
Base Metals: Common metals such as copper, aluminum, zinc, lead, and nickel. These are widely used in construction, manufacturing, and energy.
Precious Metals: Metals like gold, silver, platinum, and palladium, valued for rarity, aesthetic appeal, and use as a store of value.
Ferrous and Non-Ferrous Metals: Ferrous metals contain iron (e.g., steel, cast iron), while non-ferrous metals do not (e.g., copper, aluminum, tin). Ferrous metals dominate in heavy industries, while non-ferrous metals are vital in electrical and transportation sectors.
2. Key Participants in the Metals Market
The metals market involves diverse participants with different roles, motivations, and time horizons. These include:
2.1 Producers
Producers are mining and refining companies responsible for the extraction and processing of metal ores. They include global giants like Glencore, Rio Tinto, BHP, and Norilsk Nickel. Producers influence market supply levels, production costs, and long-term investment trends.
2.2 Consumers
Consumers of metals include manufacturing industries such as:
Construction (steel, aluminum)
Automotive (steel, nickel, aluminum)
Electronics (copper, gold, silver)
Energy (copper, nickel, lithium for batteries)
China is the world’s largest consumer of metals, accounting for over 50% of global demand for key industrial metals due to its rapid industrialization and urbanization.
2.3 Traders and Intermediaries
Traders facilitate the buying and selling of metals on global commodity exchanges. They include physical traders (handling actual shipments) and financial traders (speculating through derivatives such as futures and options). Major trading hubs include London, New York, Shanghai, and Singapore.
2.4 Investors and Speculators
Investment funds, hedge funds, and retail investors participate in metals markets for diversification or speculative purposes. They use financial instruments such as exchange-traded funds (ETFs), futures contracts, and options to gain exposure to metal prices.
2.5 Governments and Regulators
Governments play a key role through regulation, taxation, export controls, and strategic reserves. For example, China’s control over rare earth metals impacts global supply chains, while the U.S. maintains a strategic stockpile of critical minerals for defense and technology.
3. Mechanisms of Metal Trading
3.1 Physical Market vs. Paper Market
The metals market operates through two interconnected segments:
Physical Market: Involves the actual buying, selling, and shipment of metals in various forms — ingots, sheets, rods, or concentrates. Pricing is based on spot market rates.
Paper Market: Involves financial contracts such as futures, forwards, and options that represent a promise to deliver or receive a metal at a future date. These are traded on exchanges like the London Metal Exchange (LME), Chicago Mercantile Exchange (CME), and Shanghai Futures Exchange (SHFE).
3.2 Commodity Exchanges
The London Metal Exchange (LME) is the world’s largest market for base metals trading. It sets global benchmark prices for metals such as copper, aluminum, and zinc. Trading occurs through:
Ring trading (open outcry),
Electronic trading, and
Over-the-counter (OTC) contracts.
Each exchange provides transparency, liquidity, and standardized contracts that enable producers, consumers, and investors to hedge against price risks.
3.3 Price Discovery and Benchmarking
Metal prices are determined by global supply and demand but are standardized through benchmark pricing. LME prices often serve as global benchmarks. Prices are influenced by:
Mining output
Industrial demand
Energy costs
Inventory levels
Geopolitical events
Currency fluctuations (especially the U.S. dollar)
4. Price Formation and Market Influences
4.1 Supply-Side Factors
Mining Output and Reserves: Mining disruptions due to strikes, natural disasters, or regulatory issues can reduce supply.
Energy Costs: Metal production is energy-intensive; fluctuations in oil and electricity prices directly affect costs.
Technological Advancements: Innovations in mining and recycling improve efficiency and lower production costs.
4.2 Demand-Side Factors
Industrialization and Infrastructure: Economic growth in developing countries increases demand for steel, copper, and aluminum.
Technology and Electrification: The rise of electric vehicles (EVs) and renewable energy systems has boosted demand for copper, nickel, and lithium.
Consumer Preferences: Shifts toward sustainable and green technologies influence metal consumption patterns.
4.3 Macroeconomic and Financial Factors
Interest Rates and Inflation: Metals often serve as inflation hedges; high inflation or low interest rates drive investment demand.
Currency Movements: Metals are priced in U.S. dollars, so a weaker dollar generally boosts metal prices.
Global Trade Policies: Tariffs, export bans, and sanctions can distort trade flows and pricing.
4.4 Geopolitical and Environmental Influences
Geopolitical Tensions: Conflicts or trade wars can disrupt supply chains. For example, sanctions on Russian nickel and aluminum affected global markets.
Environmental Regulations: Stricter emissions standards and sustainability targets affect mining operations and recycling initiatives.
5. Metals as Investment Assets
5.1 Precious Metals as Safe Havens
Gold and silver are traditional safe-haven assets. During economic uncertainty or financial crises, investors turn to these metals to preserve value. Central banks also hold gold reserves as part of their monetary policy tools.
5.2 Industrial Metals and Economic Growth
Industrial metals such as copper, aluminum, and nickel are considered barometers of global economic health. Rising prices often signal industrial expansion, while declining prices indicate economic slowdown.
5.3 Investment Instruments
Investors can gain exposure to metals through:
Physical bullion and coins
Exchange-Traded Funds (ETFs)
Mining company stocks
Futures and options
Commodity index funds
5.4 Hedging and Risk Management
Manufacturers and producers use metal derivatives to hedge against price fluctuations. For example, an airline company may hedge aluminum prices to stabilize aircraft production costs.
6. Sustainability and the Future of Metals
6.1 Green Transition and Critical Minerals
The global shift toward renewable energy and electric vehicles has created unprecedented demand for critical minerals such as lithium, cobalt, nickel, and rare earth elements. These metals are vital for batteries, solar panels, and wind turbines.
6.2 Circular Economy and Recycling
Recycling metals reduces environmental impact, lowers production costs, and supports the circular economy. Technological advances in metal recovery are making recycling increasingly efficient and profitable.
6.3 ESG and Responsible Mining
Environmental, Social, and Governance (ESG) principles are reshaping the metals industry. Investors now demand transparency on carbon emissions, labor practices, and biodiversity impacts. Companies failing to meet ESG standards face reputational and financial risks.
6.4 Technological Innovations
Automation and AI in mining enhance safety and efficiency.
Blockchain technology is improving supply chain traceability.
Hydrogen-based steel production promises low-carbon alternatives to traditional blast furnaces.
7. Case Studies in the Metals Market
7.1 Copper Market Dynamics
Copper is known as “Dr. Copper” because its price movements reflect global economic health. The rise of electric vehicles and renewable infrastructure has significantly increased copper demand. Supply bottlenecks in Chile and Peru, which together account for nearly 40% of world production, often create price volatility.
7.2 Aluminum and Energy Dependence
Aluminum smelting is highly energy-intensive, making it sensitive to electricity prices. Energy crises, such as the one in Europe in 2022, led to major production cuts and higher aluminum prices worldwide.
7.3 Gold and Monetary Policy
Gold prices are heavily influenced by monetary policy, particularly interest rate decisions by the U.S. Federal Reserve. During periods of economic uncertainty, investors move from equities to gold, driving up demand.
7.4 Rare Earth Metals and Geopolitics
China’s dominance in rare earth metal production (over 80% of global supply) gives it strategic leverage in global technology and defense industries. The U.S. and EU have since accelerated efforts to diversify supply sources.
8. Challenges and Risks in the Metals Market
8.1 Price Volatility
The metals market is inherently volatile due to its sensitivity to macroeconomic and geopolitical developments. Sudden price swings can affect profitability for producers and manufacturers.
8.2 Environmental Concerns
Mining and metal processing contribute to deforestation, water pollution, and greenhouse gas emissions. Transitioning to sustainable mining practices is both a challenge and necessity.
8.3 Resource Nationalism
Countries rich in mineral resources often impose export restrictions or higher taxes to retain more value domestically. This can disrupt global supply chains.
8.4 Technological Disruption
Advances in materials science, such as graphene or alternative composites, may reduce reliance on certain metals, altering long-term demand patterns.
9. The Future Outlook of Metals Markets
The coming decades are expected to bring profound shifts in the metals industry:
Electrification and Energy Transition: Demand for copper, lithium, nickel, and cobalt will continue to soar as the world moves toward clean energy systems.
Digitalization: AI, IoT, and blockchain will enhance transparency and efficiency in metal trading and logistics.
Supply Chain Diversification: Countries will seek to reduce dependence on single suppliers, leading to new mining projects in Africa, South America, and Southeast Asia.
Recycling Revolution: Technological innovation in recycling will make secondary metal markets increasingly competitive.
Carbon Neutrality Goals: The push toward net-zero emissions will reshape production methods and pricing structures across the industry.
Conclusion
The metals market is a dynamic and essential component of the global economy. It integrates the forces of production, consumption, finance, and geopolitics into a vast network that underpins industrial and technological progress. Understanding how the metals market works requires a comprehensive view of its structure, participants, pricing mechanisms, and global interdependencies.
As the world transitions toward a sustainable and digital future, the metals market faces both immense challenges and opportunities. The rise of renewable energy, electric mobility, and green technologies will redefine demand for critical minerals. Meanwhile, innovations in recycling, ESG governance, and digital trading platforms promise to make the industry more efficient and transparent.
Ultimately, the metals market is not merely a trading arena but a mirror of human progress — reflecting the evolution of civilization, the rhythm of industrial growth, and the aspirations of a planet striving toward sustainability and prosperity.
META| 720 Breakout Setup- Gamma MORE!Price Consolidating just below 719-720- a key volume shelf and gamma pivot. A clean breakout with volume could trigger a dealer hedge-driven squeeze into 740-750 as gamma flips positive in the coming days or weeks.
74% bullish call flow today hints at an early momentum shift- watching the EMA cloud to flatten for added confluence.

META: Bullish short termTrade Idea for bullish META play:
Meta tagged 3rd quadrant of daily wick and spiked up, targeting quadrants of daily suspension block above

META - Forming bearish head and shouldersAbout 3 months back NASDAQ:META formed a double top .
In the first try, it broke through the double top resistance, but the price couldn’t quite escape the broken level .
Then, it came back and tested below the broken line .
It broke it again and formed a second double top !
Now, the price is under the first double top , which shows pretty weak price actions.
And it’s also starting to form a bearish head and shoulders formation.
So, here are my potential price targets for the next 9 months:
681 , 623 , and 584 .

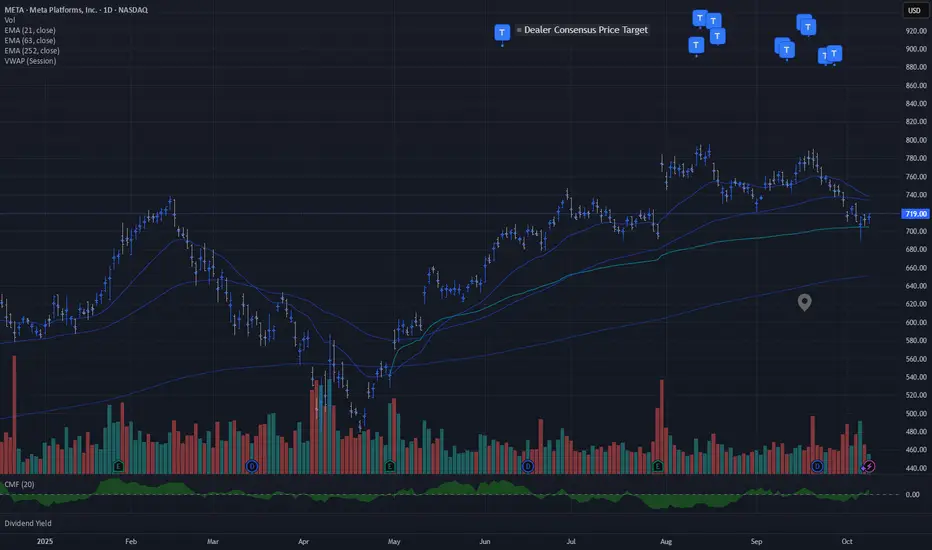
META | Constructive VWAP Support + Dealer Consensus PullWatch for follow through from Anchored VWAP Support while positive dealer pricing pressure remains intact.
Meta — Back to the FutureNASDAQ:META After testing the strong support zone around $707–710,
NASDAQ:META shows signs of a potential rebound — the same zone that triggered a rally in July.
Technical view:
• Price bounced from a high-volume area (VRVP) and closed above HMA(9) near $709.
• MACD lines are converging, suggesting a possible bullish crossover ahead.
• Next resistance levels: $729 → $743 → $785.
• As long as price stays above $710, the recovery scenario remains valid.
NASDAQ:META might be setting up for a multi-wave rebound toward the upper resistance zone —
a “Back to the Future” moment as bulls try to reclaim lost momentum.
⚠️ Key risk: prolonged consolidation below $710 could delay the move.

META OCT 2025META 4H: Price is rebounding from the 700–712 demand zone after a sharp selloff. Reclaiming 707–715 would favor a gap-fill push. Overhead supply remains heavy at 750–770 (prior distribution/“14B sold” area). If buyers fail to absorb around 700, watch for a slide toward deeper supports.
Institutional read: Distribution visible between 750–770; potential absorption if 700–712 holds. Gap window 707–765 is the pivot for momentum.
Targets:
Upside: 750 first, extension 770 if gap fills.
Downside: 680 first, then 650; breakdown opens 610 gap-support.
#META #globaltrade #investment #investing #stockmarket #wealth #realestate #markets #economy #finance #money #forex #trading #price #business #currency #blockchain #crypto #cryptocurrency #airdrop #btc #ethereum #ico #altcoin #cryptonews #Bitcoin #ipo

$META Buy levelsNASDAQ:META is IMO, near term bearish, longer term bullish.
$640, $655 are good level to sell puts, and look for a possible bottoming at this zone based on my confluence of levels.

$META: Short-Term Neutral/Bullish, but ...bear traders still have opportunity to make more money.
The Bear Call Spread is the patient, high-probability play: Wait for the Automatic Rally to bounce to the ~$755-$765 resistance area, then enter the spread.
The Calendar Put Spread is a way to establish the bearish position now while using the expected bounce to help pay for the trade.
Price has now returned to the scene of the original crime—the ~$710 support level that marked the bottom of the entire trading range.

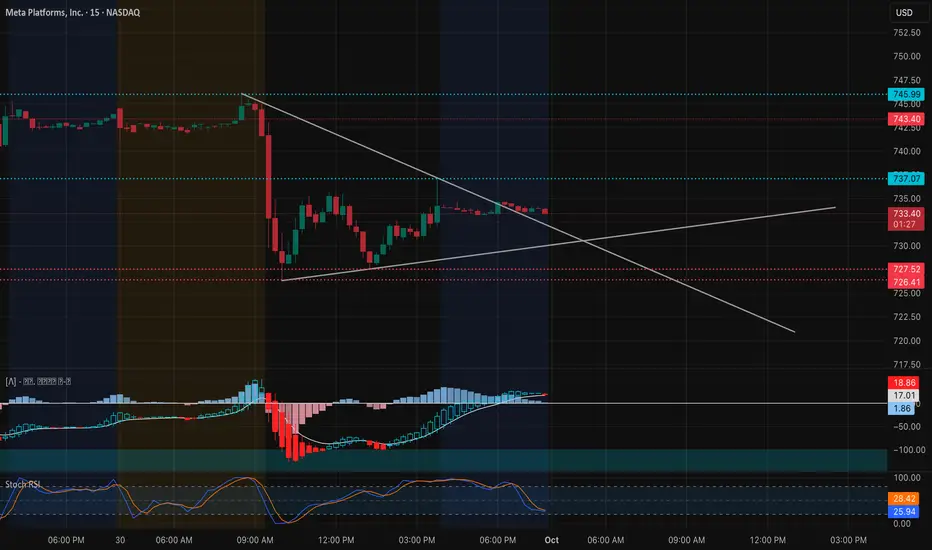
META Oct. 1 – Sitting on Support, Breakout or Breakdown Next?Intraday View (15-Min Chart)
META dropped sharply early and has since consolidated around $733 inside a tightening wedge. Sellers remain active, but support is holding near $727–$730 for now.
* Support Levels: $733.00, $727.52, $726.41
* Resistance Levels: $737.07, $743.40, $745.99
* Indicators: MACD still red but flattening out, showing momentum cooling. Stoch RSI near oversold, hinting at a potential relief bounce.
📌 Intraday Thought (Oct. 1): If $733 holds, META could rebound toward $737–$745. A breakdown under $727 risks a drop toward $720. Scalpers can lean long on $733 support with stops tight, or fade into $743–$745 if price rejects.
Options & Swing View (1H + GEX)
\
Gamma exposure shows where the flows matter:
* Upside: Large call walls stacked at $745–$755, with extension toward $760–$770.
* Downside: Strong put support anchored at $727–$720, deeper protection at $715.
This keeps META boxed between $727–$745 short term. A breakout over $745 could fuel a run toward $755–$760, while losing $727 risks accelerating downside toward $720 or even $715.
* Bullish Play (Oct. 1): Calls or spreads targeting $755–$760 if $745 breaks with volume.
* Bearish Hedge: Puts toward $727 → $720 if support gives way.
* Neutral Play: Iron condor between $727–$745 to capture premium in range.
My Thoughts (Oct. 1)
META is in a decision zone with $733 holding as a pivot. The chart shows compression under the wedge trendline—if $745 is reclaimed, momentum opens quickly to the upside. But losing $727 would signal continuation of weakness. I’d stay patient and let price confirm at either $745 breakout or $727 breakdown.
Disclaimer: This analysis is for educational purposes only and does not constitute financial advice. Always do your own research and manage risk before trading.