$NEM – Leading Gold Stock Nearing a Key Inflection BreakoutNewmont ( NYSE:NEM ) is one of the leaders in the gold sector, and it’s now pushing right into the 91.50–92 breakout zone — a level that has acted as major resistance for months. This is a high-stakes inflection point.
🔹 The Setup:
Price is tightening underneath 91.50–92, a clean horizontal resistance.
NYSE:NEM has been showing relative strength, tracking gold’s move nearly tick-for-tick.
Structure is clean: rising EMAs, bullish slope, and volume building underneath the trigger.
🔹 Why This Matters:
AMEX:GLD itself looks fantastic — tightening, trending, and primed for continuation.
When gold futures and GLD look this strong, leading miners like NYSE:NEM tend to run first.
This is exactly the kind of setup where institutional money steps in.
🔹 My Trade Plan:
1️⃣ Entry: Add through a clean breakout over 92 with volume confirmation.
2️⃣ Stop: Under the 9 EMA — tight and mechanical.
3️⃣ Target: Trend continuation, first into prior pivot highs, then toward measured move extensions.
Why I Like This Setup:
Leader stock + leader sector = high probability.
Technicals and macro backdrop (rates, inflation tailwinds, dollar softness) all point the same way.
NYSE:NEM is often the “tell” for the entire gold complex — if this breaks, the whole sector could run.
Newmont Corporation Shs Cert Deposito Arg Repr 0.333333 Sh
No trades
Trade ideas

Newmont’s Uptrend May Be IntactNewmont has steadily rallied in 2025, and some traders may think its uptrend remains intact into yearend.
The first pattern on today’s chart is the rebound from last month’s pullback. The gold miner is trying to hold a 50 percent retracement of the move, which may confirm its direction is still pointing higher.
Second, NEM is back above its rising 50-day simple moving average. That may suggest its intermediate-term trend is still bullish.
Third, the 8-day exponential moving average (EMA) is above the 21-day EMA. MACD is also rising. Those patterns may be consistent with a bullish short-term trend.
TradeStation has, for decades, advanced the trading industry, providing access to stocks, options and futures. If you're born to trade, we could be for you. See our Overview for more.
Past performance, whether actual or indicated by historical tests of strategies, is no guarantee of future performance or success. There is a possibility that you may sustain a loss equal to or greater than your entire investment regardless of which asset class you trade (equities, options or futures); therefore, you should not invest or risk money that you cannot afford to lose. Online trading is not suitable for all investors. View the document titled Characteristics and Risks of Standardized Options at www.TradeStation.com . Before trading any asset class, customers must read the relevant risk disclosure statements on www.TradeStation.com . System access and trade placement and execution may be delayed or fail due to market volatility and volume, quote delays, system and software errors, Internet traffic, outages and other factors.
Securities and futures trading is offered to self-directed customers by TradeStation Securities, Inc., a broker-dealer registered with the Securities and Exchange Commission and a futures commission merchant licensed with the Commodity Futures Trading Commission). TradeStation Securities is a member of the Financial Industry Regulatory Authority, the National Futures Association, and a number of exchanges.
TradeStation Securities, Inc. and TradeStation Technologies, Inc. are each wholly owned subsidiaries of TradeStation Group, Inc., both operating, and providing products and services, under the TradeStation brand and trademark. When applying for, or purchasing, accounts, subscriptions, products and services, it is important that you know which company you will be dealing with. Visit www.TradeStation.com for further important information explaining what this means.

$NEM Long Bull Flag So, I did take a big hit on my account because I got too excited, I think it's important that I monitor my emotions. It's definitely two different things when you are paper trading and trading with your personal fund. But we will hold apparently although it doesn't make sense. If a mining company performs well on their earnings, it falls and apparently gets back to all-time highs days later. So, I hope this is the case. Alot of analysts still have the company valued at $105 So I guess we will see. I guess it is also my fault instead of waiting for a drawback instead of buying at all-time high. But I guess we shall see.
I believe that NYSE:NEM has found support at $83 being that this is where it is finding support. I think that if its falls anything lower than that (I'm being hopeful by saying this) that it is just a liquidity zone. Trend line is weird we have two huge gaps that need to be filled. If I zoomed out, I would say they look this is a huge bull flag. A very Obvious bull flag you see how bull flags look zoomed in. I think Newmont will rip higher. Also, you know it will definitely go back up and hit the moving average. It may not have this insane run, but I suppose we will see. I think that long terms holders of Newmont will eventually win.
So there goes an update on my thoughts and on my technical analysis.
AS ALWAYS GODBLESS YOU ALL, I PRAY YOU ALL FIND JESUS, HE LOVES YOU AND HE IS ALWAYS THERE YOU ALL, HE DIED FOR YOUR SINS SO THAT YOU CAN BE FORGIVEN AND LIVE WITH HIM ETERNALLY IN HEAVEN.

NEM Newmont Corporation Options Ahead of EarningsAnalyzing the options chain and the chart patterns of NEM Newmont Corporation prior to the earnings report this week,
I would consider purchasing the 87usd strike price Puts with
an expiration date of 2025-10-24,
for a premium of approximately $2.18.
If these options prove to be profitable prior to the earnings release, I would sell at least half of them.

$NEM The BIG call So, I am finally going to share one of my big trades that I am going to use to try and grow my account it is NYSE:NEM , Newmont Corporation. It is an American Gold mining stock one of many they have all been performing especially well over the past six months and there is still a lot of significant upsides. It has an Earnings report on the 23 and it will potentially Skyrocket upwards. Yes, there was a significant Dip on Friday, and I believe traders took their money out to buy their steaks on the weekend.
So, I think there is true value here and in other mining stocks I would follow their earnings reports. Personally, I think it'll drop down to $88 and spike up after earning but there are a lot of high-end brokers getting in.
AS ALWAYS GODBLESS YOU ALL, I PRAY YOU ALL FIND JESUS, HE LOVES YOU AND HE IS ALWAYS THERE YOU ALL, HE DIED FOR YOUR SINS SO THAT YOU CAN BE FORGIVEN AND LIVE WITH HIM ETERNALLY IN HEAVEN. Although I don't know if there's trading in heaven but I guess we will see lol.

Chart Pattern Analysis Of NEM
After K3 close upon the neck line of a bullish head-shoulder pattern.
K5 close upon the resistance.
And the demands keep increasing too.
It seems that the bull market is accelerating here.
A short-term target at about 100-120USD.
I will try to buy it at K5.

Newmont Corp NEM BUYNewmont has rallied on surging gold prices and persistent market demand for safe haven assets. As the largest gold producer in the world, its scale and cost efficiency make it a favourite during macro uncertainty bank rate.

Newmont showing an extremely positive outlookSome notes which can be used as arguments to the bullish outlook:
The stock is above the 200D and even the 200W EMA.
Large inverted head and shoulders structure which presents an opportunity leading up to 80$ which also turns out to be the resistance level tested in 1987 and 2022.
Locally looks like someone has been accumulating.
Gold's bullish price into price discovery, geo-political uncertainty only re-affirms the thesis.
My expectation are that by the end of this year if not by middle of next year that the 80$ price target will be reached. There is a small stop at 65$ but I am highly doubtful we will stay a lot of time there.

NEM H&SThis looks like an inverted Head and Shoulders doesn't it?
I wouldn't be surprised if this right shoulder had a double-bottom.

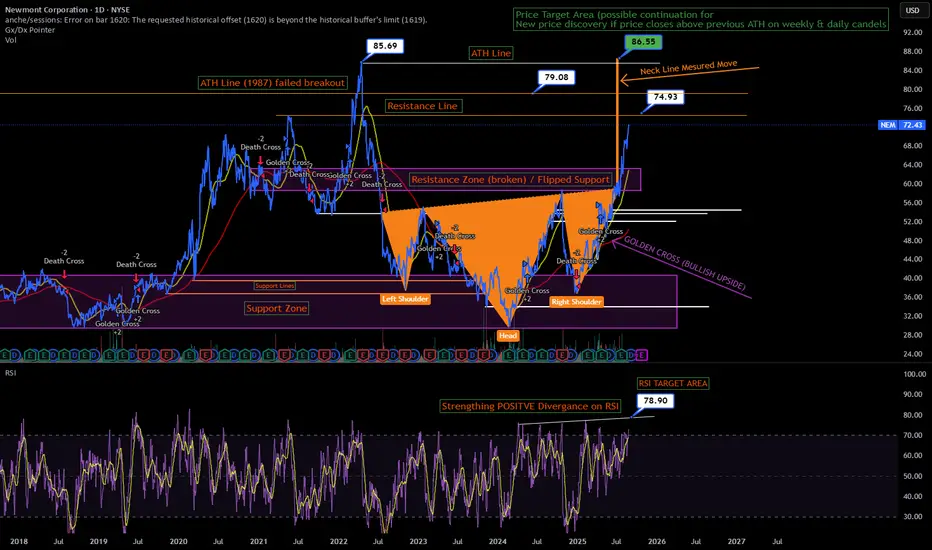
NEM Head & Shoulders technical breakout & new ATH Hi,
I actually spotted this a while ago and have keep this on the quiet but i am excited to share my first publication, This represents a clear "Ascending Inverse Head and Shoulders" with a slight favor to the upside.
I have set some price targets around potential Resistance levels also there was a double top since 1987 where if broken a harder move higher is likely to align with the Neckline measured move, Time wise i believe this will finish some time in Late November to early February in 2026.
Look to a pullback in RSI to see when the bullish buying and strength fades away but it will be excellent to see a conformation with some closes above the previous ATH on the 1 day or weekly candle charts. the golden Cross moving averages are with the 50 day vs the 200 day cross over indicating that a bullish golden cross is in full effect, i expect the measured move to complete along side some minor pull backs around the resistance levels, those dips should be brought into with strategic profit taking around the key levels, I wouldn't say exit NEM after completion more profit take and remain cautious until conformation of a new confirmed ATH breakout. 2026 could see a continuation grind to new heights around $100+ per share but will need to reinvestigate the double top breakout once played out after EOY.
Regards R.
Newmont Corp | NEM | Long at $48.00While gold prices have soared recently, gold mining stocks have lagged. Newmont Corp NYSE:NEM , the world's largest gold mining corporation, may be undervalued if the miners take off to catch up to the gold demand/price. Currently sitting near $48.00 and at a historical moving average that it will need to break to show a true trend reversal, NYSE:NEM is in a personal buy zone. Now, the price may break down at the simple moving average and test the patience of shareholders, but the long game may benefit those who can tolerate the volatility.
Target #1 = $57.00
Target #2 = $71.00

NEM ASX - breakout weeklyNEM now breaking out hard.
target is $74 AUD.
gold miners have yet to move but spot price of gold has already
started accelerating higher.
Bonds yields are still negative in real terms.
equities are overvalued. BTC is in a bubble. Gold is stability.
US empire wants to initiate more Wars. China will be the next to be
invaded. They will instigate something in Taiwan as they did in Ukraine.

NEM - Cup and Handle - to 85Classic look. Strong despite weakening gold price. As S&P continues into new high territory, time for the laggards to pick up the pace.

Potential outside week and bullish potential for NEMEntry conditions:
(i) higher share price for ASX:NEM above the level of the potential outside week noted on 13th June (i.e.: above the level of $88.35).
Stop loss for the trade would be:
(i) below the low of the outside week on 11th June (i.e.: below $80.70), should the trade activate.

NEM Newmont Corporation engages in the production and exploration of gold properties. It also explores for copper, silver, zinc, lead, and other metals. average analyst rating $56.
Technically showing cup and handle and above all important MA's. it can run anytime now keep and eye.

Potential Uptrend in NewmontNewmont has been climbing this year, and some traders may see further upside in the S&P 500’s only pure-play gold miner.
The first pattern on today’s chart is the pullback since mid-April. The lower low, lower high and second lower low may be viewed as a potential A-B-C correction. Completion of such a formation may suggest a longer-term uptrend is poised to resume.
Second, the 50-day simple moving average (SMA) had a “golden cross” above the 200-day SMA in April and has remained there since. That may reflect a bullish longer-term trend.
Third, prices are back above the 50-day SMA and bounced above the 200-day SMA.
Finally, stochastics are turning up from an oversold condition.
Check out TradingView's The Leap competition sponsored by TradeStation.
TradeStation has, for decades, advanced the trading industry, providing access to stocks, options and futures. If you're born to trade, we could be for you. See our Overview for more.
Past performance, whether actual or indicated by historical tests of strategies, is no guarantee of future performance or success. There is a possibility that you may sustain a loss equal to or greater than your entire investment regardless of which asset class you trade (equities, options or futures); therefore, you should not invest or risk money that you cannot afford to lose. Online trading is not suitable for all investors. View the document titled Characteristics and Risks of Standardized Options at www.TradeStation.com . Before trading any asset class, customers must read the relevant risk disclosure statements on www.TradeStation.com . System access and trade placement and execution may be delayed or fail due to market volatility and volume, quote delays, system and software errors, Internet traffic, outages and other factors.
Securities and futures trading is offered to self-directed customers by TradeStation Securities, Inc., a broker-dealer registered with the Securities and Exchange Commission and a futures commission merchant licensed with the Commodity Futures Trading Commission). TradeStation Securities is a member of the Financial Industry Regulatory Authority, the National Futures Association, and a number of exchanges.
TradeStation Securities, Inc. and TradeStation Technologies, Inc. are each wholly owned subsidiaries of TradeStation Group, Inc., both operating, and providing products and services, under the TradeStation brand and trademark. When applying for, or purchasing, accounts, subscriptions, products and services, it is important that you know which company you will be dealing with. Visit www.TradeStation.com for further important information explaining what this means.

Newmont (NEM): Precious Metals Power Technical SetupNewmont Corporation (NEM), one of the world’s largest gold producers, remains a go-to name for investors seeking exposure to precious metals. With a diverse portfolio of global mining operations, Newmont produces not just gold but also copper, silver, and zinc—making it a key player in both the metals and commodities sectors. Its commitment to sustainability, operational efficiency, and long-term resource development continues to drive investor interest, especially during periods of inflation and economic uncertainty.
Technically, the stock is holding above the 0.236 Fibonacci retracement level, placing it firmly in the momentum zone. The price is testing recent highs, showing bullish strength and signaling the potential for a breakout if buyers continue to step in with volume. This setup reflects increasing optimism and strong positioning in the broader market for gold-related equities.

Newmont (NEM): On the Road to $100?Newmont's recent price action, combined with the strength in gold, is starting to flash a familiar pattern — one that, historically, has preceded major rallies. With gold trading firmly above $2,500/oz and Newmont delivering strong free cash flow ($1.2B in Q1), the fundamental backdrop couldn’t be more supportive. This is no longer a “cheap optionality” gold miner — it’s leaner, focused on Tier 1 assets, and finally starting to act like the cash-generating machine it is.
From a technical standpoint, the breakout above the $48–$50 resistance zone was a key moment. There's now very little historical supply between current levels and the $80–85 range, and beyond that — open air until the psychologically charged $100 level. The current setup could be interpreted as either a classic cup and handle or an inverse head and shoulders pattern. In both cases, the structure targets a move of roughly +74% from the breakout — aligning almost perfectly with what history suggests.
Zooming out, Newmont has just completed a sixth historical breakout from long-term consolidation — following similar ones in 1979, 1986, 2001, 2016, 2019, and now again in March 2025. Each of those previous breakouts was accompanied by a confirmed bullish crossover in the 3-Year Distance % from Moving Average (MA), where price momentum pushed the indicator decisively above the zero line. The five prior rallies saw NEM increase by 156%, 302%, 208%, 63%, and 112% respectively.
Given that this time the breakout comes above all-time highs, the setup feels even stronger — and the path to $100 looks not only feasible, but statistically probable. The presence of a powerful long-term base, macro tailwinds, and renewed institutional interest in gold miners all point in the same direction.
If this move plays out like previous cycles, Newmont won’t just grind higher — it could rerate entirely, especially if capital rotation flows back into large-cap gold producers. Keep in mind: this is the largest publicly traded gold miner, with a robust balance sheet and solid dividend, in an environment where gold is hitting nominal records and fiat credibility is under pressure.
📈 Watch price behavior as it approaches $80–85 — a successful retest and continuation would make the $100 target all the more compelling.
Let me know your thoughts — are institutions coming back to the gold miners, or will momentum continue favoring the smaller silver plays and explorers?

$NEM - looks ready to trendWatch the monthly candle close. If it closes above 55, i expect this one to hit 70 very soon
NEM - Big Move AheadOver the long term, I expect to see NEM at 100. My crude wave count shows that we are entering into a wave 3 that can boost shares to mid $80s.

NEM eyes on $43.06: key Resistance to break and paint a BOTTOMNEM has been lagging gold and other metals' charts.
Currently up against a key resistance to a recovery.
Break-n-retest to paint a bottom, or reject to doom.
==============================================
,

NEM // cup handle formationAlthough there is a cup handle formation image on the chart, the targets are drawn according to Fibonacci. We need closings above 48.08 as a formation condition.

CUP and Handle Pattern NEM Stock making cup and handle along with bullish divergence, expected bullish trend, trade plane has been defined along with risk and reward.
