Netflix - This stock will drop another -30%!📽️Netflix ( NASDAQ:NFLX ) is still totally bearish:
🔎Analysis summary:
A couple of months ago, Netflix retested a major resistance trendline. This was a clear sign for us to take profits and Netflix has already been dropping about -30%. Looking at structure, the next support is the previous all time high, meaning Netflix will drop another -30%.
📝Levels to watch:
$70
SwingTraderPhil
SwingTrading.Simplified. | Investing.Simplified. | #LONGTERMVISION
Netflix, Inc. Shs ert Deposito Arg Repr 0.0208333 Sh
No trades
Market insights

NFLX AFTER SPLIT DIC 2025NFLX rejected 130;
distribution 105-100.
Absorption 95-90.
Upside 112-115.
Downside 90->80-75.
#NFLX #XLC #QQQ #SPY

NETFLIX longwe're finally seeing a retracement from the streaming behemoth, pulling into a zone of interest. although the mitigation looks promising, I am only weary about the liquidity that could cause some unwelcomed drawdown

Short Signal for $NFLX - $85 TargetNetflix is a company that has not just have had tons of controversy recently but are also in the middle of streaming wars in which people are unconfident if they can still maintain market share. After the expected Warner acquisition, the company would still be much lower on cash. Short signals are increasing and today the trendline has broken. As always, none of this is investment or financial advice. Please do your own due diligence and research.

Sanctions Impacting MarketsHow Economic Restrictions Shape Global Trade and Financial Systems
Economic sanctions have become one of the most powerful non-military tools used by governments and international organizations to influence political behavior, enforce international law, and protect national interests. Over the past few decades, sanctions have increasingly shaped global financial markets, commodity prices, trade flows, currency stability, and investor sentiment. Their impact extends far beyond the targeted country, often creating ripple effects across regional and global markets. Understanding how sanctions affect markets is essential for policymakers, businesses, investors, and traders operating in an interconnected global economy.
Understanding Economic Sanctions
Sanctions are restrictive measures imposed by one country or a group of countries against another nation, entity, or individual. These measures may include trade bans, financial restrictions, asset freezes, travel bans, and limitations on access to technology or capital markets. Sanctions are usually implemented to deter actions such as military aggression, human rights violations, terrorism, or nuclear proliferation. While their political objectives may be clear, their economic consequences are often complex and far-reaching.
Impact on Financial Markets
Financial markets are typically the first to react when sanctions are announced. Stock markets in the targeted country often experience sharp declines due to uncertainty, capital outflows, and reduced corporate earnings expectations. Banking and financial institutions face restrictions on international transactions, limiting their ability to raise capital or conduct cross-border business. This can result in liquidity shortages and increased borrowing costs.
Global markets are not immune either. International investors reassess risk exposure, leading to increased volatility in equities, bonds, and derivatives. Sanctions imposed on major economies or key commodity producers can trigger global sell-offs, as investors factor in slower growth, supply disruptions, and geopolitical uncertainty.
Currency and Inflation Effects
Sanctions often exert significant pressure on the targeted country’s currency. Restrictions on foreign exchange access and international payments reduce foreign capital inflows, causing currency depreciation. A weaker currency increases import costs, fueling inflation and reducing purchasing power for consumers. Central banks may be forced to raise interest rates to stabilize the currency, which can slow economic growth further.
For global markets, currency volatility can spill over into emerging economies with trade or financial linkages to the sanctioned nation. Investors may move capital toward safe-haven currencies such as the US dollar, Swiss franc, or Japanese yen, strengthening these currencies while weakening risk-sensitive ones.
Commodity Markets and Supply Chains
One of the most visible impacts of sanctions is on commodity markets. When sanctions target countries that are major producers of oil, gas, metals, or agricultural products, global supply constraints can emerge. Reduced supply often leads to higher prices, increasing costs for industries and consumers worldwide.
Energy markets are particularly sensitive. Sanctions on oil- and gas-producing nations can disrupt supply chains, push up energy prices, and increase inflation globally. Similarly, sanctions affecting metals like aluminum, nickel, or rare earth elements can disrupt manufacturing, especially in sectors such as automobiles, electronics, and renewable energy.
Supply chains may be forced to reorganize as companies seek alternative suppliers, often at higher costs. Over time, this can lead to structural changes in global trade patterns, with new alliances and trade routes emerging.
Impact on Trade and Corporate Earnings
Sanctions restrict exports and imports, reducing trade volumes and affecting corporate revenues. Companies operating in or trading with sanctioned countries may face compliance risks, legal penalties, and reputational damage. Multinational corporations often withdraw operations or suspend investments, leading to asset write-downs and job losses.
Export-oriented industries in third-party countries can also be affected. For example, nations that rely on intermediate goods from sanctioned countries may experience production disruptions. Conversely, some countries may benefit by filling supply gaps, gaining market share in commodities or manufactured goods.
Investor Sentiment and Risk Perception
Sanctions significantly influence investor psychology. Heightened geopolitical risk leads investors to adopt a risk-off approach, reducing exposure to equities and emerging markets while increasing allocations to bonds, gold, and other safe assets. Market uncertainty can persist long after sanctions are imposed, as investors remain cautious about potential escalation or retaliatory measures.
Long-term sanctions may also reduce foreign direct investment (FDI) in affected regions, slowing economic development and innovation. Markets tend to price in not only current restrictions but also the possibility of tighter measures in the future.
Global Economic Growth and Spillover Effects
The cumulative impact of sanctions can slow global economic growth, especially when major economies are involved. Reduced trade, higher energy costs, and financial fragmentation can dampen productivity and investment worldwide. Developing economies are often disproportionately affected, as they have fewer buffers against external shocks.
Sanctions can also accelerate economic fragmentation, encouraging countries to reduce dependence on global systems dominated by specific currencies or institutions. This may lead to the creation of alternative payment systems, regional trade blocs, and localized supply chains, reshaping the global economic order.
Market Adaptation and Long-Term Structural Changes
Over time, markets adapt to sanctions. Businesses find alternative routes, governments implement countermeasures, and new partnerships emerge. However, these adjustments often come with inefficiencies and higher costs. While some sectors and regions may benefit, overall market efficiency tends to decline.
In the long run, frequent use of sanctions may reduce trust in global financial systems and encourage de-globalization. Investors and companies increasingly factor geopolitical risk into strategic planning, leading to more cautious and diversified investment approaches.
Conclusion
Sanctions have become a defining force in modern global markets, influencing everything from stock prices and currencies to commodities and trade flows. While designed to achieve political objectives, their economic consequences are widespread and often unpredictable. For market participants, understanding the mechanisms through which sanctions impact markets is crucial for risk management and strategic decision-making. As geopolitical tensions continue to shape the global landscape, sanctions will remain a key factor driving volatility, structural change, and long-term market evolution.

Netflix: Analysts See 27%–43% UpsideThe Netflix–Warner Bros. Discovery deal highlights how capital structure and asset quality now drive bargaining power in the streaming sector.
Netflix approaches the deal from a position of financial strength. The company enhances its content offering without expanding its asset base or increasing leverage. No incremental capex, no balance sheet strain. Licensed content improves return on invested capital and supports free cash flow, which remains the core valuation driver for the stock. Netflix continues to trade as a cash-generating platform rather than a content-heavy studio.
Warner Bros. Discovery enters the agreement under clear financial constraints. As of the latest reported quarter, total assets stand at approximately $100.5 billion. The bulk of this figure is tied to non-current assets, primarily film and television content libraries, production rights, and intangible assets. Current assets amount to roughly $13 billion, underlining limited liquidity flexibility.
On the other side of the balance sheet, total liabilities reach about $63 billion, with long-term debt estimated near $33.5 billion. Net assets or shareholders’ equity are around $37 billion. This capital structure explains management’s growing emphasis on asset monetization. Licensing premium content to Netflix converts illiquid library value into immediate cash flow, improving short-term EBITDA visibility and supporting deleveraging efforts.
From a credit perspective, the transaction is constructive. It strengthens cash inflows without additional investment risk. From an equity perspective, however, it reinforces the market’s existing discount. Warner Bros. Discovery owns a valuable asset base, but that base is capital-intensive, slowly amortizing, and increasingly used as collateral for financial stability rather than growth.
The strategic implication is clear. Warner Bros. shifts from platform expansion to balance sheet defense. Streaming assets move from exclusivity tools to financial instruments. The company prioritizes liquidity, debt reduction, and earnings predictability over long-term optionality.
In market terms, the deal confirms a structural imbalance. Netflix monetizes scale and distribution power with minimal asset exposure. Warner Bros. Discovery monetizes assets to preserve financial flexibility. This is not industry convergence. It is a transfer of leverage from asset owner to distributor. Netflix gains earnings visibility and optionality. Warner Bros. gains time, but not a re-rating.
TA
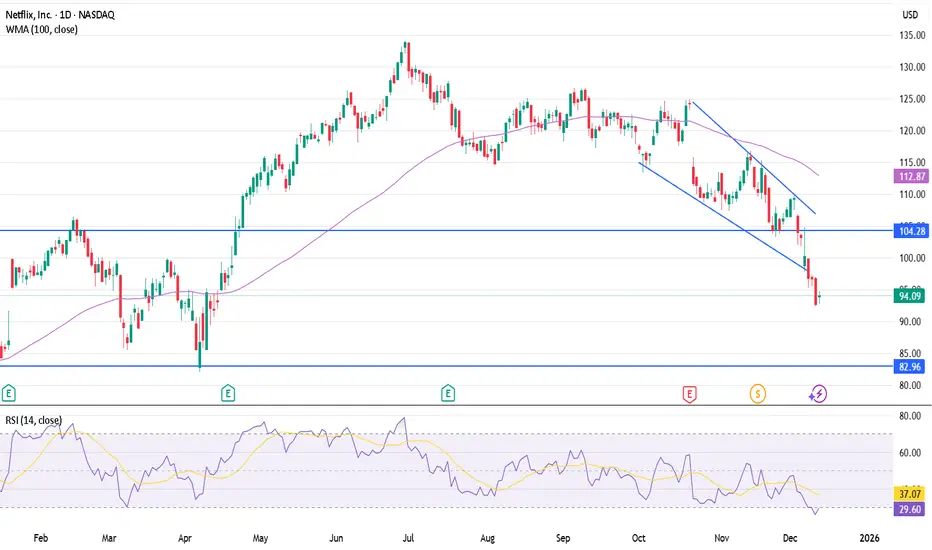
Netflix shares are currently in a short-term corrective phase within a broader uptrend. The pullback toward the 94 dollar area appears controlled and technical in nature, following a strong prior rally.
The primary trend remains bullish as long as price holds above key support levels. Both the 50-day and 200-day moving averages are sloping higher, with the 50-day acting as dynamic support. No bearish crossover is present, confirming that the move lower is consolidation rather than trend reversal.
From a support perspective, the first key zone lies between 92 and 90 dollars. This area coincides with prior consolidation and should attract buyers on weakness. A deeper support band is located at 86–88 dollars, aligned with the 200-day moving average. A sustained break below this zone would materially weaken the technical structure.
On the resistance side, initial resistance stands at 97–98 dollars, where recent selling pressure emerged. A clean break above this level would open the path toward 102–105 dollars, which represents the next technical target and prior highs.
Momentum indicators suggest cooling rather than distribution. RSI has moved lower from overbought levels but remains above neutral, consistent with a healthy pullback. Volume has eased during the decline, indicating a lack of aggressive selling.
Overall, the technical picture supports a buy-on-dips framework while price remains above 90 dollars. The stock needs consolidation before attempting another leg higher, but the trend remains constructive and aligned with the broader bullish narrative.
Ratings
Analyst sentiment on Netflix remains firmly constructive. Recent reports from major investment firms continue to support the bullish thesis.
Morgan Stanley reiterates a Buy rating with a price target of 120 dollars, citing margin expansion, growing free cash flow, and upside from the advertising tier.
Jefferies maintains a Buy rating and assigns a price target of 134 dollars, reflecting confidence in earnings growth, strong revenue visibility, and Netflix’s premium positioning within global streaming.
Wolfe Research also reiterates a Buy rating, setting a price target at 121 dollars, driven by improving operating leverage and higher returns on content investment.
With the stock trading around 94 dollars, analyst targets imply upside potential of approximately 27 to 43 percent. Overall, the Street continues to view Netflix as a structurally strong cash flow compounder with favorable risk-reward at current levels.

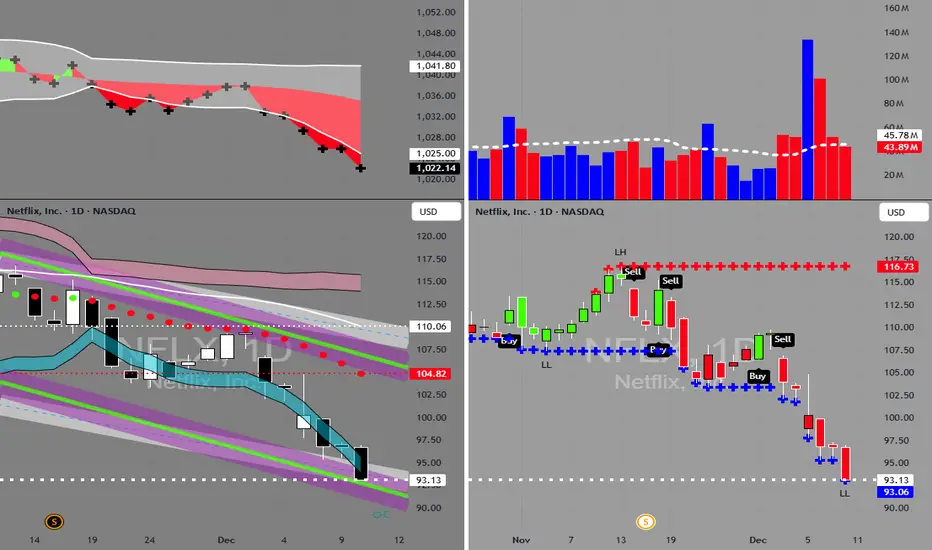
NFLX in BUY ZONEMy trading plan is very simple.
I buy or sell when at either of these events happen:
* Price tags the top or bottom of parallel channel zones
* Money flow volume spikes beyond it's Bollinger Bands
So...
Here's why I'm picking this symbol to do the thing.
Price in buying zone at bottom of channels
Money flow momentum is spiked negative and under bottom of Bollinger Band
Entry at $93.10
Target is upper channel around $105.00
Buying NASDAQ:NFXL for this trade
Oversold; Fundamentals NFLX- Dropped 40% from ATH
- Still a safer asset if the economy were to weaken, since they are going full speed on the Ad-tier plan
- Based on RSI, it is oversold.
- Most of the negative reaction to the acquisition of Warner Bros. has been priced in. On the other hand, if Warner decides to call off the deal to pursue a different merger, the stock would immediately increase since they would also collect a $2.8 billion breakup fee
- If they do win the bid, they would acquire more content and IP, which would improve the product long term; and it would also help lower CACs. So I see some positives either way if you bet on this long term.
- YTP dropped to single digits; Lowest PE going back to 2023. As a blue chip that is growing with a strong customer base and great content, its fundamentals don't justify the price.
Bought at 93
TP: 115
There is another supportat 85
NFLX LongDemand Zone
Long entry 94
Stop 89
Target 115, 125
Risk management is much more important than a good entry point.
I am not a PRO trader.
In my trading plan, the Max Risk of each short term trade should be less than 1% of an account.

NFLX is a buy at $83 strong supportNFLX is getting oversold but no support until $83 which should bounce back to $108.75 and $114.76 in coming weeks after support is seen. We have some support at $93 but, I don't feel the move downward is done with the hostile bid floating around

NETFLIXDear Traders
Netflix i see it can reach this target first even i see lower in the future
lets see how this can play out

$NFLX #Netflix Outlook [High Margins, Low Debt, High Growth]NASDAQ:NFLX is attempting to acquire Warner Bros. Discovery (WBD). The stock has dropped roughly 31% from its highs. In big acquisitions, the stock of the company doing the buying usually drops because investors worry they are overpaying or taking on too much complexity. The fact that a bidding war is starting with Paramount adds uncertainty.
Strengths:
PEG is 1.14
Netflix is a consumer growth stock. Finding a tech giant growing earnings at 25%+ per year (EPS next 5Y is 25.64%) trading at a PEG of 1.1 is rare. The recent price drop has made the valuation very attractive relative to its growth.
Debt/Eq is 0.66
Netflix has very manageable debt. This gives them the power to make bold moves, like trying to buy Warner Bros without risking bankruptcy.
Profit Margin is 24.08
For every dollar of subscription money they take in, they keep 24 cents as pure profit. This is high for a media company that spends billions on content creation. It shows their business model has fully matured.
Weaknesses
If Netflix wins the war for WBD, they have to integrate a massive, legacy media company. This is messy, expensive, and dilutes existing shareholders. If they lose the war to Paramount, the stock might bounce back, but they lose a strategic asset. Uncertainty kills stock prices!
IMO, Netflix's problems are strategic which is a merger drama, not structural.
Not an investment advice, DYOR!
#AHMEDMESBAH #Stocks #NFLX #NETFLIX

NFLX has bottomed and will reverseNASDAQ:NFLX With amazing earnings and ATH revenue, NFLX is set to reverse from here. Great price to buy here at a 35% discount.
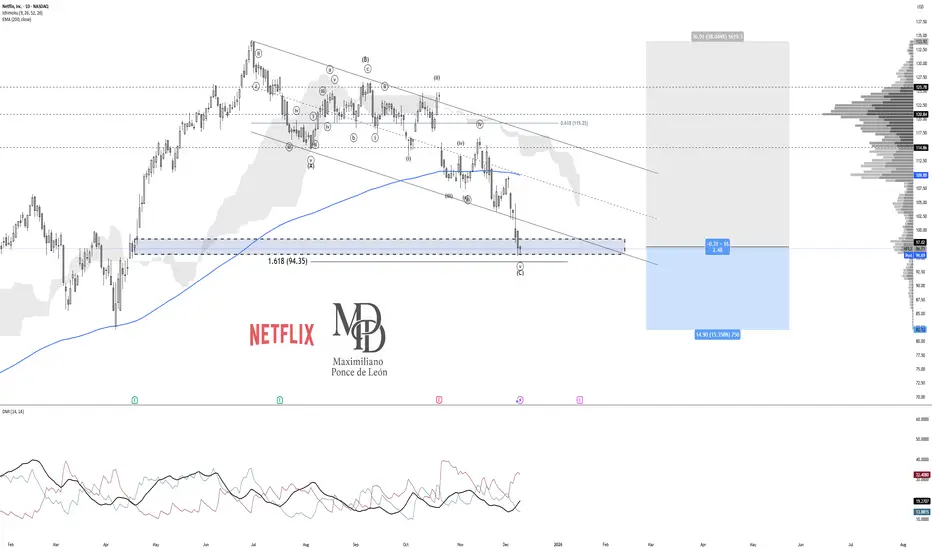
NFLX - Conteo ElliotPossible end of the corrective ABC in NFLX, reaching the 1.618 extension of wave C and reacting in a Demand zone. Entries here seem reasonable with a stop-loss at 82 USD.
For more conservative entries, wait for the 61.8% retracement of the entire ABC (119 USD).
Weekly Trend NFLXAfter a long upward move, the weekly chart is now showing a clear Head & Shoulders pattern. Price has broken below the neckline, which usually signals a trend change. The next major support is around the 60–62 zone. For now, the market bias remains bearish unless price moves back above the neckline.

Netflix Going to 82 or lower? Here is a quick analysis of the market of we are currently seeing, if you need further help and are struggling send me a DM more than happy to answer any questions you may have
Trade Smarter Live Better
Kris

Netflix Paramount - Acquisition war - What You need to know. Netflix is selling off because it announced a massive, high‑risk acquisition of major Warner Bros. Discovery assets — and the market hates the price, the leverage, and the regulatory risk.
The bid is in the range of $72-$82 Billion.
Trump tweeted last night putting the deal under scrutiny.
This tweet comes on the back of Paramount Skydance announcing a hostile take over bid $108B of warner bros discovery. Trumps son in law Jared Kushner hold private equity in Para and would benefit from the takeover.
Netflix is sitting pretty as the stock has sold off in anticipation of higher cap ex. If the deal doesn't go through it will likely rebound.
Netflix wont have to pay the 5.8 Billion break up fee if WBD board votes down their deal. In fact Netflix will receive $2-$3 Billion.

$NLFX short, open of year ($89,50) is a strong magnet nowAs the purchase process of Warner Bros Discovery moves into 2026, investors will probably next look to how Netflix handles the remaining $34 billion in debt.
Will they dump new shares on investors?

NETFLIX NEXT MOVE UPNFLX has completed a significant bearish displacement from the highs and is now trading into a well-defined higher-timeframe demand zone, which previously served as the origin of a strong impulsive rally. The current decline shows signs of momentum deceleration as price approaches this area, increasing the probability of sell-side liquidity being absorbed.
From a market structure perspective, price transitioned from an uptrend into distribution, followed by a clean break lower. This move has now extended far enough to justify expectations of at least a corrective reaction, provided demand holds. Multiple supply zones overhead explain prior rejections, making this a location-based swing rather than a trend continuation play.
The plan is to wait for confirmation within the demand zone (bullish daily close, rejection, or lower-timeframe structure shift). Risk is clearly defined below demand, while upside targets sit at prior internal range highs and untouched supply zones above, offering favorable risk-to-reward. If demand fails with acceptance below, the setup is invalidated — no trade.

Understanding Currency ConvertibilityWhat is Currency Convertibility?
Currency convertibility refers to the ease with which a country’s currency can be converted into foreign currencies without restrictions imposed by the government or central bank. When a currency is fully convertible, individuals, businesses, and investors can freely exchange it for another currency for any purpose—trade, travel, investment, or capital transfers.
For example, if an Indian exporter earns US dollars, currency convertibility determines whether and how easily those dollars can be converted into Indian rupees or reinvested abroad. Similarly, foreign investors assess convertibility before investing, as it affects their ability to repatriate profits and capital.
Why Currency Convertibility Matters
Currency convertibility is not just a technical financial concept; it has broad economic implications:
Facilitates International Trade
Convertibility allows exporters and importers to settle cross-border transactions smoothly, reducing friction in global trade.
Encourages Foreign Investment
Investors prefer countries where profits and capital can be freely repatriated, making convertible currencies more attractive.
Integrates Economies Globally
Convertibility helps integrate domestic financial markets with global markets, improving efficiency and competitiveness.
Signals Economic Confidence
A convertible currency often reflects confidence in a country’s economic fundamentals and monetary stability.
Types of Currency Convertibility
Currency convertibility is broadly classified into three main types:
1. Current Account Convertibility
This allows free exchange of currency for transactions related to trade in goods and services, remittances, interest payments, and tourism. Most countries, including India, have current account convertibility.
Example:
An Indian student paying tuition fees abroad or an exporter receiving payment in foreign currency falls under current account transactions.
2. Capital Account Convertibility
Capital account convertibility permits free movement of capital across borders for investments such as foreign direct investment (FDI), portfolio investment, real estate purchases, and loans.
This form is more sensitive because unrestricted capital flows can expose economies to volatility. Hence, many developing nations impose partial controls.
Example:
An Indian investor buying foreign stocks without limits would require full capital account convertibility.
3. Full Convertibility
A currency is fully convertible when both current and capital account transactions are unrestricted. Major global currencies like the US Dollar, Euro, British Pound, and Japanese Yen are fully convertible.
Partial vs Full Convertibility
Many emerging economies adopt partial convertibility as a balanced approach. Under this system:
Trade and service-related transactions are liberalized.
Capital flows are regulated through limits, approvals, or sector-specific controls.
This allows countries to enjoy the benefits of globalization while safeguarding against sudden capital flight and financial instability.
Advantages of Currency Convertibility
Boosts Trade and Exports
Easier currency exchange reduces transaction costs and improves competitiveness of exporters.
Attracts Foreign Capital
Convertible currencies signal openness and stability, attracting FDI and portfolio investments.
Improves Resource Allocation
Capital flows to sectors with higher returns, increasing overall economic efficiency.
Enhances Financial Market Development
Convertibility encourages deeper bond, equity, and forex markets.
Strengthens Global Integration
Countries with convertible currencies participate more actively in global financial systems.
Risks and Challenges of Currency Convertibility
Despite its advantages, currency convertibility also carries significant risks:
Capital Flight Risk
Sudden withdrawal of foreign capital during economic or political instability can destabilize the economy.
Exchange Rate Volatility
Free capital flows can lead to sharp currency fluctuations, affecting trade and inflation.
Loss of Monetary Control
Central banks may find it harder to control money supply and interest rates under full convertibility.
Exposure to Global Shocks
Global financial crises can quickly transmit to domestic markets through capital flows.
Speculative Attacks
Weak economies with open capital accounts may face speculative pressure on their currencies.
Currency Convertibility and Developing Economies
For developing countries, currency convertibility is a strategic decision rather than a binary choice. Gradual liberalization is often preferred to ensure:
Strong banking systems
Adequate foreign exchange reserves
Fiscal discipline
Stable inflation
India, for instance, adopted current account convertibility in the 1990s while cautiously liberalizing the capital account. This phased approach helped balance growth with stability.
Role of Central Banks and Governments
Central banks play a vital role in managing currency convertibility by:
Regulating foreign exchange markets
Managing reserves
Monitoring capital flows
Intervening during excessive volatility
Governments complement this by maintaining sound fiscal policies, regulatory oversight, and transparent financial systems.
Currency Convertibility in the Era of Globalization
With globalization, digital payments, and cross-border investments, currency convertibility has become even more relevant. However, recent trends show that even advanced economies may impose temporary controls during crises, highlighting that convertibility is dynamic and policy-driven rather than absolute.
Conclusion
Understanding currency convertibility is essential for grasping how modern economies function in a globalized world. It influences trade, investment, exchange rates, and financial stability. While full convertibility offers greater integration and efficiency, it also exposes economies to external risks. Therefore, the optimal level of convertibility depends on a country’s economic strength, financial maturity, and policy preparedness.
A well-managed convertibility framework—supported by strong institutions, prudent regulation, and sound macroeconomic policies—can serve as a powerful engine for sustainable growth and global economic participation.

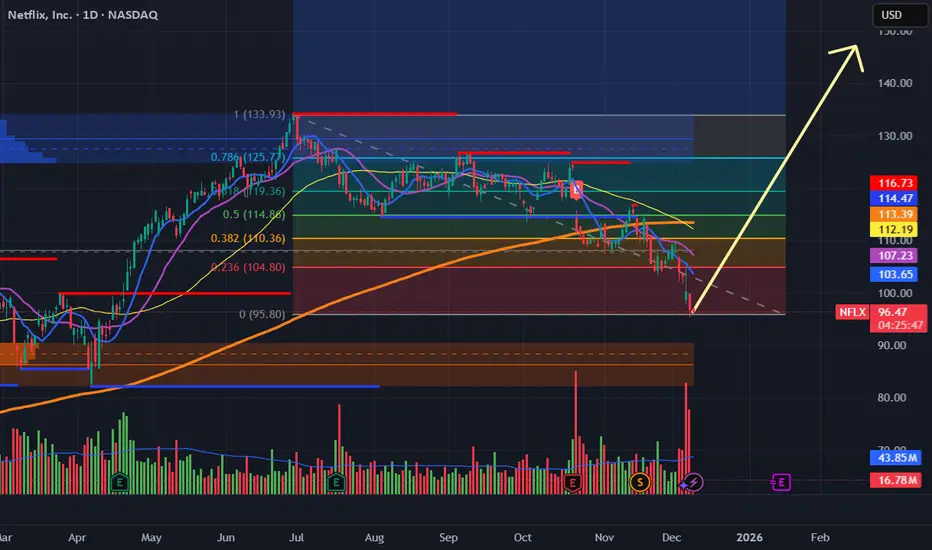
$NFLX one last pump before falling further?NASDAQ:NFLX looks like it's setting up for a reversal here. I could see one last move higher into the $113-117 range as a final rally before heading lower.
We've formed a higher low on the $94.25 support level. Options flows starting to look bullish. Let's see if we get one final move higher into end of the year or early January.

$NFLX its showtime!What it dew yall?! So NASDAQ:NFLX came out the gates steaming this morning but has reduce some of its spark as the day has progressed. Price is still in a semi uptrend on the 15 min TF. Price rejected at Level 0. Technically Buyers lost control after we closed below the 0.382, However it's not over until we're under the 0 and because this is an early spot, I have set my S/L at the -.0272 (CLOSE below this level). Where price is right now this would be considered an early Entry, (As long as the EMA's don't flip/ Side note, I use 8/14/21 EMA's). The R:R is Crazyyyyy. Not too much to lose and everything to gain. Plus, Tomorrow is CPI. What could get more crazier right before Christmas? LOL.
Once I learn how to publish my indicators correctly, Ill let yall know.
Happy Trading, Alerts Set!

Netflix stock forecast analysis for the end of 2025Netflix stock end of 2025 forecast analysis.
Netflix american stock has reached a decent and strong monthly imbalance trading at $98 per share. Let's see if the streaming company wants to move to higher prices before the end of 2025. The bullish impulse is made of strong bullish candlestick bodies created between April and June 2025. It took a few months to pull back but Netflix is there now.
