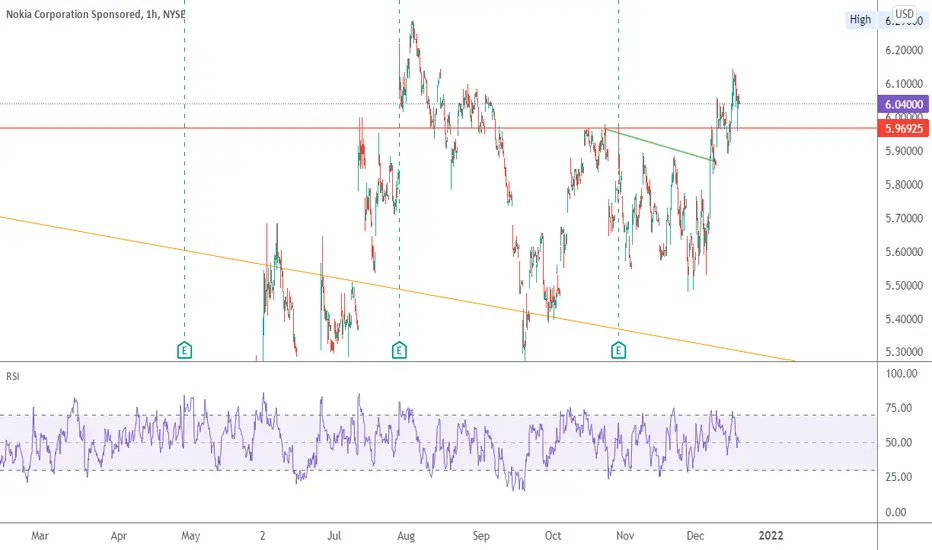
Nokia Sneaks Toward New HighsNokia has gone nowhere for more than a decade, but now the Finnish networking stock may be finding new life.
The first pattern on today’s chart is the symmetrical triangle that formed in August and September. NOK broke out of this range earlier this month. It proceeded to bounce above the triangle last week, turning old resistance into new support.
Second, the stock is now above its 50-day simple moving average (SMA), 100-day SMA and 21-day exponential moving average (EMA). That wasn’t true just three weeks ago, which suggests the intermediate-term trend has recently grown bullish.
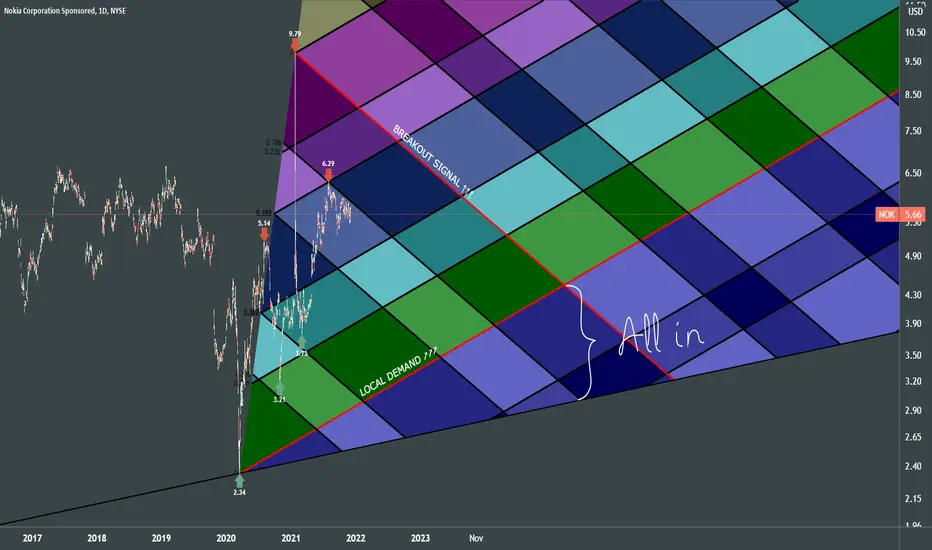
Third, NOK was targeted in January’s meme-stock frenzy. That briefly pushed its shares above $9.50. But if you exclude the unusual moment, NOK’s close yesterday was its highest in almost three years. It’s pushing some longer-term peaks from several years ago. There was also price gap on February 1, 2016. Filling it could bring NOK back to $7.
Overall, NOK may resemble Ford Motor a few months ago – another once-mighty name that had fallen from the limelight. However the fundamentals were improving with F as prices squeezed toward multiyear highs. Like F, NOK has showed signs of a turnaround as 5G orders flow in. Like F, it also struggled with chip shortages. Will it also climb a wall of worry as things return to normal?
TradeStation is a pioneer in the trading industry, providing access to stocks, options, futures and cryptocurrencies. See our Overview for more.
Important Information
TradingView is not affiliated with TradeStation Securities Inc. or its affiliates. TradeStation Securities, Inc., TradeStation Crypto, Inc., and TradeStation Technologies, Inc. are each wholly owned subsidiaries of TradeStation Group, Inc., all operating, and providing products and services, under the TradeStation brand and trademark. When applying for, or purchasing, accounts, subscriptions, products and services, it is important that you know which company you will be dealing with. Please click here for further important information explaining what this means.
This content is for informational and educational purposes only. This is not a recommendation regarding any investment or investment strategy. Any opinions expressed herein are those of the author and do not represent the views or opinions of TradeStation or any of its affiliates.
Investing involves risks. Past performance, whether actual or indicated by historical tests of strategies, is no guarantee of future performance or success. There is a possibility that you may sustain a loss equal to or greater than your entire investment regardless of which asset class you trade (equities, options, futures, or digital assets); therefore, you should not invest or risk money that you cannot afford to lose. Before trading any asset class, first read the relevant risk disclosure statements on the Important Documents page, found here: www.tradestation.com .
Nokia Oyj ADR Cert.Deposito Arg.Repr. 1 ADRs
No trades
Market insights

NOK NOKMy fav stonk
Deep f'ing value back to the future tech titan now focused on industry 4/5
This LOOKS bullish
But combined with the general market, decreasing volume and our Schiff pitchfork this may turn out to be a false break
Let's see
NOT INVESTMENT ADVICE
G.R.I. Dec '21

NOKIA massive cup and handleStarted last January with the massive Wallstreetbets spike. We made a cup from Jan - Aug. And then since August to December we made the handle. It is a cup and handle pattern one year in the making. Based on the fibs if we continue going up maybe 6.80 is the next resistance for the price. But overall still undervalued and is a good entry point currently.

Strong Bullish signal on Nokia (NOK) stockOpportunity to go LONG on Nokia (NOK) stock.
Like and Comment will be hugely appreciated, thank you so much for your support.
See other ideas below too!
RISK DISCLAIMER:
Trading Futures ,Forex, CFDs and Stocks involves a risk of loss.
Please consider carefully if such trading is appropriate for you.
Past performance is not indicative of future results.
Always limit your leverage and use tight stop loss.


NOKIA near to the SupplyHey, guys hope you doing good.
as we know that Nokia has already achieved its task by completing the bullish moves. now there is a supply though that is weak if that gets eliminated by the price we need to use confirmations there because that is already tested several times, so it became weak. we always use confirmations on the weak levels of Supply and demand. if that doesn't happen then let it go upwards for more time.
best of luck.

NOKIAGreat industry 4.0 value stonk
Back to the future tech titan
But probs going to 3.76 here lol
NOT INVESTMENT ADVICE

NOKIA decades of accumulation nokia take 1.
Posting another scenario later/
nfa
as
dasdas
d
sad
sa
da
das
dasd
as

Nokia Fibonacci ChannelsNokia looks stable despite of recent decline of indices. Any drop I will view as good opportunity to accumulate before the breakout.
I'd periodically buy this stock with partial entry on every upcoming market sale.
It's been on demand levels for a long time and time for its recovery is almost completed.
BIG TF VIEW:
NOKIA retrace levels$3.5 likely
DISCLAIMER: No advice here, post for information only
TECHNICALS: pitchforks off major pivots, fib levels
FUNDAMENTALS: Industry 4.0 stonk- deep fkn value


NOK price consolidation; looking for a price breakoutTechnical - NOK is forming a bullish flag which could lead to a price breakout. RSI looks good too.
Fundamentals - NOKIA has a mission to be a leader in 5G technology with many patents. I remember reading that NOKIA was asked by AT&T to help them with their 5G rollout.

Nokia Head and ShouldersNYSE:NOK
Looks like Nokia is at a critical level of support with a head and shoulders formed.

$NOK long JAN '24 $10 strike @ .55 to end generational povertyI like the chart. Think this one goes. Opened the position in the title.

Nokia Climbing Wall of WorryNokia - Looking for a break through resistance to confirm Double Bottom, Higher Low

NOKHoly wow! Nok breakout backtest and ready to RIP!!!! 5.36 was backtest this thing can FLY mainly we wat to see a breakout above then .618 fib which sits at 6.30. Confirm suppor above that. That’s the last key to a rip to 8.75 12.72 and potentially as high as 19.14$. We do want to see price break .630$ but it’s in the right setup to do soo also holdinf 5.54 as support will be another key thing to see on a pullback


Convergence of linesI just noticed this convergence of lines. Maybe they are meaningless but I've this feeling that the stock will stay flat and converge with minimal ranges until that point (take it for a thought and do your own analysis of course) but there could be some surprise at earning time news because the price could jump outside the convergence.

Nokia bounces off supportNokia has had a fairly big correction recently but now looks like it might be bouncing back up off a long term trend line

NOKIA ---- The Power of EMA with fibonacciEMA89 was broken - what's next?
I use EMA 13/34/89/144 indicator and RSI stochastic for this analysis. I've been use it for quite a while, and found it useful for my trend analysis. After significant optimism over at least 4 consecutive quarter, unfortunately the price trend has changed. EMA 13/34 dead crossed, continued with price drop below EMA89 with a low volume. Most likely will also drop further until EMA144.
Further we can see also open gap below ( mark with number 1, 2 and 3), which like it or not will be closed sooner or later. Unless there is significant move fundamentally, perhaps it will rebound technically.
I believe if NOKIA able to promote faster 5G Technology adoption, it will be a game changer for them, while at the same time they have strong competition from China vendors globally.

