$NVDANASDAQ:NVDA reports earnings next week, but I feel the hype is slowing down.
The only catalysts that could keep them strong are deeper ties with Israel’s defense systems and the new military tech initiatives they’re trying to build.
But even with that, the price needs a balance point.
NVDA is too extended it needs a healthy correction before the next leg.
Trade ideas

Continuation of the "AI Bubble" A chart for NVDA that illustrates the parabolic curve on this very large timeframe
To expect a curve like this to break is unlikely
AI will have huge implications
The potential of AGI aswell is huge for humanity in general. I don't see a bubble at all.
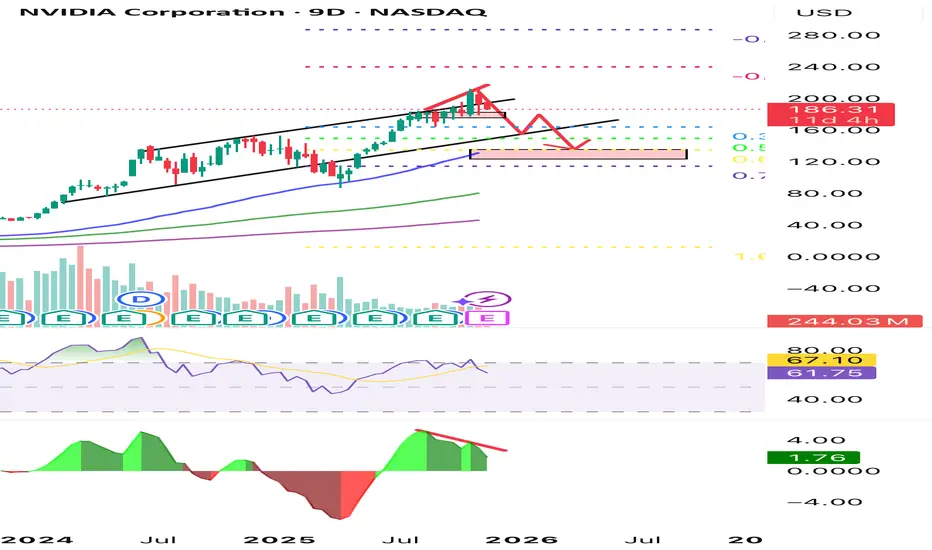
Weekly timeframe

NVDA Montly Neg. Divergence?Sure, stocks will rise eventually and we have been in a strong bull market since autumn 2022 but how about this negative divergence on the monthly chart of NVDA? (Also on the weekly chart.) Monthly charts always shows us the direction and we just take action according that by looking at the daily. How long more the buyers are going to buy NVDA? Count the Elliott waves since Oct. 2022 on higher time frames as well. Indicators getting weak, Fibonacci is struggling around 161 level… Something has to cool off.

Market Noise That Traps Retail Traders1. What Is News Trading?
News trading is a strategy where traders take positions based on the expected market reaction to economic events or announcements. These events can be:
Economic data (GDP, inflation, interest rates, unemployment)
Central bank decisions (RBI, Fed, ECB meetings)
Corporate earnings and guidance
Mergers, acquisitions, buybacks
Global geopolitical developments
Commodity reports (OPEC meetings, inventory data)
Government policies and regulations
News changes market expectations, and markets move on expectations — that’s the core idea behind news trading.
2. What Is “Noise” and Why Is It Dangerous?
Noise is any information that creates confusion without adding value.
Examples of noise:
Clickbait headlines (“Market to crash 20%?”)
Social media hype (Twitter/X rumors)
WhatsApp university “insider news”
Delayed news after the market has already reacted
TV channel opinions that change every minute
Over-analysis without data
Emotional panic or euphoria from retail traders
Noise causes wrong decisions, late entries, and over-trading.
Professional traders avoid it by sticking to verified, timely, and market-moving information.
3. Why Most Retail Traders Fail in News Trading
Retail traders often:
React after the move has already happened
Trade based on emotions, not data
Follow misleading social media posts
Don’t understand whether news is actually important
Lack a prepared plan before events
Cannot interpret the deviation between expected and actual data
Professional traders, on the other hand, plan days ahead and execute in seconds.
4. How to Trade News Without Noise – The Clean Process
The core idea is: Be prepared before the news, respond instantly to real numbers, avoid emotional reactions.
Here’s the step-by-step process:
Step 1: Know Which News Actually Matters
Not all news moves markets. Learn to classify news into:
High Impact News
RBI policy meetings
US Federal Reserve meetings
Inflation data (CPI, WPI)
GDP growth numbers
Employment data
Major earnings announcements
Geopolitical tensions (war, sanctions, oil shocks)
Medium Impact News
Industrial production
Services PMI, Manufacturing PMI
Consumer sentiment
Smaller corporate updates
Low Impact News
Minister speeches
General opinions
Minor announcements
Over-analyzed TV commentary
Rule: Focus only on news with real economic consequences.
Step 2: Prepare a News Calendar
Before the week starts, create a watchlist of events:
Date
Time
Expected numbers
Previous numbers
Expected market reaction
Tools to use:
Economic calendars
Earnings calendars
OPEC & inventory calendars
RBI/Fed meeting schedules
Preparation removes confusion and reduces noise.
Step 3: Understand “Expectations vs Reality”
Markets don’t react to news itself; they react to the difference between expected and actual results.
Example:
If inflation is expected at 5% but comes at 5.4%, markets fall.
If it comes at 4.7%, markets rise.
This deviation is called “surprise factor.”
Professional traders instantly measure this deviation and take positions.
Step 4: Use the 10-Second Rule During News
During major announcements:
Avoid trading in the first 10 seconds
Let the initial volatility settle
Watch the direction that forms after the first burst
This protects you from:
Whipsaws
False breakouts
High spreads
Stop-loss hunting
Clean news trading happens when you allow the dust to settle.
Step 5: Read Market Reaction, Not Headlines
Instead of reacting to headlines, look at:
Price action
Volume
Market structure
Order flow
Option chain (PCR, IV crush, delta shift)
Markets sometimes reverse the initial move when the news is already priced in.
Price is the real truth.
Step 6: Have a Pre-Defined Plan
Before the news releases, decide:
If number is better → buy or go long
If number is worse → sell or go short
If number meets expectations → avoid trading
This clarity eliminates emotional decisions.
Step 7: Avoid Social Media & TV Noise
Once news is released, social feeds explode with:
Panic
Rumors
Emotional reactions
Incorrect interpretations
Professionals ignore all this and stick to data and price.
5. Tools and Indicators to Reduce Noise in News Trading
These tools help you filter real movements from noise:
1. Volume Profile
Shows if the move has real institutional participation or just retail panic.
2. Market Structure
Identifies:
break of structure (BOS)
change of character (CHOCH)
real trend direction
3. Volatility Indicators
ATR (Average True Range)
Implied volatility (IV)
They help you avoid fake spikes.
4. Liquidity Zones
News often sweeps liquidity before moving in the real direction.
5. Option Chain Analysis
IV Crush
Rapid delta movement
Change in OI
PCR shift
This gives instant information on institutional positioning.
6. Best Markets for News Trading
Forex Market
Most sensitive to:
interest rate decisions
inflation
employment data
Stock Market
Most sensitive to:
earnings
M&A news
regulatory changes
Commodity Market
React to:
crude oil inventory
OPEC decisions
weather reports (for agri commodities)
Index Futures (Nifty, Bank Nifty)
React strongly to:
RBI policy
global cues
geopolitical risk
These markets give clean opportunities during news.
7. Common Mistakes to Avoid
Trading BEFORE the news – high risk
Entering too late AFTER the move – trap
Following hype and rumors
Not using stop-loss
Taking too large position sizes
Over-trading due to excitement
Ignoring the bigger trend
Avoiding these mistakes helps you trade news without getting caught in noise.
8. Risk Management for News Trading
News trading is profitable only with strict risk rules:
Keep position size small (1–2%)
Use stop-loss every time
Avoid averaging losers
Take profits quickly
Never hold weak trades through big events
News moves fast; your risk control must be even faster.
9. How Professionals Maintain Clarity
Top traders follow this checklist:
They prepare for news
They track expectations, not opinions
They avoid emotions
They follow price action
They execute as per plan
They ignore noisy sources
They use data, not predictions
This is why their entries are clean and exits are disciplined.
Conclusion
Trading news without noise is all about clarity, preparation, discipline, and data-based decisions.
Instead of reacting to hype, you follow a structured process:
Identify high-impact news
Study expectations
Wait for real numbers
Confirm with price action
Execute clean trades
Manage risk tightly
When done properly, news trading can give some of the best and fastest profits in the market. When done emotionally, it becomes the fastest way to lose money.

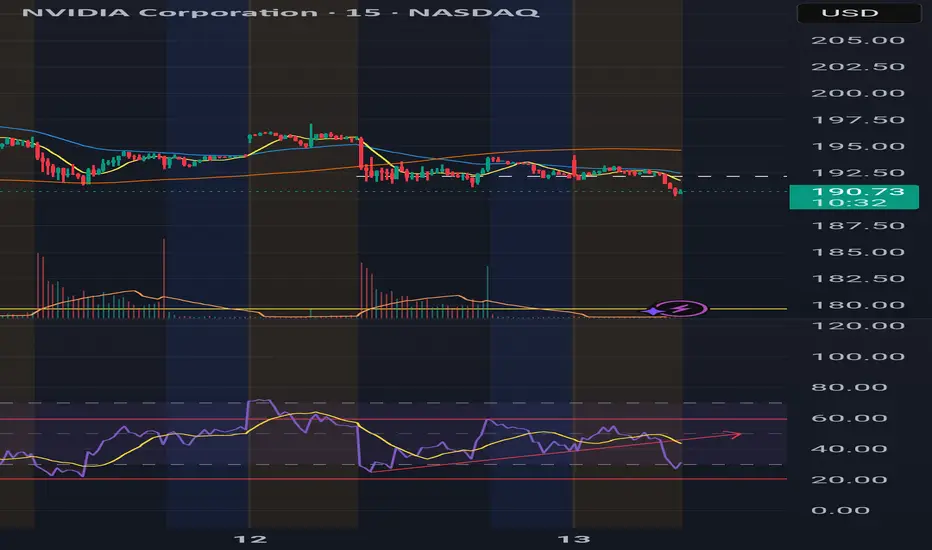
NVIDIA hourly patteren✅ Resistance Levels
Near ~$198.50 as a third resistance point.
Around ~$194.97 as a second resistance zone.
A prior high close‑to ~$212 from recent months that may act as a major ceiling.
✅ Support Levels
Support identified at ~$183.33.
A lower support zone near ~$179.79.
Broad support zone in the ~$182‑187 range from another study.

NVDA Weekly Call Alert — AI Recovery + Institutional Flow🧭 Overview
Ticker: NVDA
Current Price (Entry): $187.50
Trend: Bullish (Analyst + AI recovery)
Expiry: 2025-11-21 (7D)
Strike: $187.50 (ATM, Delta 0.521)
Position Size: 4% of portfolio
📊 AI & Technical Forecast
Katy AI Target: Recovery sequence $185 → $190, timing for momentum reversal
Analyst Price Target: $250
PCR / Flow Intel: 0.33 → bullish institutional positioning
RSI: 80.9 → overbought, expect short-term dip before upward move
VIX: 19.84 → favorable volatility entry before expansion
Insights:
Friday entry captures weekend theta premium
Light weekly volume (0.6x) → monitor for institutional confirmation
Dip to $185.50 may provide optimal entry for maximum upside
🎯 Trade Setup
Parameter Value
Direction CALL
Strike $187.50
Entry $7.50
Target 1 $12.00 (+60%)
Target 2 $15.00 (+100%)
Stop Loss $4.50 (–40%)
Expiry 2025-11-21
Position Size 4% portfolio
Confidence 60%
⚡ Key Advantages
ATM call → balanced risk/reward vs OTM alternatives
Tight stop aligns with AI critical support at $184.44
Institutional bullish flow + AI recovery pattern → asymmetric reward potential
Timing advantage: Monday-Tuesday momentum reversal
🚨 Risk Notes
Low AI confidence (50%) → disciplined sizing required
Overbought RSI → short-term upside may be capped
Rising VIX → daily premium decay risk, consider scaling entry
Avoid holding past Wednesday if Target 1 isn’t reached
Summary
NVDA presents a medium-conviction weekly call leveraging AI recovery trajectory, institutional flow, and analyst support. Ideal for disciplined traders seeking timed momentum entry into a 7-day horizon.
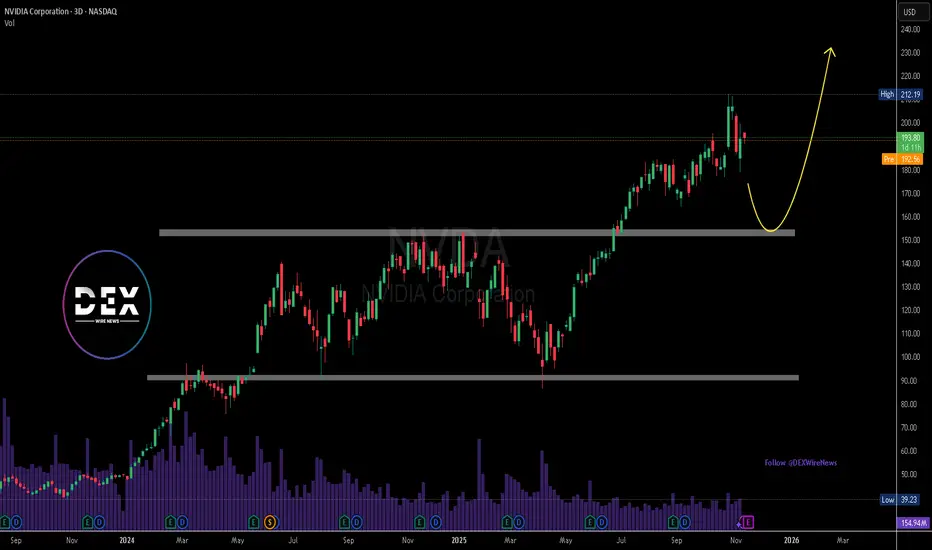
Nvidia Is +115% Since April. Here's What Its Chart SaysNvidia NASDAQ:NVDA has gained some 115% since its April low and recently hit an all-time high. Let's see what the chip giant's chart and fundamental analysis can show us ahead of NVDA's fiscal Q3 earnings release next week.
Nvidia's Fundamental Analysis
Nvidia CEO Jensen Huang this month traveled to Taiwan to attend the annual sports day held by integrated-circuits maker Taiwan Semiconductor NYSE:TSM , which he called NVDA's "forever partner."
Although Nvidia has deals in place with firms like Intel NASDAQ:INTC , TSM is Nvidia's primary foundry when it comes to manufacturing high-end AI-capable GPUs.
Huang said in public remarks that he asked TSM for additional chip supplies because "the business is very strong and it's growing month by month, stronger and stronger."
I can't wait to see if next week's earnings release tells the same tale.
Nvidia plans to roll out its latest results after the closing bell next Wednesday (Nov. 19).
Wall Street's consensus view calls for the firm to report $1.25 in adjusted earnings per share on roughly $54.8 billion in revenue. That would represent a 54.3% gain from $0.81 in adjusted EPS the same period last year, as well as better than 56% top-line growth from the $35.1 billion that NVDA saw a year earlier.
While many investors would see that as incredible growth, Nvidia's sales have actually been decelerating from almost unheard-of levels in recent years due to the law of large numbers. However, a print like that would be in line with Nvidia's fiscal Q2 result released in August.
Meanwhile, 32 of the 39 sell-side analysts that I know of who cover NVDA have revised their estimates higher since the quarter began, while six have reduced their forecasts. (One estimate has been left unrevised.)
Nvidia's Technical Analysis
Next, let's check out NVDA's year-to-date chart through Monday afternoon:
Readers will see that NVDA this spring blasted out of a cup-with-handle pattern, as denoted by the green box and purple curving line at the chart's left. This is a bullish technical set-up.
The shares then rallied in late summer in an ascending-triangle pattern, marked with a green box and black lines at the chart's right.
That's normally a pattern of bullish continuance, which is exactly what Nvidia saw until the U.S. government shutdown impacted markets as October moved into November.
That said, Nvidia managed to find support at its 50-day Simple Moving Average (or "SMA," marked with a blue line at $183.90 in the chart above). That's where investors would look for professionally managed money to potentially defend the stock.
Conversely, the $212.19 intraday record high that NVDA set on Oct. 29 might serve as the stock's upside pivot.
Looking at Nvidia's secondary technical indicators, the stock's Relative Strength Index (the gray line at the chart's top) appears to have found some support recently at the neutral line and began moving higher again.
Meanwhile, Nvidia's daily Moving Average Convergence Divergence indicator (or "MACD," marked with black and gold lines and blue bars at the chart's bottom) isn't bullishly postured, at least not yet.
However, the histogram of the stock's 9-day Exponential Moving Average (or "EMA," denoted by blue bars) could be poised to move back into positive territory soon.
And while Nvidia's 12-day EMA (the black line) recently moved below the 26-day EMA (the gold line), the black line seems to be curling upward and might soon re-cross over the gold one. The bulls would be rooting for that.
An Options Option
As I write this, the options market is pricing in a roughly $16 move in Nvidia (or 8%) in relation to next week's earnings.
Option traders who expect Nvidia to rise in response to next week's earnings and who would rather use leverage than lay out to purchase the stock might employ a simple bull-call spread in this situation.
This strategy involves purchasing one call while simultaneously selling a second call at with higher strike price, but the same expiration date. Here's an example:
-- Long one NVDA $200 call with a Nov. 19 expiration date (i.e., after next week's earnings release). The cost is about $7.85 at recent prices.
-- Short one Nov. 19 NVDA $215 call, generating a $2.85 premium.
Net Debit: $5
The trader in this example is risking the $5 net debit, which would represent his or her maximum theoretical loss in the above spread.
But if NVDA rises as the trader in this example expects and both options are exercised, the person would realize $15 of proceeds minus the $5 debit for $10 net profit (the maximum gain).
(Moomoo Technologies Inc. Markets Commentator Stephen "Sarge" Guilfoyle was long NVDA and INTC at the time of writing this column.)
This article discusses technical analysis, other approaches, including fundamental analysis, may offer very different views. The examples provided are for illustrative purposes only and are not intended to be reflective of the results you can expect to achieve. Specific security charts used are for illustrative purposes only and are not a recommendation, offer to sell, or a solicitation of an offer to buy any security. Past investment performance does not indicate or guarantee future success. Returns will vary, and all investments carry risks, including loss of principal. This content is also not a research report and is not intended to serve as the basis for any investment decision. The information contained in this article does not purport to be a complete description of the securities, markets, or developments referred to in this material. Moomoo and its affiliates make no representation or warranty as to the article's adequacy, completeness, accuracy or timeliness for any particular purpose of the above content. Furthermore, there is no guarantee that any statements, estimates, price targets, opinions or forecasts provided herein will prove to be correct.
Options trading is risky and not appropriate for everyone. Read the Options Disclosure Document (j.moomoo.com j.moomoo.com ) before trading. Options are complex and you may quickly lose the entire investment. Supporting docs for any claims will be furnished upon request.
Options trading subject to eligibility requirements. Strategies available will depend on options level approved.
Maximum potential loss and profit for options are calculated based on the single leg or an entire multi-leg trade remaining intact until expiration with no option contracts being exercised or assigned. These figures do not account for a portion of a multi-leg strategy being changed or removed or the trader assuming a short or long position in the underlying stock at or before expiration. Therefore, it is possible to lose more than the theoretical max loss of a strategy.
Moomoo is a financial information and trading app offered by Moomoo Technologies Inc. In the U.S., investment products and services on Moomoo are offered by Moomoo Financial Inc., Member FINRA/SIPC.
TradingView is an independent third party not affiliated with Moomoo Financial Inc., Moomoo Technologies Inc., or its affiliates. Moomoo Financial Inc. and its affiliates do not endorse, represent or warrant the completeness and accuracy of the data and information available on the TradingView platform and are not responsible for any services provided by the third-party platform.

NVDA using TrenVantage LITEQuick look at nvidia using the TrenVantage LITE indicator. Clearly in a downtrend here, close levels plotted are daily's that have been tested, chances are they wont hold. Would expect to see the lower levels since this has already turned into a downtrend. Weekly Monthly and Daily Key Levels all plotted.

Elliott Waves Don’t Lie: NVDA’s Path to $26,000Summary: “Elliott Waves, Fibonacci, and Smart Money align perfectly — NVIDIA’s long-term chart points to an AI-powered Supercycle with massive upside." 💎📊
🚀 NVDA | The Supercycle of the AI Era! 💚
🌀 Elliott Wave Supercycle Breakdown
NVIDIA’s price action over the past two decades is a textbook example of a multi-decade Elliott Wave Supercycle — where technical , fundamentals , and Smart Money flows perfectly align to form a once-in-a-generation structure 🌎
Let’s break it down step-by-step 👇
Super Cycle Wave (1) — launched in the early 2000s, marking NVDA’s first growth phase during the birth of consumer GPUs 🎮.
Super Cycle Wave (2) — deep correction into 2002, retracing a 0.786 Fibonacci, cleansing early euphoria and creating the foundation for institutional accumulation 💼.
Then began the Super Cycle Wave (3) — the most powerful phase of all. Within it, we have distinct macro sub-waves:
1️⃣ Macro Wave (1) — ended in 2007 , aligning with the first institutional wave of adoption.
2️⃣ Macro Wave (2) — retraced 0.618 in 2008 , coinciding with the global financial crisis (perfect Smart Money shakeout).
3️⃣ Macro Wave (3) — the current dominant leg, fueled by exponential AI and data center growth . It’s extending toward the 3.618 Fibonacci extension (~$256) , confirming wave strength and institutional conviction.
4️⃣ Macro Wave (4) — expected between 2026–2027, likely retracing 0.236–0.382, a natural cooling period before the next breakout.
5️⃣ Macro Wave (5) — projected to rally toward 4.618 extension (~$2,500) , completing Super Cycle Wave (3) near 2029 🏁
From there, a larger Super Cycle Wave (4) correction could unfold before the final parabolic Super Cycle Wave (5) run to the 5.618 Fibonacci extension (~$26,000) — the climax of NVDA’s decades-long AI expansion super-trend 🌕
💰 Smart Money Concept (SMC) Perspective
The chart structure clearly shows Smart Money accumulation patterns in every correction phase:
Re-accumulation ranges appeared at every 0.618 retracement level 📊
Liquidity grabs below previous swing lows before strong impulsive moves ⚡
Fair Value Gaps (FVGs) filled during corrections, creating perfect liquidity imbalances that institutional players exploit
Currently, NVDA trades near a premium zone of Macro Wave (3), but Smart Money will likely reaccumulate during the upcoming Macro Wave (4) discount phase (2026–2027).
Expect Order Block re-tests and liquidity sweeps around discounted Fibonacci retracement zones (0.236–0.382) before the next major rally 📉➡️📈
📈 Price Action Structure
NVDA’s macro structure remains strongly bullish:
The multi-decade trend has respected every higher high and higher low sequence since 2008.
Each impulse is followed by a healthy re-accumulation range, never breaking long-term structure.
Expect distribution near the $250–$300 (split-adjusted) region as Wave (3) matures, followed by a macro correction that offers generational entries for long-term investors 🧠
🔢 Fibonacci Confluence & Technical Harmony
Fibonacci has been the invisible hand guiding NVDA’s growth 👇
0.786 retracement (2002) → deep liquidity reset
0.618 retracement (2008) → institutional re-entry
3.618 extension (256) → current macro resistance target
4.618 extension (2500) → Super Cycle Wave (3) final target
5.618 extension (26K) → ultimate Super Cycle Wave (5) projection
Each impulse and retracement aligns perfectly with Fibonacci’s geometric rhythm , proving the power of confluence between time, price, and sentiment.
🧠 Fundamentals — The Energy Behind the Waves
Behind the technicals lies unmatched fundamental growth :
💾 AI & Data Centers: NVIDIA is the core infrastructure for modern AI compute and cloud training workloads.
🧩 CUDA Ecosystem: A software moat that ties developers and enterprises directly to NVIDIA’s architecture.
🌐 Omniverse & Robotics: Positioning NVDA as a leader in 3D simulation, robotics, and digital twins — future trillion-dollar markets.
⚙️ Strategic Partnerships: Expanding across hyperscalers, automotives, and enterprise AI.
Each innovation wave fuels a new Elliott Wave impulse , with the AI revolution now driving the strongest macro leg in NVDA’s history.
⚡ Macro Outlook & Timeline
✅ Now (2025): Completing Macro Wave (3) of Super Cycle (3) → heading toward $256 target
⚠️ 2026–2027: Macro Wave (4) correction to 0.236–0.382 (Smart Money entry)
🚀 2028–2029: Macro Wave (5) push → Super Cycle (3) peak near $2,500
🌊 2030–2032: Super Cycle (4) correction — consolidation phase
💎 2035–2040+: Super Cycle (5) → ultimate 5.618 target near $26K
💬 Final Thoughts
"Every correction is a setup for the next expansion. Smart Money buys fear — not euphoria."
NVIDIA is the heartbeat of the AI revolution , the core of data-driven computing , and a living Fibonacci sequence in motion.
As long as fundamentals stay aligned with the wave rhythm, NVDA’s Supercycle will continue to redefine what’s possible in long-term growth. 🌌
#NVDA #ElliottWaveAnalysis #SmartMoneyConcept #PriceActionTrading #FibonacciMagic #AIRevolution #StockMarket #Investing #TradingViewCommunity #TechSupercycle #NVDAtoTheMoon #LongTermInvesting
💬 Traders, analysts, and wave watchers — your insights matter!
Have you spotted NVDA’s next move? Drop your Elliott Wave counts, confirmations, or constructive critiques below 👇 Let’s discuss NVIDIA’s structural evolution, AI-driven Supercycle, and long-term growth potential together 🚀💚
Every comment adds perspective — let’s decode this massive wave as a community! 🌊📈
— Team FIBCOS ⚡💎


I'm betting for a big pullback in NVDANVDA is still strong in the broader sense, but the shorter-term internal strength (momentum, volume) is waning. If it busts above ~$190-195 with volume, it could resume big.
If it doesn’t, beware the risk of a pullback or consolidation.
Choose your option path accordingly.
NVDA is still strong in the broader sense, but the shorter-term internal strength (momentum, volume) is waning. If it busts above ~$190-195 with volume, it could resume big.
If it doesn’t, beware the risk of a pullback or consolidation. Choose your option path accordingly.

Nvidia nov-dec 2025 end yearPrice in the middle of weekly range ($178.91–$200.05) at phase 1 to 2
EMA alignment confirms bearish weekly trend
i believe NVIDIA might dip to $160 - $170 (near the gap it has created/ 1 x A Fib extension levels), with downward pressure due to overvaluations

Nvidia - Squeezing every single bear!🧯NVidia ( NASDAQ:NVDA ) is finally breaking out:
🔎Analysis summary:
Over the course of the past couple of months, Nvidia has been rallying +125%. Considering the market cap of Nvidia, this is already an insane move but clearly not the end. We can still see another +25% from here, before Nvidia will then retest the next resistance.
📝Levels to watch:
$250
SwingTraderPhil
SwingTrading.Simplified. | Investing.Simplified. | #LONGTERMVISION

Bearish Divergence Triggering a Mid-Cycle Cooldown?NVDA is flashing a notable momentum deceleration. Price keeps printing higher highs while both RSI and MACD histogram carve lower highs — a classic bearish divergence signaling a potential medium-term pullback.
Price has also broken below the rising micro-channel, suggesting exhaustion after an aggressive vertical rally. If sellers maintain control, the next liquidity pockets sit around the Fibonacci cluster between 0.5 and 0.618, roughly the $145–$155 zone. A deeper corrective flush could extend toward the $130–$115 demand block highlighted on the chart.
The broader trend remains structurally bullish, but current signals point to a healthy corrective phase rather than immediate continuation. Watching how price behaves on the retest of the broken channel will be key to confirming further downside.
Market is shifting from momentum-driven expansion to controlled mean reversion.
UpdatePrice accelerated through solid red divergence line on RSI. If yellow RSI moving average drops below 40 on RSI expect further acceleration to 188 and potentially lower.
Nvidia Denies $1B Mexico Plan, Eyes Key SupportNvidia Corporation (NASDAQ: NASDAQ:NVDA ) came under brief scrutiny on Wednesday after reports suggested a $1 billion investment in a new data center project in Nuevo León, Mexico. The tech giant has since denied any financial involvement, clarifying that its role in Latin America remains limited to collaborative initiatives, research, and talent development, not direct infrastructure spending.
The confusion began when the state’s governor, Samuel García, publicly announced the investment alongside individuals presented as Nvidia representatives. However, later corrections confirmed that the green hydrogen data center would actually be built by CIPRE Holding, utilizing Nvidia’s technology rather than capital.
Despite the miscommunication, the news had little fundamental impact on Nvidia’s long-term growth narrative. The company remains the dominant force in AI semiconductors, with global demand for GPUs powering everything from data centers to generative AI models. However, short-term volatility persists amid global tech supply pressures, tighter U.S.–China chip export controls, and broader market repricing ahead of potential U.S. interest rate cuts in December.
From a technical perspective, NVDA recently hit resistance near the $212 high before retracing. The chart suggests potential for a healthy correction toward the $155 support range, which coincides with a strong accumulation zone from mid-2025. A rebound from this level could fuel a continuation toward $230–$240, resuming Nvidia’s dominant uptrend.
Investors remain focused on upcoming quarterly earnings and the broader market’s reaction to monetary easing expectations. A confirmed rate cut could renew institutional appetite for high-growth tech names, keeping Nvidia positioned as one of the most favored equities in the AI sector.
NVDA Big Move Loading. TA for Nov. 12–15NVDA at a Critical GEX Compression Zone
NVDA has been moving like a stock caught between two worlds — heavy enough to stay suppressed, but supported enough to avoid a real breakdown. When you zoom out, the candles almost look like they’re waiting for someone to flip a switch.
In reality, NVDA is not being moved by momentum alone — it’s being shaped by something deeper:
gamma exposure (GEX) compression.
And this GEX structure is telling a very clear story about what’s coming next.
4H Chart — Structure Meets Hidden Liquidity
NVDA has been respecting a rising structural band that stretches across early November. Every major reaction — every sweep, every bounce — has happened along this diagonal liquidity path.
This is not random.
It’s where past BOS and CHoCH events have clustered, and it’s also where NVDA’s GEX shifts from defensive to neutral.
Price recently tapped this diagonal trendline again and stabilized right above the 178–180 GEX shelf. The reaction wasn’t explosive — but it was steady. That’s exactly what you see when larger players are quietly absorbing liquidity.
The story here is simple:
NVDA is compressing toward a decision.
1H Chart — Short-Term Drift Toward a Break
On the 1H timeframe, NVDA’s price is drifting inside a narrow pocket between 188–196. Sellers are pressing from above, but bulls are defending from below — and neither side is gaining ground.
This is classic GEX neutral-pocket behavior:
* Low volatility
* Wicks on both ends
* Lack of follow-through
* Clean candles but no conviction
The moment NVDA breaks OUT of this pocket, the move will be far more decisive than anything we’ve seen this week.
GEX Data — The REAL Battlefield
(Refer to screenshot below)
This GEX landscape is incredibly clear and incredibly important.
🔹 Positive GEX cluster at 200–210
This is the heavy CALL/GEX shelf that acts like a magnet AND a ceiling.
When NVDA pushes into this zone, hedging flows stabilize the move, but upside becomes controlled.
This is why the last rally failed at 202–205.
🔹 Neutral GEX zone between 188–196
This is the pocket where NVDA is trading right now.
Neutral pockets compress price and load energy for the next breakout.
This is where NVDA is stuck — for now.
🔹 Negative GEX zone below 185
This is the danger zone.
If NVDA breaks below 185, hedging pressure flips aggressively bearish.
That’s why 185 is your key line in the sand.
🔥 Trading Suggestions Based on Structure + GEX
📌 Bullish Scenario (Higher Probability)
ONLY valid if NVDA holds above 188–190 and breaks above 195.
ENTRY ZONE:
193–195 (1H reclaim)
TARGETS:
* 197.50 (first GEX magnet)
* 202.50 (second GEX shelf)
* 210.00 (major GEX wall / highest positive NET GEX)
STOP-LOSS:
Below 188
(Below this, NVDA re-enters GEX compression = chop)
WHY IT WORKS:
As soon as NVDA clears 195, it enters a staircase of positive GEX levels. These levels act like magnets and guide price toward the CALL walls.
📌 Bearish Breakdown Scenario
ONLY valid if NVDA loses 185 with conviction.
ENTRY:
Break below 184.80
TARGETS:
* 181.00
* 178.90 (big negative GEX shelf)
* 175.00
STOP-LOSS:
Above 188
WHY IT WORKS:
Below 185, NVDA enters a negative GEX zone, where dealer hedging accelerates selling.
🔥 Options Trading Suggestions (GEX-Based)
📌 Bullish Options Play (if NVDA reclaims 195)
Buy:
NVDA 200C or 205C (1–2 weeks out)
Reason:
These levels sit directly in the positive GEX zone, where price often drifts upward in controlled channels.
Safer Play:
195/205 Call Debit Spread
Perfect for GEX-guided upside.
📌 Bearish Options Play (if NVDA breaks 185)
Buy:
NVDA 180P or 175P
Reason:
Once NVDA enters the negative GEX field, volatility expands downward and puts gain value quickly.
Safer Bearish Spread:
185/175 Put Debit Spread
📌 Neutral Play (if price stays stuck 188–196)
This is a premium-decay zone.
Sell Premium Strategy:
* Short Strangle
* Iron Condor
* Credit Spread
Neutral GEX = low volatility = high time decay.
My Thought
NVDA is sitting in one of the cleanest GEX compression structures we’ve seen all month. Price is wedged between a rising liquidity structure and a neutral gamma pocket that’s choking volatility.
This kind of setup usually leads to a single explosive move, not a slow grind.
The roadmap is simple:
* Above 195 → NVDA targets 202–210
* Below 185 → NVDA slides into negative gamma
* Inside 188–196 → chop and premium decay
The next breakout is going to be clean — and GEX is already showing where the path of least resistance lies.
This outlook is for educational purposes only and not financial advice. Always manage your risk and trade your plan.

NVDA Weekly Options SignalNVDA Weekly Options Analysis – 2025-11-12
Current Price: $192.38
Trend: Neutral (Weekly Momentum: Bearish -1.73%)
Confidence: 58% | Conviction: Low
Expiry: 2025-11-14 (2 days)
Recommended Strike: $192.50
Technical Overview:
Price in the middle of weekly range ($178.91–$200.05)
EMA alignment confirms bearish weekly trend
VWAP at $190.89 offers near-term support
Volume spike (26.4x previous week) indicates potential capitulation
Options Flow:
Extremely bullish, PCR 0.42 → heavy call buying
Max volume at $262 call shows institutional positioning
High gamma risk, volatility potential elevated
Trade Setup:
Direction: Buy Calls (Long)
Entry: $2.74
Target 1: $3.70 (+35%)
Target 2: $4.50 (+64%)
Stop Loss: $2.05 (-25%)
Position Size: 2% portfolio (Low conviction)
Summary Insight:
Katy AI shows neutral/bearish signals, but options flow suggests bullish institutional interest
High-risk, low-conviction setup; small position recommended
Mixed technicals and news sentiment → use tight risk management
⚠️ Risk Warning:
Conflicting signals → only small size recommended
Not financial advice; educational commentary for QS Premium members

NVIDIA – Best Buy of the Decade (4T Record but now resistance)🚀🔥 NVIDIA – Best Buy of the Decade Post #6
💡📉 Great but why am I taking half profits Today?
Back in July 2021, I named NVIDIA "The Best Buy of the Decade. " Today, it just hit a mind-blowing milestone — becoming the first company to reach a $4 trillion market cap. But here's the thing... that happened right at major resistance.
From our initial call in 2021 , to the target at $143.85 drawn via parabola in 2023, to the April 2025 re-entry at $95, it’s all on the chart — and it's been a textbook ride so far.
At the current level of $163.89, we’re pressing into serious overhead resistance. This doesn’t mean the story is over — not even close. But it could mean we take a breather before the next leg higher.
🧭 Targets ahead remain unchanged:
🔹 First stop: $182.85
🔹 Long-term vision: $227.41
What started as a bold macro call in 2021 has now become a multi-year thesis with precision updates along the way. This is post #6 in the NVIDIA journey — and if you scroll back through the chart, each piece has built on the last with clarity and conviction.
🎯 NVIDIA is not just a tech stock — it’s the AI backbone. But every cycle has pauses, and this one looks ready for a short rest before we see the next breakout.
Stay sharp, follow the structure, and honor the parabola.
One Love,
The FX PROFESSOR 💙
Additional info, for those who like to dive deeper into NVDA:
🔍 Technical Breakdown Version
For the chartists and structure followers, here’s the breakdown:
📌 2021: Original call — "Best Buy of the Decade"
📌 2023: First parabola plotted, projecting toward $143.85 — target hit precisely
📌 April 2025: Market offered $95 re-entry — second parabola begins
📌 Now: Price sits at $163.89, testing resistance from both structure and Fibonacci
📌 Next levels:
- $182.85 → Key extension level
- $227.41 → Long-term target based on full parabolic arc
Current structure suggests a possible pause before continuation. No need for panic — parabola remains valid unless structure is broken. Volume still supportive, and price action is following projection beautifully.
🧠 AI Macro Narrative Version
The big picture? NVIDIA isn't just another semi stock — it’s the nervous system of the AI revolution.
From gaming → crypto → AI, NVIDIA has consistently been first to adapt, and now it’s the leader in AI hardware infrastructure. The $4 trillion milestone is more than symbolic — it represents capital reallocation toward AI as the next dominant sector.
🧠 Key macro takeaways:
AI demand is insatiable
Data centers need NVIDIA
Generative AI isn't slowing down
Institutions are still buying — not selling
The resistance we see now isn’t weakness — it’s the market pausing to digest before another acceleration. Just like every past cycle... we ride, retrace, reload, and resume.
Disclosure: I am happy to be part of the Trade Nation's Influencer program and receive a monthly fee for using their TradingView charts in my analysis. Awesome broker, where the trader really comes first! 🌟🤝📈

nvidia is rangeThe inability of the price to break the 140 area and return to the 91 dollar area can be imagined in three scenarios:
1. The market will suffer in this area until the decision is reached
2. Breaking the 140 area and continuing the upward trend
3. Breaking the $75 support area and trying to reach the $53 area is out of the question at the moment.

Nvidia Stock Fails to Return to the $200 LevelAlthough Nvidia seemed poised to start the week with an optimistic bias, partly driven by the end of the U.S. government shutdown, which has generated a short-term confidence boost, the stock has begun to show a bearish tone in the current session, posting a decline of more than 2%. This weakness is mainly due to recent comments from the SoftBank Group, which sold its entire stake in Nvidia for approximately US$ 5.8 billion, raising concerns about a possible reduction in exposure to the semiconductor industry in the short term. This event has led to growing investor caution toward the stock and currently maintains a notable selling bias in the market.
Uptrend Tries to Hold
Despite recent downward corrections that have halted the stock’s steady advance, Nvidia has yet to show a decisive bearish move that would end the long-term uptrend line. In the broader picture, buying momentum continues to hold firm. However, if selling pressure continues to strengthen, the uptrend could be at risk, especially if the price falls below the 50-period moving average.
RSI
The RSI indicator line is gradually approaching the neutral level of 50, suggesting a balance between buying and selling forces over the last 14 trading sessions. As long as this equilibrium remains, the stock is likely to continue showing indecisive movements in the coming days.
TRIX
The TRIX indicator remains above the neutral level of 0, indicating that in the long-term outlook, bullish strength continues to dominate the average of exponential moving averages. As long as the TRIX stays above this level, the bullish bias may remain intact, allowing the uptrend line to continue defending its position over the coming weeks.
Key Levels to Watch:
208 USD – Major Resistance: Corresponds to the area of recent highs. Price movements breaking above this level could trigger stronger buying pressure, reinforcing the current uptrend.
200 USD – Nearby Resistance: A key psychological level. Price action above this zone would reactivate a short-term bullish bias and reduce the risk of a trendline breakdown.
184 USD – Key Support: This is the most relevant support area, coinciding with the 50-period moving average and the Ichimoku cloud, which increases its significance. Downward movements reaching this zone could end the long-term bullish structure and lead to a period of indecision or the formation of a short-term consolidation range.
Written by Julian Pineda, CFA, CMT – Market Analyst

Is SoftBank selling NVIDIA worrying you?Softbank has announced that it has pocketed all returns from their investment in NASDAQ:NVDA . I do not think this should concern anyone as it is logical to bank profits after a point where you want to redistribute cash. I do believe NVIDIA needs to take a small breath and might dip to $160 - $170 (near the gap it has created/ 1 x A Fib extension levels), as this will create some downward pressure to the already existing overvaluations. However, I think this is a setup to an amazing end of year rally.

Global Market Participants1. Introduction to Global Market Participants
Global market participants are entities that take part in international financial transactions. These include individual investors, institutional investors, corporations, governments, central banks, and intermediaries. Their activities impact the stability, efficiency, and development of the financial markets. The diversity among these participants ensures liquidity, facilitates price discovery, and contributes to economic growth by channeling funds from savers to borrowers worldwide.
2. Individual Investors
Individual investors, often called retail investors, are private persons who invest their own money in various financial assets such as stocks, bonds, mutual funds, or cryptocurrencies. Their primary goals are to grow wealth, earn income, and achieve financial security.
Key Characteristics:
Smaller investment amounts compared to institutions.
Focus on long-term capital appreciation or short-term trading profits.
Tend to rely on brokers, financial advisors, and digital trading platforms.
Role in the Market:
Retail investors enhance market liquidity and promote diversity in trading behaviors. With the rise of online trading platforms and fintech innovation, the participation of individuals in global markets has increased significantly. Social media and global connectivity now allow retail investors to influence markets, as seen during events like the 2021 “meme stock” phenomenon.
3. Institutional Investors
Institutional investors are large entities that pool money from clients or members and invest in financial markets to achieve specific objectives. They include pension funds, insurance companies, mutual funds, hedge funds, and sovereign wealth funds.
a. Pension Funds:
Pension funds invest the savings of employees to ensure financial security after retirement. They typically favor long-term, stable investments like bonds and blue-chip stocks.
b. Insurance Companies:
Insurance firms invest premiums collected from policyholders in relatively safe and income-generating assets to meet future claims.
c. Mutual Funds:
These funds pool money from numerous investors to invest in diversified portfolios of stocks, bonds, or other assets. They enable individuals to access professional management and diversification benefits.
d. Hedge Funds:
Hedge funds target high returns through aggressive strategies, including leverage, derivatives trading, and short-selling. They often cater to high-net-worth individuals and institutions.
e. Sovereign Wealth Funds (SWFs):
These are government-owned investment funds that manage national reserves, often derived from oil revenues or trade surpluses. Examples include Norway’s Government Pension Fund Global and Singapore’s GIC.
Impact on Global Markets:
Institutional investors dominate global capital flows and can significantly influence market trends. Their large-scale investments affect prices, volatility, and even government bond yields.
4. Corporations and Multinational Companies (MNCs)
Corporations participate in global financial markets for financing, investment, and risk management purposes.
Key Activities:
Raising Capital: Through issuing stocks or bonds to finance expansion.
Foreign Exchange Management: Engaging in currency markets to hedge exchange rate risks.
Mergers and Acquisitions: Companies use global capital markets to fund cross-border deals.
Example:
A U.S.-based company operating in Europe may use derivatives to hedge against euro-dollar exchange rate fluctuations. Multinational corporations also issue global or Eurobonds to attract international investors.
5. Governments
Governments are major players in global markets, primarily as issuers of sovereign debt and regulators of financial systems.
Roles:
Issuers of Government Bonds: To finance public spending and infrastructure projects.
Market Regulators: Setting and enforcing financial regulations to maintain transparency, stability, and investor confidence.
Participants in the Currency Market: Governments manage foreign exchange reserves to stabilize national currencies and support trade balances.
Example:
The U.S. Treasury issues bonds that serve as global benchmarks for risk-free assets, while developing nations issue sovereign debt to attract foreign capital.
6. Central Banks
Central banks, such as the U.S. Federal Reserve, the European Central Bank (ECB), and the Reserve Bank of India (RBI), are among the most influential market participants.
Key Functions:
Monetary Policy: Controlling money supply and interest rates to manage inflation and stimulate growth.
Foreign Exchange Operations: Buying and selling currencies to stabilize exchange rates.
Liquidity Provider: Acting as lenders of last resort to the banking system.
Central banks also influence global markets through quantitative easing, where they purchase government bonds to inject liquidity into the economy. Their decisions can trigger global reactions, affecting stock, bond, and currency markets worldwide.
7. Financial Intermediaries
Financial intermediaries connect savers with borrowers, facilitating the flow of funds across the economy. These include commercial banks, investment banks, brokers, and exchanges.
a. Commercial Banks:
Provide loans, accept deposits, and offer payment systems. They are key in credit creation and financial stability.
b. Investment Banks:
Help corporations and governments raise capital through underwriting securities and managing mergers and acquisitions.
c. Brokers and Dealers:
Act as agents for investors, executing trades and providing liquidity in financial markets.
d. Exchanges:
Stock and commodity exchanges provide regulated platforms for buying and selling financial instruments. Examples include the New York Stock Exchange (NYSE), London Stock Exchange (LSE), and the Bombay Stock Exchange (BSE).
8. Speculators and Traders
Speculators take on financial risk in the hope of profiting from price movements. While often viewed as risk-takers, they serve an important function by adding liquidity and aiding price discovery.
Types of Traders:
Day Traders: Engage in short-term trades for quick profits.
Arbitrageurs: Exploit price differences between markets or instruments.
Algorithmic Traders: Use computer programs to execute high-frequency trades.
Their activities ensure continuous market operation, even during volatile periods.
9. Credit Rating Agencies
Agencies such as Moody’s, Standard & Poor’s (S&P), and Fitch Ratings assess the creditworthiness of companies, governments, and financial instruments. Their ratings influence investor confidence, bond yields, and borrowing costs.
Role in Global Markets:
Facilitate informed investment decisions.
Help maintain transparency and discipline among borrowers.
Influence capital allocation by institutional investors.
However, rating agencies have faced criticism for conflicts of interest and their role in past financial crises, such as the 2008 global meltdown.
10. International Financial Institutions
Organizations such as the International Monetary Fund (IMF) and the World Bank play a stabilizing role in the global market.
The IMF:
Provides financial assistance to countries facing balance-of-payments crises and promotes exchange rate stability.
The World Bank:
Funds infrastructure and development projects in emerging economies to promote long-term economic growth.
Their involvement ensures global financial stability and supports developing nations in integrating into global markets.
11. Hedge Funds and Private Equity Firms
Hedge funds and private equity firms are specialized investment entities managing large pools of capital with flexible strategies.
Hedge Funds: Focus on generating high returns through trading and leverage.
Private Equity Firms: Invest directly in private companies or buy out public firms to restructure them.
They are crucial in improving corporate efficiency, promoting innovation, and influencing global capital allocation.
12. Conclusion
Global market participants collectively form the backbone of the world’s financial system. From individual investors to powerful institutions like central banks and sovereign wealth funds, each plays a unique role in shaping market behavior and economic outcomes. Their interactions drive capital flows, influence asset prices, and impact global growth and stability.
Understanding these participants helps explain how financial markets function and respond to economic, political, and technological changes. In an increasingly interconnected world, the balance between these entities determines the resilience and sustainability of the global financial ecosystem.
In essence, the global market is a dynamic arena where diverse participants—each with distinct motives and influences—interact to create a continuously evolving landscape of opportunity, competition, and innovation.
