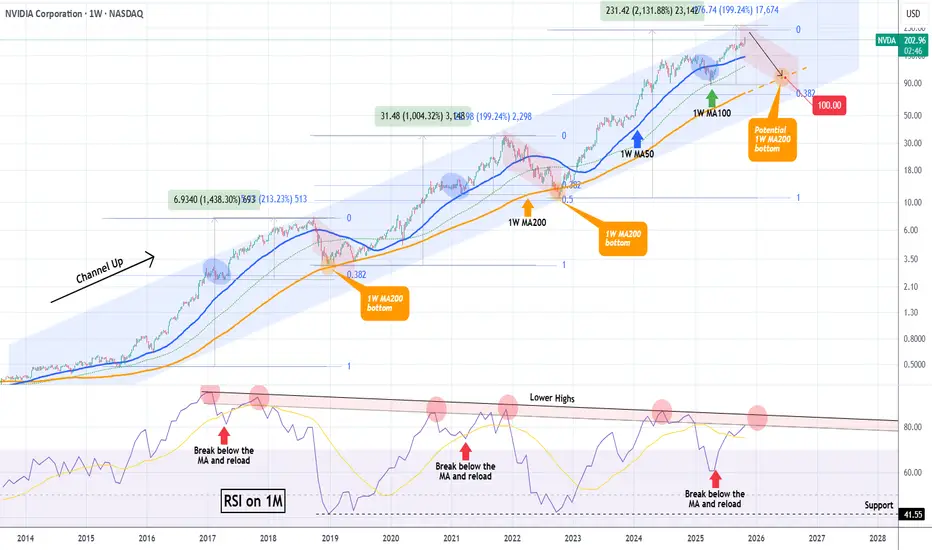
NVIDIA hit $5 Trillion but the end of the rally may be near.NVIDIA Corporation (NVDA) broke this week the $5 Trillion market cap barrier, becoming the first company to do so. In the meantime, it is extending the rally that started on the April 07 Low on the 1W MA100 (green trend-line), following the end of the Tariff War.
This rally has been nothing more than a part of the larger technical Bullish Leg inside the 10-year Channel Up that NVIDIA has been trading in. Within this pattern, the price has had rather asymmetric Bullish Legs in terms of rise % but has always been rejected at the top of the Channel Up and corrected back to the 1W MA200 (orange trend-line).
Following the mid-Bullish Leg corrections to the 1W MA50 (blue trend-line), the final rallies of the Bullish Legs before their Tops have been around +200%. Then their corrections/ Bearish Legs have always hit the 1W MA200 (as mentioned), with one time bottoming just above the 0.382 Fibonacci retracement level and the other below it (0.5 Fib).
We previously had NVIDIA's top at around $240, which is slightly below this expected +200% rise from the 1W MA100 bottom. As a result, we project that a potential contact with the 1W MA200 for the 2026 Bearish Leg can be achieved around $100, which is above the 0.382 Fib, similar to 2018.
Note that a very reliable Top indicator has also been the 1M RSI and its 9-year Lower Highs Zone. Every time the RSI entered the Zone and then broke below its MA (yellow trend-line) and rebounded, the next hit was the Bullish Leg's Top. Right now the 1M RSI is about to enter this Zone for the second time, indicating that we may be approaching the end of this long-term rally.
-------------------------------------------------------------------------------
** Please LIKE 👍, FOLLOW ✅, SHARE 🙌 and COMMENT ✍ if you enjoy this idea! Also share your ideas and charts in the comments section below! This is best way to keep it relevant, support us, keep the content here free and allow the idea to reach as many people as possible. **
-------------------------------------------------------------------------------
💸💸💸💸💸💸
👇 👇 👇 👇 👇 👇
Trade ideas
$NVDA NVIDIA CORPORATIONExecutive Summary:
NVIDIA Corporation ( NASDAQ:NVDA ) has demonstrated remarkable resilience and sustained growth over multiple market cycles, consistently defending its leadership position despite intense competition within the semiconductor and AI sectors. This analysis outlines a structured, multi-layered support framework derived from Fibonacci retracement theory, which identifies strategic price levels for potential entry. Our primary area of interest converges around the $150.00 psychological level, which aligns with a key Fibonacci midpoint and is anticipated to serve as a robust zone for buyer participation.
Detailed Technical Framework:
1. A History of Defending Its Turf:
NVDA's impressive performance is not merely a function of bullish markets but a testament to its fundamental dominance, particularly in the parallel processing and AI revolutions. The company has repeatedly validated its market strength by navigating competitive threats and leveraging its technological moat, which in turn has created a foundation of strong investor confidence. This fundamental strength is often mirrored in its technical charts, where pullbacks are frequently met with aggressive buying at key value areas.
2. The Fibonacci Support Ladder: A Tiered Defense System
By applying Fibonacci retracement levels to a significant prior upward swing, we can map a hierarchy of potential support zones. These levels do not operate in isolation but represent a cascading series of defenses where buyers have historically stepped in. Our analysis identifies the following critical tiers, from shallowest to deepest:
First Line of Defense (Shallow Pullback):
23.6% Level ($182.53): This level represents a mild, healthy pullback. A hold here would signify exceptionally strong momentum and would likely be a continuation pattern rather than a deep correction.
Secondary Support Zone (Moderate Correction):
38.2% Level ($164.02): A retracement to this level indicates a more pronounced correction but remains within the bounds of a strong uptrend. This is a common level for institutions to begin accumulating positions.
50.0% Level ($149.39): The halfway point of the prior major move is a critical psychological and technical battleground. A successful bounce from this level suggests the overall bull trend remains intact and that market sentiment has found a balance.
Tertiary & Deep Value Zones (Significant Correction):
61.8% Level ($134.58): Known as the "Golden Ratio," this is a deep retracement that often holds in volatile but fundamentally sound assets. A test of this level would indicate a major correction is underway, presenting a higher-risk but potentially high-reward entry point for long-term believers.
78.6% Level ($113.49): This is a deep, rarely-tested retracement level. A move to this zone would signal a severe market downturn or a fundamental reassessment of the stock, but it would also represent a potentially profound long-term value opportunity.
The Ultimate Major Support:
The $100.00 Psychological Level: Beyond the Fibonacci structure, the triple-digit benchmark at $100.00 stands as a monumental psychological and technical support. It represents a round number that often attracts immense buying interest and would be considered a "line in the sand" for the long-term thesis.
3. Primary Strategic Interest & Risk Management:
While the Fibonacci ladder provides multiple potential entry points, our primary area of strategic interest converges around the $150.00 level. This is not a single price point but a zone encompassing the 50% Fibonacci level at $149.39. The rationale for favoring this zone is twofold:
Technical Significance: It is a classic "value area" in a strong trend, offering a favorable balance of potential upside and managed risk.
Psychological Strength: The $150 level is a major round number that is easy for the market to identify and act upon.
A decisive reversal at or near this $150 zone, confirmed by bullish price action (e.g., hammer candlesticks, increased volume on up-days), would provide a strong signal for capital deployment. As with any investment, this thesis requires disciplined risk management; a sustained break below the deeper supports, particularly the $134.58 (61.8%) level, would necessitate a re-evaluation of the near-term bullish outlook.

Nvidia Stock Fails to Return to the $200 LevelAlthough Nvidia seemed poised to start the week with an optimistic bias, partly driven by the end of the U.S. government shutdown, which has generated a short-term confidence boost, the stock has begun to show a bearish tone in the current session, posting a decline of more than 2%. This weakness is mainly due to recent comments from the SoftBank Group, which sold its entire stake in Nvidia for approximately US$ 5.8 billion, raising concerns about a possible reduction in exposure to the semiconductor industry in the short term. This event has led to growing investor caution toward the stock and currently maintains a notable selling bias in the market.
Uptrend Tries to Hold
Despite recent downward corrections that have halted the stock’s steady advance, Nvidia has yet to show a decisive bearish move that would end the long-term uptrend line. In the broader picture, buying momentum continues to hold firm. However, if selling pressure continues to strengthen, the uptrend could be at risk, especially if the price falls below the 50-period moving average.
RSI
The RSI indicator line is gradually approaching the neutral level of 50, suggesting a balance between buying and selling forces over the last 14 trading sessions. As long as this equilibrium remains, the stock is likely to continue showing indecisive movements in the coming days.
TRIX
The TRIX indicator remains above the neutral level of 0, indicating that in the long-term outlook, bullish strength continues to dominate the average of exponential moving averages. As long as the TRIX stays above this level, the bullish bias may remain intact, allowing the uptrend line to continue defending its position over the coming weeks.
Key Levels to Watch:
208 USD – Major Resistance: Corresponds to the area of recent highs. Price movements breaking above this level could trigger stronger buying pressure, reinforcing the current uptrend.
200 USD – Nearby Resistance: A key psychological level. Price action above this zone would reactivate a short-term bullish bias and reduce the risk of a trendline breakdown.
184 USD – Key Support: This is the most relevant support area, coinciding with the 50-period moving average and the Ichimoku cloud, which increases its significance. Downward movements reaching this zone could end the long-term bullish structure and lead to a period of indecision or the formation of a short-term consolidation range.
Written by Julian Pineda, CFA, CMT – Market Analyst

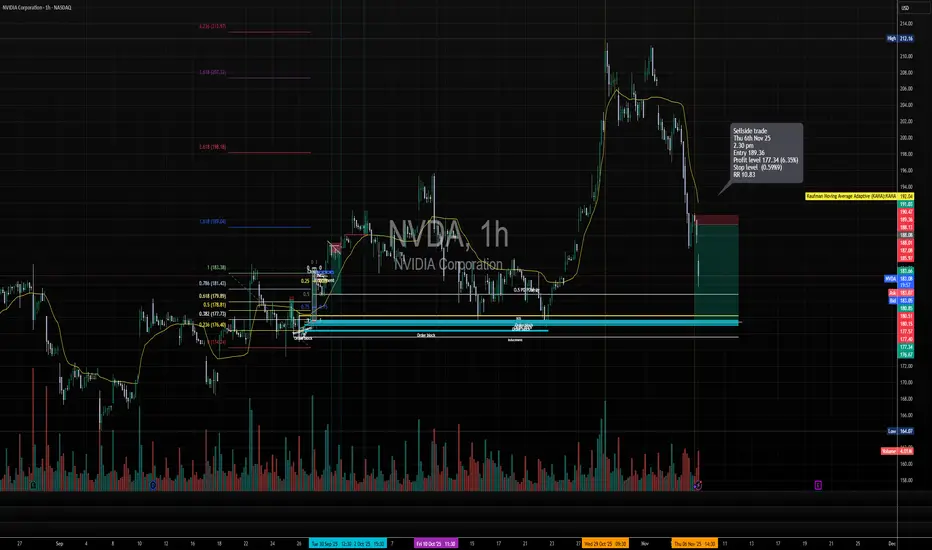
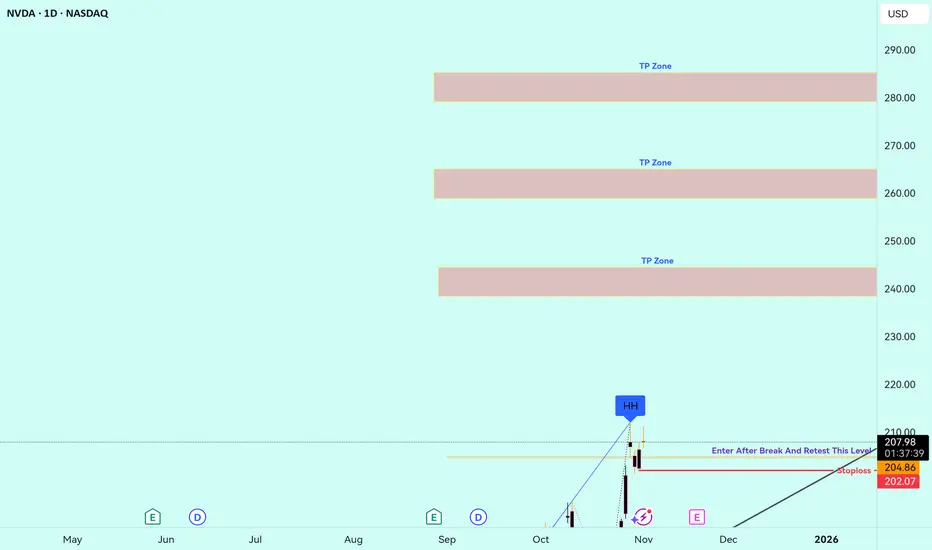
Short trade 📘 Trade Summary
Pair: NVDA (NASDAQ)
Direction: Sell-side Trade
Date: Thu 6 Nov 25
Time: 2:30 pm
Entry: 189.36
Profit Level: 177.34 (+6.35%)
Stop Level: 189.99 (–0.59%)
Risk-Reward (RR): 10.83
🧩 Technical Context
Price Structure: Market rejected near the previous swing high (~$197–$200 region) after failing to sustain above the 1.618 extension level.
Fibonacci Context: Retracement zones from 0.382 – 0.786 aligned with prior accumulation zones, showing resistance at 0.618 (≈ 179.89) and 0.786 (≈ 181.43).
Order Block Alignment: Two visible order blocks (highlighted in blue) show prior demand zones — price is expected to retrace into these for potential take-profit liquidity.
Volume Spike: Noticeable volume at the rejection candle near $190–$191 indicates institutional sell orders stepping in.
EMA Context: Price fell below the Kaufman Adaptive Moving Average (KAMA), confirming a short-term shift to bearish momentum.
🧠 Trade Narrative
This short setup capitalises on:
A failed breakout at the prior liquidity high (~$197),
Break of structure (BOS) confirming downside shift, and
Entry at the retest of a supply zone near $189.
Targeting liquidity sweep of prior accumulation zone around $177, where confluence with the lower order block exists.
NVDA-Bulls Defend Trendline Into Gamma Week (Nov. 3–7)NVDA Weekly Squeeze Setup 🔥
WEEKLY TIMEFRAME ANALYSIS
1. Market Structure
NVDA remains in a strong macro uptrend on the weekly. Recent BOS confirmations to the upside are intact, and the latest pullback retested the long-term ascending trendline perfectly. We’ve seen a subtle CHoCH attempt in prior weeks, but buyers stepped in aggressively on structure breaks. Liquidity remains stacked below around $153–$160, and smart money continues defending dips rather than chasing breakouts — a healthy sign of accumulation rather than distribution.
2. Supply & Demand / Order Blocks
There’s a key demand pocket sitting around $180–$190 from previous imbalance fills. The closest unmitigated bullish order block lives near $153 — that’s the nuclear level if we ever wash out. On the supply side, overhead inefficiency spans between $220–$230, where sellers historically rotate in. If price pushes into that region with thin volume, expect reactions.
3. Indicator Confluence
The 9EMA remains firmly above the 21EMA with a positive slope, confirming trend continuation. MACD histogram is still green, though showing early signs of momentum slowing — not reversal. RSI is elevated, but not at exhaustion levels. Weekly volume looks constructive; we’re not seeing blow-off distribution.
4. Weekly Tone
As long as NVDA stays above the weekly trendline near $195, bulls maintain control. Break below that, and things could get uncomfortable fast. The structure favors continuation, but expect profit-taking wicks.
DAILY TIMEFRAME ANALYSIS
1. Market Structure
Daily structure flipped bullish after a clean BOS from the prior swing high. The recent pullback respected support at $195.62 and reclaimed structure. Liquidity is still stacked at $190 and $184 — levels shorts would love to hunt. Smart money tends to dip price into these zones before running it into fresh highs.
2. Supply & Demand / Order Blocks
There’s a visible demand block at $184–$190 that has been tapped, but not fully mitigated. Supply overhead sits around $212–$217, which aligns with prior liquidity sweeps. If price pushes into that band with increasing volume, we could see continuation; otherwise, emotional wicks can form.
3. Indicator Confluence
9EMA curling sharply upward over the 21EMA — textbook bullish engine. MACD histogram shows expansion but with minor slowing bars; keep an eye on that slope. RSI remains healthy around mid–upper band, signaling momentum not overheated. Volume expansion shows the buyers aren’t exhausted yet.
4. Daily Tone
Bulls want to keep price above $200 to avoid gamma pressure on the downside. Below $198, we start inviting liquidity hunts.
15–MINUTE INTRADAY STRUCTURE
1. Market Structure
Short-term structure on 15m printed a CHoCH followed by BOS continuation into the closing session. We now have a small wedge structure forming just above intraday liquidity around $202.08–$202.36. If bulls defend these micro OBs, we can see a morning leg up.
Weak hands got shaken near $201, and smart money collected stops. Classic intraday accumulation profile.
2. Supply & Demand / Order Blocks
Demand sits at:
• $202.30–$202.60
• $201.80–$202.10
Below that? $199–$200 is the bigger reload pocket.
Supply zones to watch:
• $204.75–$205.10
• $207.90–$208.20
Everything in between is chop bait.
3. Indicator Confluence
9EMA trying to curl back up toward 21EMA. MACD histogram contracting to flat — sign of potential inflection. RSI pushing toward mid-band, which usually favors a scalp bounce early session if defended.
4. Intraday Tone
Expect a morning decision candle. If bulls can take $204.75 clean, we likely rotate into the $207 liquidity pocket.
GEX (Gamma Exposure) & OPTIONS SENTIMENT
Options flow favors call-side interest, with meaningful call walls stacked at:
• $210
• $217.5
• $220
Gamma walls often behave like magnets when price gets within 1–2%.
Noteworthy negative gamma sits lower at:
• $179–$180
If NVDA ever flushes below $195, dealers must hedge into downside momentum — accelerating moves. Conversely, above $205, dealer hedging acts as fuel for upside squeezes.
Max pain appears around $200 — this explains why price has gravitated around this area into the weekend.
How to use this:
• Above $205 → scalp continuation long into $207–$210.
• Below $200 → volatility spikes, favor puts.
Expect volatility compression between $200–$205 early week, then a directional release.
TRADE SCENARIOS (Nov. 3–7)
✅ Bullish Setup
Trigger: Break and hold above $204.75
Entry: Retest of $204.40–$204.60
Targets: $207.80 → $210 → potential wick into $217
Stop: Below $202.50
Invalidation: 15m CHoCH to downside at $202.10.
✅ Bearish Setup
Trigger: Break below $200 with heavy volume
Entry: Retest of $200–$200.30
Targets: $195.60 → $190 liquidity sweep
Stop: Above $202.50
Invalidation: reclaim of $204.75.
CLOSING OUTLOOK
This week sets up like a controlled grind with pockets of volatility. If bulls defend $200–$202 early, it can ignite a squeeze toward $210 and possibly tap the $217 gamma pocket. Failure at $200, especially with broad market weakness, flips this into a liquidity hunt down to $190.
Personally, I’m watching for liquidity traps around $202 early week — if I see absorption, I’ll lean long into call walls. But if we reject from $204.75 again with declining volume, expect a fast unwind.
DISCLAIMER
This analysis is for educational purposes only and does not constitute financial advice. Always manage risk and trade based on your own plan.
Is SoftBank selling NVIDIA worrying you?Softbank has announced that it has pocketed all returns from their investment in NASDAQ:NVDA . I do not think this should concern anyone as it is logical to bank profits after a point where you want to redistribute cash. I do believe NVIDIA needs to take a small breath and might dip to $160 - $170 (near the gap it has created/ 1 x A Fib extension levels), as this will create some downward pressure to the already existing overvaluations. However, I think this is a setup to an amazing end of year rally.

I Future on Sale — Buying Nvidia Amid Trade War FearsI just bought NVDA Jan 2026 185 Call @ $16
I trust top macro analysts calling for strong Q4 ’25 and Q1 ’26.
Chips will likely get tariff exceptions.

$NVDA retracement Anticipating a retracement on NASDAQ:NVDA to 180 area with the lack of government funding and no crypto solution to the financial monetary system of the world. Nov 5th catalyst to larger drop for the broader market AMEX:SPY NASDAQ:QQQ and NASDAQ:NVDA

NVIDIA At New HighsNvidia is making more upside this week, now trading above the 200 level on optimism that the US and China could reach a tariff deal. From an Elliott Wave perspective, the stock still appears to be in wave five, with an extended higher-degree black wave three now approaching its first resistance around the 38.2% projection. If risk-on sentiment continues, the price may even retest the upper side of the Elliott Wave channel near the 230 area. This suggests that Nvidia could be entering an important zone where the higher-degree black wave three might complete, followed later by a deeper fourth-wave retracement before more upside resumes. So, I would stay patient and watch for a possible dip toward the 164–185 area once wave four begins.
Highlights:
Trend: Ongoing uptrend; wave five still in progress
Potential: Reaching 230 resistance before wave four pullback
Support: 164–185 zone
Invalidation: Below 164
Note: Watch for signs of exhaustion near 230; next deep could offer new opportunity

Nvidia Daily Outlook!NVDA is in an uptrend! Those who are already holding the stock can use $200 as a stop loss for short-term traders. Long-term traders can use $176 as a stop loss if the price falls below $176, it breaks below the short-term channel, which could push the price down first to the 200-day EMA(156.50$) and then to the horizontal support around $150.
For those looking to make additional or new entries, they should wait for $183 and place a stop loss just below that level.
I can’t predict whether it will go up or down I’m not a fortune teller :)) but this is what the technical analysis suggests.
Good luck and profitable trades! This is not financial advice.

NVDA Bull Flag: Breakout Toward 220–230NVDA’s 1D chart remains firmly bullish. Price cleared the ~$195 “BOS” and pushed to fresh highs above $205, with MA20 > MA60 > MA120 and widening bands supporting momentum. The near-term map is clear: Demand sits around $183 (former ceiling turned floor), while supply is forming at the new swing high near $209.50.
Primary path: I’m looking for continuation on strength. A daily close above 209.50 would confirm buyers in control and opens room toward 220–225, with a stretch scope to 230 if momentum persists. If price hesitates first, a constructive retest of 195–198 (prior breakout area) can serve as the higher-low buy zone—especially if volume firms and intraday closes reclaim $200–203 quickly.
Alternative: Failure to hold recent gains brings a deeper check. A daily close below 203.00 risks a slide toward the $200 psych handle and then $195–198. The broader bullish thesis is invalidated on a decisive daily close below 183.00, which would mark a clear break of structure and shift the bias back to neutral/bearish until reclaimed.
Triggers to watch: daily close > 209.50 for continuation; weakness below 203.00 for a corrective leg. Manage entries around 195–198 or on strength through 209.50, and keep risk tight relative to 203/183 lines. This is a study, not financial advice. Manage risk and invalidations.

NVIDIA currently at resistance.NVIDIA found resistance at the horizontal level and could be stuck for a while. If it may break then we will se a HUGGEE rise to the next arc.
Both are fine by me

Regional Growth Strategies in the Global Market1. Understanding Regional Growth Strategies
A regional growth strategy is a structured plan that focuses on expanding a company’s presence and market share within a specific geographic area—such as Asia-Pacific, Europe, Latin America, or Africa—rather than globally all at once. The strategy involves understanding local consumer behavior, economic conditions, legal frameworks, and cultural norms to align business goals with regional opportunities.
For example, a multinational company might apply different strategies in North America and Southeast Asia, depending on the maturity of markets, consumer preferences, and economic development levels. Regional strategies often integrate global goals with local execution—creating a balance between standardization and localization.
2. Importance of Regional Growth in the Global Market
Global markets are not uniform. Every region has unique growth potential and challenges. Companies that focus on regional strategies gain several advantages:
Market Diversification: Expanding regionally helps reduce dependence on a single country or market. For instance, if a business faces a slowdown in Europe, strong demand in Asia can balance overall performance.
Adaptation to Local Needs: Regional strategies allow businesses to adapt their offerings to local cultures, tastes, and regulations, increasing acceptance and customer loyalty.
Cost Efficiency and Supply Chain Optimization: Regional production hubs can reduce logistics costs and improve efficiency. For instance, companies may set up manufacturing in Southeast Asia to serve Asia-Pacific markets.
Regulatory Compliance: Understanding and aligning with local rules and trade policies help avoid legal risks and penalties.
Competitive Advantage: A company that understands local consumer behavior and cultural nuances gains an edge over global rivals that use one-size-fits-all approaches.
Thus, regional growth strategies are not just about expansion—they are about sustainable adaptation and long-term competitiveness.
3. Core Elements of a Regional Growth Strategy
A well-structured regional growth plan typically involves several interconnected components:
a. Market Research and Segmentation
Understanding the market is the first step. Businesses analyze demographic trends, purchasing power, consumer behavior, and local competitors. For example, companies entering India must understand price sensitivity and the growing demand for value-for-money products.
b. Localization of Products and Services
Localization goes beyond language translation. It involves adapting products to suit regional preferences. For instance, McDonald’s offers McSpicy Paneer burgers in India and Teriyaki burgers in Japan, catering to local tastes.
c. Strategic Partnerships and Alliances
Local partnerships—such as joint ventures or distribution alliances—help global firms navigate regulatory and cultural complexities. Partnerships also provide access to established networks and regional expertise.
d. Supply Chain and Infrastructure Development
Building regional supply chains ensures faster delivery and lower costs. For instance, automobile companies often establish regional assembly plants to meet local demand efficiently.
e. Branding and Marketing Adaptation
Marketing strategies should reflect regional culture, values, and communication styles. For example, Coca-Cola’s campaigns in Asia often emphasize community and celebration, aligning with cultural values.
f. Regulatory and Policy Alignment
Businesses must understand trade laws, tariffs, and regional trade agreements like ASEAN, EU, or NAFTA (now USMCA). Complying with local policies is key to smooth operations.
4. Types of Regional Growth Strategies
Different approaches are used depending on company goals, market maturity, and competition levels:
a. Market Penetration Strategy
Focusing on increasing market share within an existing regional market through pricing strategies, promotions, or better customer service.
b. Market Development Strategy
Introducing existing products into new regional markets. For instance, a European skincare brand entering Middle Eastern markets.
c. Product Development Strategy
Developing new or modified products to fit regional needs. For example, Samsung designs region-specific smartphone models based on network availability and local preferences.
d. Diversification Strategy
Entering new regions with entirely new products or services. This approach is riskier but can lead to higher rewards in emerging markets.
e. Regional Hub Strategy
Establishing a key operational hub (for example, Singapore for Southeast Asia or Dubai for the Middle East) to coordinate and manage operations across multiple countries.
5. Challenges in Implementing Regional Growth Strategies
While regional expansion offers great potential, it also presents significant challenges:
Cultural Barriers: Misunderstanding local customs and consumer behavior can lead to marketing failures or brand rejection.
Regulatory Complexity: Each country has its own laws, tax systems, and labor regulations that complicate operations.
Political Instability: In some regions, political changes or conflicts can disrupt business continuity.
Infrastructure Gaps: Emerging regions may lack efficient transportation or technology infrastructure, affecting supply chains.
Currency and Economic Risks: Fluctuations in exchange rates and inflation can affect profitability.
Talent Management: Recruiting and retaining skilled employees with regional expertise can be difficult.
Successful firms must anticipate and manage these risks through careful planning and local engagement.
6. Successful Examples of Regional Growth
Apple in China and India
Apple has strategically localized its regional operations in Asia. It opened retail stores in major Indian cities, offered region-specific financing options, and even began assembling iPhones locally to reduce import taxes. This regional approach improved affordability and expanded market reach.
Toyota in North America
Toyota localized production in the United States and Canada, adapting car designs to local preferences and regulatory standards. This reduced costs and built a strong regional brand image.
Netflix in Latin America and Asia
Netflix produces regional content like Korean dramas and Indian web series, reflecting cultural preferences and expanding its subscriber base. This localization has been key to its global dominance.
7. The Role of Digital Transformation in Regional Growth
Technology plays a vital role in modern regional strategies. Digital platforms enable companies to understand consumer data, predict trends, and market products regionally.
E-commerce platforms like Amazon or Alibaba use data analytics to tailor regional offers.
Social media marketing allows precise targeting of regional audiences.
Digital payment systems and mobile apps make products accessible in regions with developing banking systems.
The integration of technology allows companies to achieve scalable, efficient, and localized growth.
8. Future Outlook for Regional Strategies
As global markets become more interconnected yet regionally diverse, companies will increasingly adopt “glocalization”—thinking globally but acting locally. Regional trade blocs, sustainability goals, and digital ecosystems will shape the next phase of growth.
Businesses that blend global expertise with regional sensitivity will thrive in this evolving landscape. Emerging markets in Asia, Africa, and Latin America will continue to offer high-growth potential, while digital tools will make regional adaptation faster and smarter.
Conclusion
Regional growth strategies are at the heart of global business success. They enable companies to bridge the gap between global ambitions and local realities by understanding regional diversity and adapting operations accordingly. Through careful research, localization, partnerships, and technological integration, businesses can capture regional opportunities and build long-term competitiveness. While challenges exist—from cultural barriers to regulatory complexity—firms that master regional strategies not only expand their market reach but also create stronger, more resilient global brands.

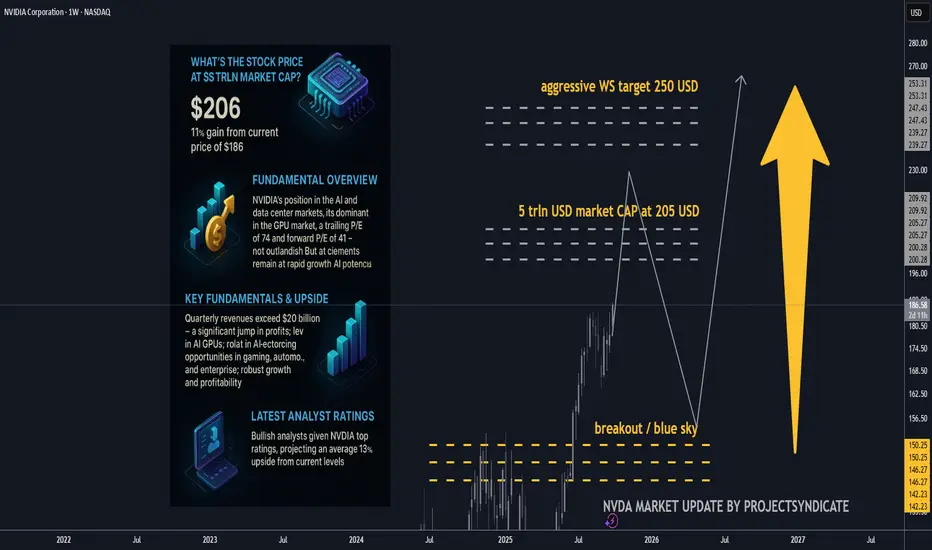
NVDA 5 trln USD market cap up next? Key fundamentals and upside.Is $5T reasonable for NVDA?
• Mechanically, yes: The market only needs ~10% near-term appreciation from today’s levels to print $5T. That’s within one strong quarter or a guidance beat.
• Fundamentally, the math works if (a) FY26–27 revenue tracks the guide/Street trajectory (TTM already $165B with Q3 guide $54B), (b) non-GAAP GMs hover low-to-mid-70s, and (c) opex discipline holds. Under those, forward EPS path supports ~35× at $5T, a premium but not outlandish for a category-defining compute platform.
• Free-cash optionality: With ~$48B net cash and massive FCF, NVDA can keep funding buybacks (already $60B fresh authorization) and capacity, smoothing cycles.
________________________________________
• Stock price at $5T market cap: ≈ $205.8 per share (on ~24.3B shares).
• Gain needed from $186.6: +$19.2 (~+10.3%).
The quick math (market cap ⇒ price)
• Shares outstanding (basic): ~24.3 B (as of Aug 22, 2025, per 10-Q).
• Stock @ $5T market cap: $5,000,000,000,000 ÷ 24.3B ≈ $205.8/share.
• From today’s price $186.6: needs +$19.2 or ~+10.3%.
That also implies P/E (TTM) at $5T of roughly ~56× (using TTM EPS ~3.68). Today’s trailing P/E is ~50–53× depending on feed.
________________________________________
Core fundamentals snapshot 🧩
Latest quarter (Q2 FY26, reported Aug 27, 2025)
• Revenue: $46.7B (+56% y/y; +6% q/q).
• Data Center revenue: $41.1B (+56% y/y).
• GAAP gross margin: 72.4%; non-GAAP 72.7%; Q3 guide ~73.3–73.5%.
• GAAP EPS: $1.08 (non-GAAP: $1.05; excl. $180M inventory release: $1.04).
TTM scale & profitability
• Revenue (TTM): ~$165.2B.
• Net income (TTM): ~$86.6B.
• Diluted EPS (TTM): ~$3.5–3.7.
• Cash & marketable securities: $56.8B; debt: ~$8.5–10.6B ⇒ net cash ≈ $48B.
Capital returns
• $24.3B returned in 1H FY26; new $60B buyback authorization (no expiration). Remaining buyback capacity ~$71B as of Aug 26.
________________________________________
Valuation read (today vs. $5T)
Using widely watched metrics:
• P/E (TTM): ~50–53× today; at $5T it rises to ~56× (assuming flat TTM EPS).
• Forward P/E: Street FY27 EPS ≈ $5.91 → ~31–33× today; ~35× at $5T — still below many AI hyper-growth narratives that trade at 40–50× forward when growth visibility is high.
• EV/EBITDA (TTM): EV ≈ market cap – net cash. Today EV ~$4.45T; EBITDA TTM ≈ $98–103B ⇒ EV/EBITDA ~43–45×; at $5T EV/EBITDA drifts to ~48–50×.
• P/S (TTM): ~27× today (at $4.5T) and ~30× at $5T on $165.2B TTM revenue.
• FCF yield: TTM FCF range $60.9–72.0B ⇒ ~1.35–1.60% today; ~1.22–1.44% at $5T.
Takeaway: $5T doesn’t require a heroic repricing — it’s ~10% above spot and implies ~35× forward earnings if consensus holds. That’s rich vs. the S&P (~22.5× forward) but arguably reasonable given NVDA’s growth, margins, and quasi-platform status in AI compute.
________________________________________
What must be true to justify $5T (and beyond) ✅
1. AI capex “supercycle” persists/expands. Citi now models $490B hyperscaler AI capex in 2026 (up from $420B) and trillions through 2029–30. A sustained 40–50% NVDA wallet share across compute+networking underwrites revenue momentum and margin sustainment.
2. Annual product cadence holds. Blackwell today → Rubin in 2026 with higher power & bandwidth, widening the perf gap vs. AMD MI450 — supports pricing power and mix.
3. Margins stay “mid-70s” non-GAAP. Company guides ~73.3–73.5% near term; sustaining 70%+ through transitions offsets any unit price compression.
4. Networking, software & systems scale. NVLink/Spectrum, NVL systems and CUDA/Enterprise subscriptions deepen the moat and smooth cyclicality; attach expands TAM (improves EV/EBITDA vs. pure-GPU lens).
5. China/export workarounds do not derail mix. Q2 had no H20 China sales; guidance and commentary frame this as manageable with non-China demand and limited H20 redirection.
________________________________________
A contrarian check (where the model could break) 🧨
• Power & grid bottlenecks. Even bulls (Citi) note AI buildouts imply tens of GW of incremental power; slippage in datacenter electrification can defer GPU racks, elongating deployments (and revenue recognition).
• Debt-funded AI spend. Rising share of AI DC capex is being levered (Oracle’s $18B bonds; neoclouds borrowing against NVDA GPUs). If credit windows tighten, orders could wobble.
• Customer consolidation & vertical ASICs. Hyperscalers iterating custom silicon could cap NVDA’s mix/price in some workloads; edge inference may fragment.
• China policy volatility. Export rules already forced product pivots; rebounds are uncertain and not fully in NVDA’s control.
• Multiple risk. At ~50× TTM and >40× EV/EBITDA, any growth decel (unit or pricing) can de-rate the multiple faster than earnings make up the gap.
Bottom line of the bear case: If AI capex normalizes faster (say +10–15% CAGR instead of +25–35%), forward EPS still grows, but the stock would likely need multiple compression (toward ~25–30× forward), making $5T less sticky near-term.
________________________________________
Street positioning (latest bullish calls) 📣
• KeyBanc: $250 (Overweight) — Rubin cycle deepens moat → ~+34% implied upside.
• Barclays: $240 (Overweight) — AI infra wave; higher multiple to 35×. ~+29% upside.
• Bank of America: $235 (Buy). ~+26% upside.
• Bernstein: $225 (Outperform). ~+21% upside.
• Citi: $210 (Buy) — reiterates annual cadence & rising AI capex.
• Morgan Stanley: $206–210 (Overweight). ~+11–13% upside; 33× CY25 EPS framework.
• Consensus: Avg 12-mo PT ~$211, ~+13% from here.
________________________________________
________________________________________
Extra color you can trade on 🎯
• Where bulls may be too conservative:
o Networking/NVLink attach could outgrow GPUs as Blackwell/Rubin systems standardize on NVIDIA fabric, defending blended margins longer.
o Software monetization (CUDA ecosystem, NIMs, enterprise inference toolchains) is still under-modeled in many sell-side DCFs.
• Where bulls may be too aggressive:
o China rebound timing & magnitude.
o Power/real-estate constraints delaying deployments into 2026.
o Credit-driven AI capex — watch for any signs of tightening in private credit / neocloud financing that uses GPUs as collateral.
________________________________________
________________________________________
Sources: NVIDIA IR & 10-Q; Yahoo Finance stats; StockAnalysis (TTM financials); company Q2 FY26 press release and CFO commentary; recent analyst notes from KeyBanc, Citi, Barclays, BofA, Morgan Stanley; financial media coverage (WSJ/FT).
NVIDIA (NVDA) – Technical Outlook & Market InsightsDescription:
NVIDIA Corporation (NASDAQ: NVDA) remains one of the most influential players in the AI and semiconductor sector, driving innovation across GPU, data center, and AI infrastructure markets. Despite short-term volatility, NVDA continues to attract institutional interest due to strong fundamentals, revenue growth, and leadership in AI-driven technology.
In this analysis, I highlight key support and resistance levels, momentum shifts, and possible breakout zones based on price structure, RSI behavior, and volume confirmation. The chart focuses on identifying potential continuation or correction phases aligned with broader market sentiment.
📊 Key focus: Price action, RSI divergence, and volume dynamics
💡 Sector: Semiconductors / Artificial Intelligence / Tech Growth
💼 Ticker: NASDAQ:NVDA | Exchange: NASDAQ
⚠️ Disclaimer: This is not financial advice. The content is for educational and informational purposes only. Always do your own research before making any investment or trading decision.
#NVIDIA #NVDA #StockMarket #AI #Semiconductors #TradingView #TechnicalAnalysis #PriceAction #Investing #ChartAnalysis #RSI #NASDAQ #MomentumTrading #SwingTrading
$NVDA Tradespoon – Long Entry $205.93Tradespoon model issued a long signal for NASDAQ:NVDA . Predicted range: $199.21–$209.01. Trend: +0.36%. NASDAQ:NVDA

NVDA Bullish Breakout: Retest or Close Above 212.19 Toward 225NVDA’s daily chart remains firmly bullish after a clean breakout from a multi-month rectangle. Price is riding a MA20 > MA60 > MA120 stack, Bollinger Bands are expanding, and MACD momentum has flipped higher. The last close near $207.04 came on strong breadth, keeping buyers in control while price consolidates just under the recent high.
Primary path: look for a controlled pullback into the former ceiling at $198.00–$202.00 to act as demand. A constructive reaction there keeps the breakout intact and favors a grind into $210–$215 first, with the measured move pointing toward $225 as momentum persists. Alternatively, strength can skip the retest— a decisive daily close above $212.19 would confirm continuation and unlock the same upside roadmap.
Invalidation sits below the range top: a daily close back under $195.00 would negate the breakout and re-open downside toward the prior consolidation zone, with risk of a slide toward the $188 area if sellers press. Until then, the bias stays bullish with $198.00–$202.00 as the key line in the sand and $212.19 the trigger for fresh highs.
This is a study, not financial advice. Manage risk and invalidations

NVDA Wave Analysis – 29 October 2025- NVDA opened with the upward gap
- Likely to rise to resistance level 215.00
NVDA stock opened today with the sharp upward gap, which follows the earlier breakout of the resistance zone between the resistance levels 193.75 and 200.00.
The breakout of the these resistance levels accelerated the active impulse wave iii of the extended intermediate impulse sequence 5 from April
Given the overriding daily uptrend, NVDA can be expected to rise to the next resistance level 215.00 (target price for the completion of the active impulse wave iii).

Michael Burry is right about $NVDANASDAQ:NVDA , Michael Burry is also right about NVIDIA.
Expect something like this:

NVIDIA – Best Buy of the Decade (4T Record but now resistance)🚀🔥 NVIDIA – Best Buy of the Decade Post #6
💡📉 Great but why am I taking half profits Today?
Back in July 2021, I named NVIDIA "The Best Buy of the Decade. " Today, it just hit a mind-blowing milestone — becoming the first company to reach a $4 trillion market cap. But here's the thing... that happened right at major resistance.
From our initial call in 2021 , to the target at $143.85 drawn via parabola in 2023, to the April 2025 re-entry at $95, it’s all on the chart — and it's been a textbook ride so far.
At the current level of $163.89, we’re pressing into serious overhead resistance. This doesn’t mean the story is over — not even close. But it could mean we take a breather before the next leg higher.
🧭 Targets ahead remain unchanged:
🔹 First stop: $182.85
🔹 Long-term vision: $227.41
What started as a bold macro call in 2021 has now become a multi-year thesis with precision updates along the way. This is post #6 in the NVIDIA journey — and if you scroll back through the chart, each piece has built on the last with clarity and conviction.
🎯 NVIDIA is not just a tech stock — it’s the AI backbone. But every cycle has pauses, and this one looks ready for a short rest before we see the next breakout.
Stay sharp, follow the structure, and honor the parabola.
One Love,
The FX PROFESSOR 💙
Additional info, for those who like to dive deeper into NVDA:
🔍 Technical Breakdown Version
For the chartists and structure followers, here’s the breakdown:
📌 2021: Original call — "Best Buy of the Decade"
📌 2023: First parabola plotted, projecting toward $143.85 — target hit precisely
📌 April 2025: Market offered $95 re-entry — second parabola begins
📌 Now: Price sits at $163.89, testing resistance from both structure and Fibonacci
📌 Next levels:
- $182.85 → Key extension level
- $227.41 → Long-term target based on full parabolic arc
Current structure suggests a possible pause before continuation. No need for panic — parabola remains valid unless structure is broken. Volume still supportive, and price action is following projection beautifully.
🧠 AI Macro Narrative Version
The big picture? NVIDIA isn't just another semi stock — it’s the nervous system of the AI revolution.
From gaming → crypto → AI, NVIDIA has consistently been first to adapt, and now it’s the leader in AI hardware infrastructure. The $4 trillion milestone is more than symbolic — it represents capital reallocation toward AI as the next dominant sector.
🧠 Key macro takeaways:
AI demand is insatiable
Data centers need NVIDIA
Generative AI isn't slowing down
Institutions are still buying — not selling
The resistance we see now isn’t weakness — it’s the market pausing to digest before another acceleration. Just like every past cycle... we ride, retrace, reload, and resume.
Disclosure: I am happy to be part of the Trade Nation's Influencer program and receive a monthly fee for using their TradingView charts in my analysis. Awesome broker, where the trader really comes first! 🌟🤝📈

Definition and Relationship between Interest Rates and InflationIntroduction
Interest rates and inflation are two of the most important macroeconomic variables that influence the health, stability, and direction of any economy. They play a vital role in shaping economic growth, consumption patterns, investment decisions, and monetary policy. Economists, central banks, and policymakers constantly monitor the movement of interest rates and inflation because they are closely interconnected. A change in one often triggers a response in the other. Understanding their definitions, types, and interrelationship provides insight into how monetary policy stabilizes the economy and controls price levels.
Definition of Interest Rates
An interest rate is the cost of borrowing money or the return earned on savings or investments, expressed as a percentage of the principal amount per unit of time (usually per year). Essentially, it represents the price of money. When individuals, businesses, or governments borrow funds, they pay interest as compensation to the lender for parting with liquidity and bearing risk.
From an economic standpoint, interest rates are a tool to balance the demand for and supply of money. Central banks, such as the Reserve Bank of India (RBI) or the Federal Reserve in the U.S., use interest rates as a primary monetary policy instrument to influence economic activity.
Types of Interest Rates
Nominal Interest Rate: The stated rate without adjusting for inflation. It represents the actual amount paid or received in monetary terms.
Real Interest Rate: The nominal rate adjusted for inflation. It reflects the true cost of borrowing and the real return to lenders. The relationship is given by:
Real Interest Rate
=
Nominal Interest Rate
−
Inflation Rate
Real Interest Rate=Nominal Interest Rate−Inflation Rate
Policy Rate: The rate set by the central bank to regulate credit in the economy. Examples include the repo rate and reverse repo rate in India.
Market Interest Rate: Determined by the forces of demand and supply of money in financial markets.
Definition of Inflation
Inflation refers to the sustained increase in the general price level of goods and services in an economy over a period of time. When prices rise, the purchasing power of money decreases, meaning that each unit of currency buys fewer goods and services.
Inflation is not inherently bad—moderate inflation encourages spending and investment. However, excessive inflation erodes the value of savings, disrupts economic planning, and may lead to social and economic instability. Conversely, deflation, or the decline in prices, can be equally harmful because it discourages spending and investment, leading to lower economic growth.
Types of Inflation
Demand-Pull Inflation: Occurs when aggregate demand exceeds aggregate supply, causing upward pressure on prices.
Cost-Push Inflation: Arises when production costs (like wages and raw materials) increase, leading to higher prices for goods and services.
Built-In Inflation: Stems from the wage-price spiral, where workers demand higher wages to keep up with rising prices, which in turn increases production costs.
Hyperinflation: Extremely rapid and uncontrolled inflation, usually above 50% per month.
Stagflation: A condition where inflation and unemployment rise simultaneously, posing a severe challenge for policymakers.
The Relationship between Interest Rates and Inflation
Interest rates and inflation share a strong, inverse, and dynamic relationship. Generally, when inflation rises, central banks increase interest rates to control it. Conversely, when inflation falls or economic growth slows, they reduce interest rates to encourage borrowing and spending.
The interaction between the two can be understood through the following mechanisms:
1. The Fisher Effect
The Fisher Effect, named after economist Irving Fisher, explains the relationship between nominal interest rates, real interest rates, and expected inflation. According to this theory, the nominal interest rate is equal to the sum of the real interest rate and the expected inflation rate.
𝑖
=
𝑟
+
𝜋
𝑒
i=r+π
e
Where,
𝑖
i = Nominal interest rate
𝑟
r = Real interest rate
𝜋
𝑒
π
e
= Expected inflation rate
If inflation expectations rise, lenders demand higher nominal rates to maintain the same real return. This mechanism ensures that real returns remain stable despite fluctuations in price levels.
2. Central Bank Policy Response
Central banks play a key role in managing the relationship between interest rates and inflation. When inflation rises beyond the target (for example, above the RBI’s comfort zone of 4 ± 2%), the central bank raises policy rates such as the repo rate. This increases the cost of borrowing, reduces money supply, and cools down demand, thereby reducing inflationary pressure.
On the other hand, during periods of low inflation or deflation, the central bank cuts interest rates to stimulate borrowing, investment, and spending, which helps increase demand and stabilize prices.
3. Transmission Mechanism
Changes in policy rates affect inflation through the monetary policy transmission mechanism:
Higher interest rates → Higher borrowing costs → Reduced consumer spending and business investment → Lower aggregate demand → Reduced inflation.
Lower interest rates → Cheaper credit → Increased spending and investment → Higher aggregate demand → Rising inflation.
This process, however, takes time, and the impact may vary depending on the economy’s structure and financial system efficiency.
4. Inflation Expectations and Real Interest Rate
Inflation expectations influence both consumer behavior and monetary policy. If people expect future inflation to be high, they tend to spend more now, further driving up prices. Central banks, therefore, aim to anchor inflation expectations by maintaining credibility in their policies. Real interest rates (nominal minus inflation) provide the true measure of whether monetary policy is expansionary or contractionary.
For instance, if the nominal rate is 6% and inflation is 5%, the real interest rate is only 1%, indicating easy monetary conditions. Conversely, if inflation is 2% and the nominal rate is 6%, the real rate is 4%, signaling a tighter policy stance.
Impact of Inflation on Interest Rates
Rising Inflation → Higher Interest Rates:
When inflation increases, lenders demand higher nominal interest rates to offset the loss in purchasing power. Central banks raise policy rates to control excess demand and price rises.
Falling Inflation → Lower Interest Rates:
Low inflation reduces the pressure on monetary authorities, allowing them to lower interest rates and stimulate growth.
Unexpected Inflation → Distorted Interest Rates:
If inflation rises unexpectedly, borrowers benefit because they repay loans with money that has less value, while lenders lose purchasing power.
Impact of Interest Rates on Inflation
Tight Monetary Policy:
Raising interest rates reduces credit availability, slows economic activity, and curbs inflationary trends.
Loose Monetary Policy:
Lowering interest rates encourages borrowing and spending, potentially leading to inflation if demand exceeds supply.
Interest Rate Lag Effect:
Monetary policy operates with a time lag. It may take several months for interest rate changes to influence inflation meaningfully.
Practical Examples
United States: In the 1980s, the Federal Reserve under Paul Volcker sharply increased interest rates to curb double-digit inflation, successfully restoring price stability.
India: The Reserve Bank of India often adjusts the repo rate in response to consumer price index (CPI) inflation. For instance, during high inflation periods such as 2013 or 2022, the RBI raised rates to maintain price stability.
Conclusion
The relationship between interest rates and inflation is one of the cornerstones of modern macroeconomic management. While inflation represents the rate at which prices increase, interest rates determine the cost of borrowing and the reward for saving. The two are intricately linked through expectations, monetary policy, and the overall balance of demand and supply in the economy.
An optimal policy aims to maintain a balance—interest rates that are neither too high to stifle growth nor too low to fuel inflation. Central banks, through careful monitoring and policy adjustments, strive to achieve price stability and sustainable economic growth. Understanding this delicate relationship is essential for investors, businesses, and policymakers in making informed economic decisions.
NVDGETTEX:NVD
NVD should undergo a healty correction in the coming weeks. My view is that the NVD stock will move toward the strong support level at the price of $130 -$117 whit stoploss at price $183

Inflation and Interest Rates Impact in the Global Market1. Understanding Inflation and Interest Rates
Inflation refers to the sustained increase in the general price level of goods and services over time. It reduces the purchasing power of money—meaning each unit of currency buys fewer goods than before. Moderate inflation is a sign of economic growth, while excessive inflation (hyperinflation) can destabilize economies.
Interest rates, on the other hand, represent the cost of borrowing money. They are typically set by a country's central bank, such as the U.S. Federal Reserve (Fed), the European Central Bank (ECB), or the Reserve Bank of India (RBI). When inflation rises, central banks usually raise interest rates to control it; when inflation falls, they lower rates to stimulate borrowing and investment.
2. The Relationship Between Inflation and Interest Rates
The link between inflation and interest rates is both direct and inverse:
When inflation increases, central banks raise interest rates to slow down demand and stabilize prices.
When inflation decreases, interest rates are lowered to encourage spending and investment.
This balancing act aims to maintain price stability without hurting economic growth. However, in a globally connected economy, these changes affect not just domestic markets but also cross-border trade, capital flows, and investment sentiment.
3. Impact on Global Financial Markets
a. Stock Markets
Inflation and interest rates play a major role in determining stock market trends.
High Inflation: When inflation is high, companies face higher input costs (such as raw materials and wages), which reduce profit margins. Investors may anticipate lower earnings and reduce exposure to equities, causing stock prices to fall.
Rising Interest Rates: As borrowing becomes more expensive, businesses cut down on expansion plans, and consumers reduce spending. This lowers corporate revenues and earnings, leading to a bearish market.
For example, in 2022, the U.S. Federal Reserve’s aggressive rate hikes to curb inflation caused major global indices like the S&P 500 and NASDAQ to decline sharply. Technology and growth stocks were particularly affected due to their dependency on low borrowing costs.
b. Bond Markets
Bond prices and interest rates move in opposite directions.
When interest rates rise, the yields on newly issued bonds become more attractive, leading to a decline in the prices of existing bonds.
When rates fall, older bonds with higher yields gain value.
Global investors often shift between bonds and equities depending on the interest rate environment. For instance, when inflation is high and rates rise, investors may prefer short-term bonds or inflation-protected securities.
c. Currency Markets (Forex)
Inflation and interest rates significantly affect currency values.
A country with high interest rates often attracts foreign investors seeking higher returns, leading to currency appreciation.
Conversely, high inflation tends to devalue a currency, as its purchasing power erodes.
This dynamic can create volatility in foreign exchange markets. For example, the U.S. dollar typically strengthens when the Federal Reserve raises rates, as global investors move capital to dollar-denominated assets.
d. Commodity Markets
Commodities such as gold, oil, and agricultural products are closely tied to inflation trends.
High Inflation: Commodities often rise in price because investors use them as a hedge against inflation. Gold, for instance, tends to perform well when inflation is high or when real interest rates are negative.
Interest Rate Hikes: Higher interest rates can reduce demand for commodities by strengthening the currency and making holding physical assets less attractive.
In 2022–2023, oil and gold prices fluctuated heavily in response to inflationary pressures and central bank rate adjustments worldwide.
4. Impact on International Trade and Investment
a. Trade Balances
Inflation can affect a country's trade competitiveness. When domestic prices rise faster than those of trading partners, exports become more expensive, reducing demand from foreign buyers. Meanwhile, imports may become cheaper, worsening the trade balance.
Interest rates also influence trade. Higher rates tend to strengthen the domestic currency, making exports less competitive and imports cheaper—again, affecting trade dynamics.
b. Foreign Direct Investment (FDI)
Global investors closely monitor inflation and interest rate trends before committing capital.
Stable inflation and moderate interest rates attract long-term investment, as they indicate economic predictability.
High inflation and volatile rates discourage FDI due to uncertainty about future returns and exchange rate risks.
For example, emerging markets like India or Brazil attract foreign capital when inflation is under control and real interest rates are favorable.
5. Impact on Emerging and Developed Economies
a. Developed Economies
In advanced economies like the U.S., Japan, or the Eurozone, central banks use sophisticated tools to manage inflation and interest rates. However, global shocks—such as the COVID-19 pandemic or energy price spikes—can still cause inflationary surges that ripple through global markets.
Rising rates in these economies often lead to capital outflows from emerging markets as investors seek safer returns in stable currencies. This can cause volatility in developing countries’ stock and bond markets.
b. Emerging Markets
Emerging economies are more vulnerable to inflation and interest rate fluctuations because they rely heavily on foreign investment and imported goods. When global interest rates rise, these countries face higher borrowing costs and currency depreciation.
For instance, when the U.S. Federal Reserve increases rates, countries like India, Indonesia, or South Africa often experience currency pressure and foreign capital outflows. This impacts their stock markets and economic growth prospects.
6. Central Bank Strategies and Global Coordination
Central banks play a crucial role in managing inflation and interest rates. Major institutions such as the Federal Reserve, European Central Bank, Bank of England, and Bank of Japan use tools like:
Open market operations (buying or selling government bonds)
Reserve requirements
Policy interest rate adjustments
Global coordination among central banks is often necessary to avoid severe currency fluctuations or market shocks. For instance, during the 2008 financial crisis and the 2020 pandemic, major central banks collaborated to maintain global liquidity and stabilize financial systems.
7. Long-Term Implications for Global Markets
The long-term impact of inflation and interest rate movements includes:
Shift in Investment Strategies: Investors move between asset classes (equities, bonds, commodities) depending on rate trends.
Corporate Debt Management: Companies may restructure their debt portfolios to minimize interest burdens.
Economic Growth Patterns: Prolonged high rates may slow global growth, while ultra-low rates risk creating asset bubbles.
Policy Dilemmas: Central banks must balance fighting inflation with avoiding recession—a challenge seen frequently in recent years.
8. Conclusion
Inflation and interest rates act as the twin levers of the global economy. Their interplay determines the rhythm of economic growth, the flow of international capital, and the behavior of financial markets. While moderate inflation and balanced interest rates indicate a healthy economy, extreme conditions—either high inflation or rapid rate hikes—can trigger global instability.
For investors and policymakers, understanding this relationship is crucial. A rise in inflation signals the need for vigilance in portfolio management and monetary policy, while changing interest rates dictate shifts in market behavior across sectors and nations. In an interconnected world, the effects of these two forces transcend borders, shaping the future of trade, investment, and financial stability worldwide.
