NVDA Dec 12 Market Structure and Options. Driven Levels
NVDA 15-Min Market Structure
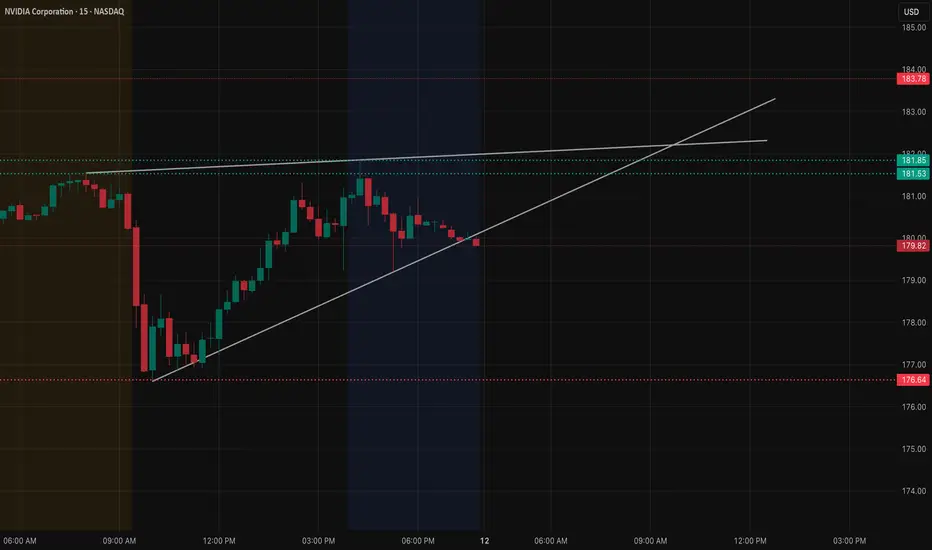
NVDA has been riding a steady intraday trendline from the morning rebound, but the most recent candles show price slipping underneath that trendline. This shift tells us momentum is slowing, and the market is waiting for a key directional trigger.
Above price, the intraday resistance band near 181.50–182 has rejected multiple times. Until NVDA can claim and hold above that zone, the chart leans neutral-to-slightly-heavy.
Below current levels, the lower trendline (local rising support) interacts with 179.50–180 — a zone that has already acted as a short-term pivot. If this area breaks cleanly, a deeper correction becomes more likely.
Now Look at How Options Positioning (GEX) below That Aligns With the Chart:
Looking at the options landscape, NVDA shows concentrated call-side resistance stacked from 182.5 up toward 187.5–190. These levels often behave like “upper gravity zones” — price may approach them, but if call positioning is dense, dealers tend to hedge in a way that suppresses sharp upside.
This aligns well with the technical rejection seen around 181.50–182. The market had multiple chances to break through but failed, confirming that supply is reinforced by options positioning.
On the downside, the negative GEX region around 177–175 marks where put positioning thickens. These zones often act as stabilization areas during pullbacks because dealer hedging can slow the decline as price approaches them.
This creates a very clean structure:
* Resistance and upside hesitation: 181.5 → 182.5 → 187.5
* Neutral zone: 180–179.5
* Downside absorption: 177 → 175
Technically and options-wise, NVDA sits in a narrow decision range. Breakout above 182.5 could open room toward 185 and possibly 187.5 if momentum builds. Break below 179.5 puts 177 and 175 into play.
Directional Thoughts for Dec 12
* Bullish Case:
NVDA must break above 181.5–182.5 and hold. If achieved, the next push could target 185, with an extension toward 187.5 where another cluster of call resistance sits.
* Bearish Case:
A clean breakdown under 179.5 shifts momentum firmly downward. In that scenario, price may gravitate toward 177 first, then 175 where options positioning suggests downside may slow.
Why This Setup Is Interesting
NVDA’s chart is not moving on pure price action alone — the intraday reactions line up almost perfectly with the major GEX concentrations. When technical structure and options-based levels reinforce each other, markets often behave more predictably because both chart traders and hedging flows are interacting at the same spots.
This makes NVDA one of the cleaner names to watch on Dec 12.
Disclaimer
This analysis is for educational purposes only and does not constitute financial advice. Always perform your own research and manage risk according to your individual trading plan.
NVIDIA Corporation Shs Cert Deposito Arg Repr 0.04166667 Sh
No trades
Trade ideas
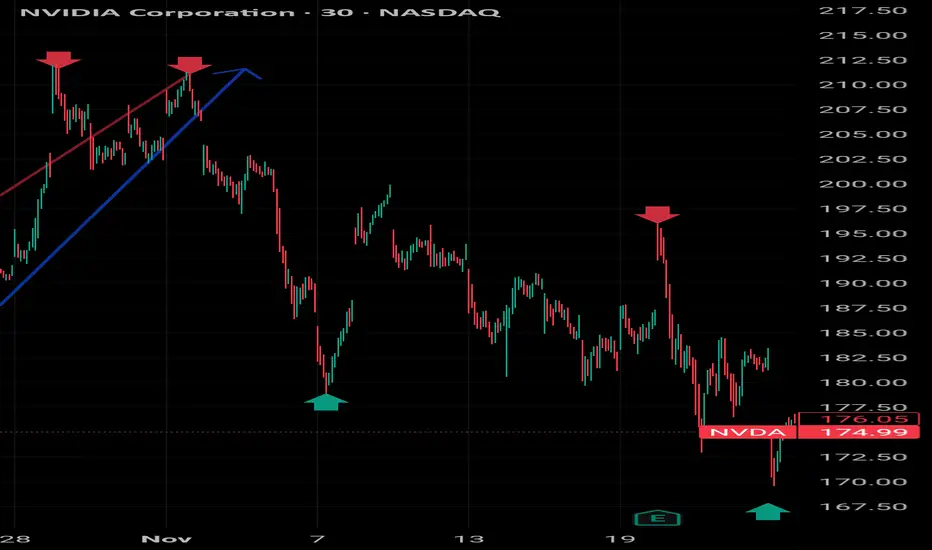
NVDA 30-Min – Beginner Structure & S/R PracticeI’m new to trading and still learning how to properly read market structure, trends, and support/resistance. This post is for feedback only, not a trade idea.
On this 30-minute NVDA chart, I marked:
Higher highs / higher lows during the uptrend (blue arrows)
Lower highs where price rejected and rolled over (red arrows)
Pullbacks and breakdown moves after resistance failed (yellow arrows)
Key reaction lows that appeared to act as temporary support (green arrows)
What I’m trying to understand:
Are my trend lines and structure shifts being identified correctly?
Do these rejection points actually qualify as resistance, or am I over-drawing?
Where would experienced traders simplify this chart?
At what point does structure clearly break instead of “just pulling back”?
No position taken.
No entries, targets, or stops planned.
Strictly working on reading price behavior and cleaning up my levels.
Looking for constructive feedback on:
Line placement
Market structure interpretation
Common beginner mistakes you see here
Appreciate the insight.
Nvidia (NASDAQ: $NVDA) Eyes H200 Output Boost on China DemandNvidia (NASDAQ: NVDA) is weighing a major expansion of its H200 AI chip production after demand from Chinese companies exceeded current supply, according to Reuters sources. The surge in interest follows the U.S. government’s recent decision to allow Nvidia to export H200 processors to China under a 25% tariff, reigniting competition for access to high-performance computing hardware.
Chinese tech giants—including Alibaba and ByteDance—reportedly contacted Nvidia almost immediately after the announcement, eager to secure bulk orders of the H200. However, the situation remains fluid. The Chinese government has not yet approved inbound H200 shipments and held emergency meetings this week to determine whether to allow the chip into the country.
Limited supply is another complication. Nvidia is prioritizing production of its next-generation Blackwell and upcoming Rubin architectures, leaving only small quantities of H200 units available. This scarcity has intensified demand because the H200 is currently the most powerful AI chip legally accessible to Chinese companies—nearly six times stronger than the downgraded H20 version released in 2023.
Industry analysts warn that allowing the H200 into China could slow the growth of China’s domestic AI chip ecosystem. Chinese regulators are considering conditions such as requiring each H200 purchase to be bundled with locally produced chips to support homegrown semiconductor development.
Technical Analysis
The NVDA chart currently shows price consolidating below the recent high near $212. After a strong multi-month rally, the stock has pulled back into a key short-term support zone around $175–$185. Holding this range could position NVDA for a retest of its highs, supported by strong demand catalysts and ongoing AI infrastructure investment.
If price breaks below $175, a deeper correction toward the $150 demand zone becomes likely. Volume is stabilizing, and RSI sits mid-range, indicating a neutral momentum backdrop awaiting a directional catalyst. Traders should watch for reclaiming the $190–$195 area to confirm bullish continuation.

Still expecting $NVDA to go back to double digits in 2026. Why?Expectation risk is massive
NVIDIA is priced like “AI demand stays hypergrowth.” If guidance ever hints at normalization, the stock can re-rate quickly.
Also, this chart look very bearish to me:
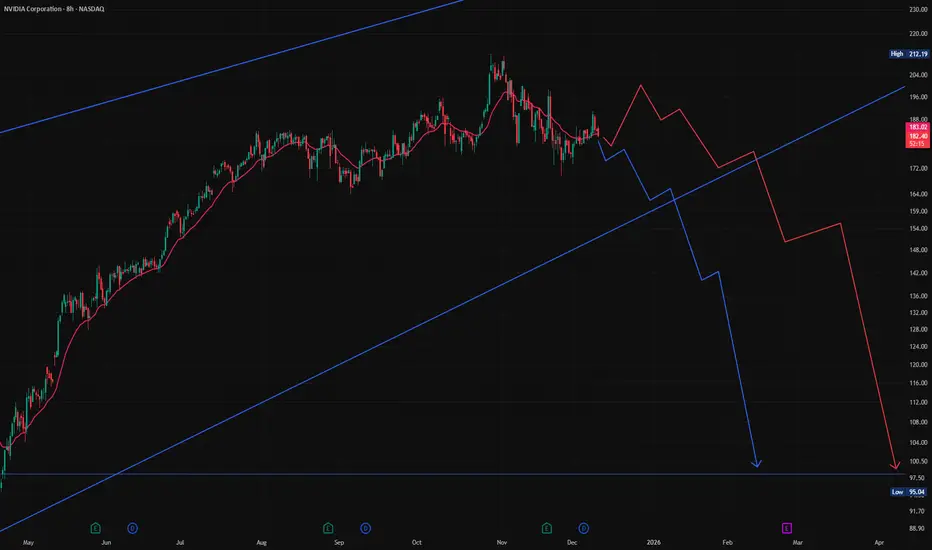
NVIDIA This is how it can reach $100 and the Supports involved.NVIDIA Corporation (NVDA) had a strong red 1M candle last month, the first one after a rally of 7 straight green months. This is not the first time we present you this 12-year Channel Up, in fact we used this in late October to give a sell signal.
The reason is that Nvidia almost reached the top of that pattern, a technical Higher High, successive if you count the late 2024 one. Such Double Tops have been previously consistent with the start of strong corrections (Bearish Legs) which in both cases (2018 and 2022) bottomed on the 1W MA200 (orange trend-line).
The key element that we added on the chart this time is the (green) Support Zone, which stemmed every time from the last consolidation (blue circle) before the Top.
It is no surprise that this time it also falls on the 1W MA200 and a potential contact with the price towards Q3 2026 and beyond. Even then, it will still be above the 0.382 Fibonacci retracement level as in December 2018 and quite close to the bottom of the Channel Up for the first time since October 2022.
Our long-term Target and thus next long-term Buy Signal, remains $100.
---
** Please LIKE 👍, FOLLOW ✅, SHARE 🙌 and COMMENT ✍ if you enjoy this idea! Also share your ideas and charts in the comments section below! This is best way to keep it relevant, support us, keep the content here free and allow the idea to reach as many people as possible. **
---
💸💸💸💸💸💸
👇 👇 👇 👇 👇 👇

Nvda daily chart
I am waiting for a breakout of the $187.35 level and a daily timeframe close above this level.
Good luck 4all

Nvidia - The correction just started!💉Nvidia ( NASDAQ:NVDA ) is now heading lower:
🔎Analysis summary:
Just recently, Nvidia once again retested the major rising channel resistance trendline. Together with November's bearish engulfing candle, Nvidia is slowly shifting bearish. And before Nvidia will retest the next major support area, we can see a drop of another -15%.
📝Levels to watch:
$150
SwingTraderPhil
SwingTrading.Simplified. | Investing.Simplified. | #LONGTERMVISION

Mastering the Art of the Exit With a Simple Trick.Mastering the Art of the Exit With a Simple Trick.
Let me share a situation with you that has caused me more anxiety in the market than any other.
You buy a stock, a currency, or a cryptocurrency.
And this time... yes! It starts to climb. And climb. You are up 5%. Then 10%!! Suddenly, you are staring at a 15% gain!!!!
It feels brilliant. You have nailed the entry point, and your ego starts to whisper that you might just be a GENIUS.
But, my friend, this is the easy part of trading . Finding entry points is relatively simple.
The complexity of trading lies in the exit.
And this is exactly where our brain serves us a banquet of overwhelming anxiety.
Do we take that 15% and call it a win?
Do we get out?
But what if I sell and it shoots up to 30%? I entered so perfectly, I better stay.
I couldn’t bear missing the rally... But what if it suddenly turns around and we drop back to 0%?
If you have ever invested a single dollar, this internal dialogue must resonate deeply within you.
This anxiety is born from a lack of control.
Because we lack control over when to exit, our minds go wild, tossing scenarios into the air like someone plucking petals off a flower to decide their future.
REGAINING CONTROL
Today, I want to hand you a tool that will help you identify the precise moment it becomes interesting to reduce positions in a bull market, or even start considering a short position.
This strategy is incredibly simple to execute, and it works on any stock or listed market.
In the charts below, I have marked a few specific candles. These are magnificent candles for identifying when a bullish cycle is coming to an end, or at the very least, is about to take a significant pause.
What do you think they have in common?
Notice that these are charts from very different companies and sectors, in bullish, sideways, or bearish situations.
But all of them mark moments of change . They are highly interesting moments to sell.
What do you believe these candles share?
I am going to give you the answer in a moment, but whether you guessed right or not, I would love to know what went through your mind.
I’ll read you in the comments!
The answer, once you know it, is quite obvious, and it might even make you feel a little frustrated (my apologies!) .
But the truth is, the answer has always been right there in front of you.
It is like when you do not understand a language: you hear the sounds, but you do not comprehend the meaning. In this case, you have seen it, but perhaps you haven’t realized its significance.
Come on, let me give you one more clue.
Do you see it now?
Precisely.
The volume on those days is absolutely ridiculous.
When you compare it with the surrounding days, these days clearly fall below the average.
In fact, for those of you who love the data, we are talking about volumes in the 2nd or 3rd percentile maximum. That means out of every 100 trading days, we are looking for the 2 or 3 days with the least volume.
We are looking for the rare ones!
Important Note: You must NOT count public holidays or the days immediately preceding them. During Christmas, August, and other holidays or semi-holidays, volume is low per se. We are looking for low volume on normal trading days.
THE PSYCHOLOGY OF LOW VOLUME
The market moves based on the buying and selling of its participants.
When you buy, an immutable record remains of how many shares were bought and at what price. The sum of these shares and prices creates the trading volume.
When many people are interested in a stock, volume rises. Many shares change hands rapidly, causing the price to climb and climb, provoking even more transactions.
But sometimes, something incredible happens.
The price is making new highs, or is very close to them, yet the volume is ridiculous.
Why?
It means we have reached a point where we have run out of buyers. However, at the same time, the sellers do not want to "undersell" . They are waiting for that buying pressure to appear again.
When it doesn’t happen, and we see a day of low volume because buyers want it cheaper and sellers (for now) don’t want to lower their prices , we see a standoff.
No exchanges are achieved.
When the smartest sellers realize this, they begin to lower their prices in search of liquidity. As this drop in price initiates, the rest of the sellers begin to sell, entering into a progressively greater panic.
These candles indicate a lack of transactions due to a misalignment of supply and demand. The day following this misalignment, we typically see a forceful candle confirming that the price needs to be in a different zone, one where we are all willing to transact.
These days can signal both trend continuation and trend reversal, but that is a detail requiring a depth we won’t cover today.
Today, I will focus on the days of trend reversal.
Notice that in addition to working in bearish trends, this works equally well for bullish reversals. In fact, on the same chart, you can find opposite examples and make money in both directions, like this:
It even works well on higher timeframes like the Weekly, especially when combined with larger Chart Patterns, such as the Double Bottom.
HOW TO DETECT THEM
To spot these moments, TradingView offers a very interesting, and quite unknown free indicator.
It is called High/Low Volume.
It marks percentile lines, which helps you visualize the days with the lowest volume. Remember to be careful, many of these marks will be holidays, or days near Christmas or August. Discard those.
I hope that the next time you see a day of low volume, provided it isn’t a holiday, you will see the market through a different lens.
I invite you to start analyzing if this is happening at support or resistance levels , or if it fits with a larger chart pattern to guide your way.
🎁 Let’s make a simple deal.
I will handle the heavy lifting to create content like this for free, and you just HIT the 🚀 Rocket and Follow for more!
🤝 Deal?

Not sure how this is UBER bullish...That support line is now VERY important for Nvidia.
possible 20% drop

(NVDA) Complex China Saga and Strategic ImplicationsRecent developments surrounding Nvidia’s ability to sell advanced chips in China highlight the profound geopolitical and commercial challenges facing the AI semiconductor leader. The announcement of a deal by the Trump administration to allow the sale of its H200 chip to "approved customers" in China represents a significant, yet highly conditional, policy shift.
The Shrinking China Footprint and Revenue Impact
The data underscores a dramatic contraction in Nvidia's China business, a direct result of successive U.S. export controls. For the latest quarter, Nvidia's revenue from China stood at $2.8 billion, accounting for just 5% of its total sales. This figure is starkly lower than:
The $8.4 billion Wall Street had projected for the quarter.
The 13% of overall revenue China represented in the previous fiscal year.
This decline illustrates the substantial financial toll of the regulatory environment. In contrast, Nvidia's revenue from the United States ($39.2 billion) and Taiwan ($13.8 billion) demonstrates where its growth momentum has decisively shifted, fueled by global demand for AI data center infrastructure outside of the restricted Chinese market.
A Rollercoaster of Regulatory Actions
The path to the current "approved customers" deal has been fraught with volatility:
The April Ban: An unexpected move by the Trump administration in April effectively banned sales of the H20 chip to China, causing a significant stock sell-off and an estimated $2.5 billion in lost Q1 revenue.
The August Deal: Following intensive lobbying by CEO Jensen Huang, President Trump agreed in August to grant export licenses. However, this came with an unprecedented condition: Nvidia would be required to share 15% of its China revenues with the U.S. government.
Chinese Retaliation: In a complicating twist, Chinese regulators subsequently moved to ban domestic tech firms from purchasing the very H20 chips Nvidia was now licensed to sell, reflecting the tit-for-tat nature of the tech war and potentially undermining the value of the U.S. concession.
Nvidia's CFO, Colette Kress, encapsulated the company's position, stating disappointment over being unable to ship "more competitive" products to China while committing to continued engagement with both governments to advocate for global competitiveness.
Strategic and Market Implications
This situation places Nvidia in a delicate balancing act. The new deal potentially opens a narrow channel for revenue, but under terms that cede a portion of profits and face demand-side uncertainty from Chinese buyers. The company's strategy appears to be one of resilient diversification, having successfully reallocated its immensely sought-after supply to other global markets, as evidenced by its monumental U.S. and Taiwan revenue figures. The long-term risk remains that prolonged restrictions could accelerate China's drive for semiconductor self-sufficiency, creating future competitors.
Technical Perspective and Key Levels
From a chart analysis standpoint, following the significant news-driven price movements, key Fibonacci retracement levels have emerged as critical technical supports for Nvidia's stock:
First Support Zone: $182.53 (0.236 Fibonacci Level)
This represents the initial level where buyers may step in to defend the prevailing trend during a pullback. Holding above this zone would suggest underlying strength remains intact.
Second & Stronger Support Zone: $164.20 (0.382 Fibonacci Level)
This is identified as a more significant support area. A test of this level would indicate a deeper correction, and its ability to hold would be a crucial test of the stock's structural bullish foundation amid ongoing geopolitical headlines.
Conclusion
Nvidia's navigation of the U.S.-China tech conflict is a masterclass in managing geopolitical risk. While the new "approved customers" deal provides a partial and costly relief valve, the company's financial performance proves its growth is no longer dependent on the Chinese market. Investors must weigh the incremental benefit of reopened, albeit diminished, China sales against the persistent risks of regulatory whiplash from both nations and the long-term strategic decoupling of the tech ecosystems. The stock's trajectory will likely continue to be influenced by these macro forces, with the identified technical support levels serving as important gauges of market sentiment through the volatility.

NVDA Sitting on a Decision Zone – Dec. 15 Could Be ExplosiveNVDA doesn’t look healthy right now. The structure has already rolled over, and what we’re seeing now feels more like damage control, not buyers stepping in with confidence.
After the breakdown from the prior range, price tried to bounce, but every push higher has been weak and quickly sold. That tells me sellers are still active, and buyers are mostly reactive.
Right now, NVDA is hovering around the 175 area, which is acting like a temporary pause. It’s holding for now, but it doesn’t feel like a strong base — more like the market catching its breath.
Levels that matter
The first level I care about is 175.
That’s where price is trying to stabilize. If NVDA loses this area, the downside opens up fast.
Below 175, I’m watching 172–170. That zone lines up with prior support and liquidity from earlier moves. If price gets there, I’d expect some reaction, but if it doesn’t hold, things can accelerate lower quickly.
On the upside, 178–180 is the first real resistance. This area has rejected price multiple times already. If NVDA can’t reclaim and hold above it, upside moves are likely just short-lived bounces.
Above that, 183–185 is the bigger test. That’s where the previous structure really broke down, and sellers are likely waiting again.
Let check GEX options positioning to see if it fits the picture
Options positioning lines up with the weakness on the chart.
There’s strong PUT interest below, which explains why price is pausing instead of free-falling. But overhead, CALL resistance is stacked, especially above 180, which makes sustained upside harder.
That’s why downside moves feel sharper, and upside moves feel slow and heavy.
How I’m approaching NVDA
As long as NVDA stays below 180, I’m cautious leaning long. That level needs to be reclaimed and held for the chart to start improving.
If price loses 175, I’d expect momentum to pick up toward 172–170.
For me:
* Below 175 → downside continuation risk
* Between 175–180 → chop and traps
* Above 180 with acceptance → relief rally attempt
Until proven otherwise, this still looks like bearish consolidation, not a reversal.
This analysis is for educational purposes only and does not constitute financial advice.

Tech Giant Nvidia Close to Implosion.Tech Giant Nvidia Close to Implosion.
Oh man...
Not sure how this is UBER bullish...

1W technical analysis Bears shouldn't be so confident just yet, as you can see the price is still respecting the pivot area's along the trendline. Looking at the current chart we also have possible divergence setting up into next week. only time will tell us more. Go bulls

DeepSeek Smuggles Nvidia (NASDAQ: $NVDA) Chips for AI ModelChinese AI startup DeepSeek is reportedly building its next major artificial intelligence model using thousands of Nvidia (NASDAQ: NVDA) Blackwell-generation GPUs that were smuggled into China, according to a detailed investigation by The Information. These chips, among Nvidia’s most advanced AI accelerators, are restricted under U.S. export controls, making them unavailable to Chinese buyers through legal channels.
The report highlights a sophisticated smuggling operation in which servers equipped with Blackwell chips were initially shipped to data centers in countries not affected by U.S. restrictions. The servers were then dismantled, and their components imported into China in pieces, bypassing regulatory scrutiny. Most Nvidia chips are produced in Taiwan and distributed globally through a network of intermediaries, creating gaps that can be exploited.
For DeepSeek, access to the Blackwell architecture provides a significant performance advantage. It enables faster training times, larger models, and superior inference efficiency—critical factors in the global AI race. Despite Beijing’s aggressive support for domestic semiconductor advancement, Chinese-made AI chips still trail Nvidia’s top-tier performance, according to executives from Chinese AI companies.
Nvidia, responding to the allegations, stated that it has not seen evidence of “phantom data centers” being constructed and dismantled to disguise smuggling routes, though the company emphasized that it investigates any credible tip it receives.
Technical Analysis
NVDA’s price action remains in a broad structural uptrend, despite recent volatility. The stock is currently trading near $185, just below its shorter-term moving average. A critical resistance zone lies around $212, marked by the previous swing high. A breakout above this level could resume the macro uptrend, potentially targeting new all-time highs.
If price fails to reclaim momentum, downside support sits around $170, where significant demand previously pushed price higher. A deeper correction could revisit the $145 liquidity zone, aligning with historical consolidation. Overall, NVDA remains technically strong, but sensitive to geopolitical and regulatory headlines.

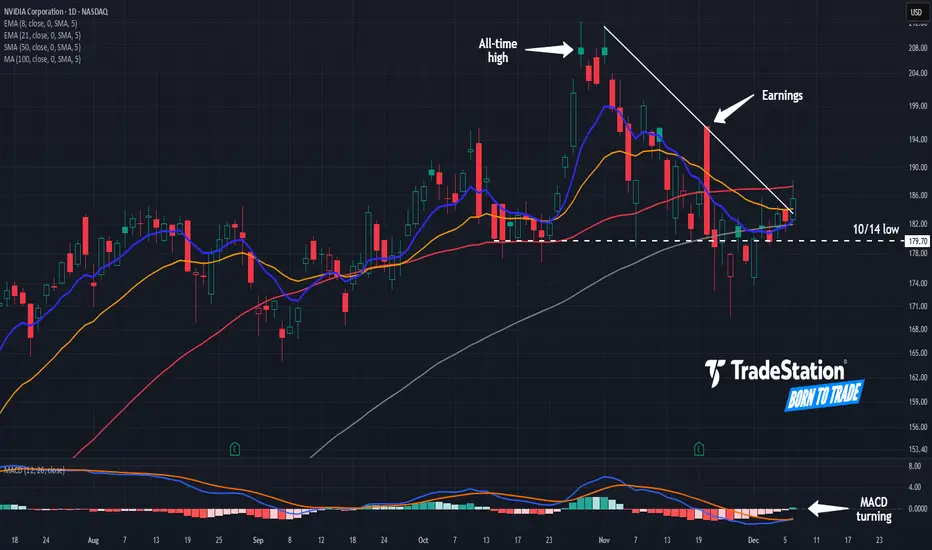
Is Nvidia’s Next Up Leg Coming?Nvidia has paused after a rally, and some traders may think the next up leg is coming.
The first pattern on today’s chart is the series of lower highs since November 3. The AI chip giant closed above that falling trendline yesterday, which could mean that the short-term resistance is fading.
Second is the failed rally on November 20 after earnings and revenue beat estimates. MACD was falling at the time, which prevented the shares from holding their gains. But now the oscillator has turned up, which may suggest that momentum has grown more favorable.
Third, prices have consolidated around their 50- and 100-day simple moving averages. That could reflect a bullish long-term trend.
Next, the 8-day exponential moving average (EMA) is rising toward the 21-day EMA. Crossing above may signal bullishness in the short term.
Finally, NVDA is a highly active underlier in the options market. (Its average daily volume of 3.6 million contracts ranks first in the S&P 500, according to TradeStation data.) That may help traders take positions with calls and puts.
TradeStation has, for decades, advanced the trading industry, providing access to stocks, options and futures. If you're born to trade, we could be for you. See our Overview for more.
Past performance, whether actual or indicated by historical tests of strategies, is no guarantee of future performance or success. There is a possibility that you may sustain a loss equal to or greater than your entire investment regardless of which asset class you trade (equities, options or futures); therefore, you should not invest or risk money that you cannot afford to lose. Online trading is not suitable for all investors. View the document titled Characteristics and Risks of Standardized Options at www.TradeStation.com . Before trading any asset class, customers must read the relevant risk disclosure statements on www.TradeStation.com . System access and trade placement and execution may be delayed or fail due to market volatility and volume, quote delays, system and software errors, Internet traffic, outages and other factors.
Securities and futures trading is offered to self-directed customers by TradeStation Securities, Inc., a broker-dealer registered with the Securities and Exchange Commission and a futures commission merchant licensed with the Commodity Futures Trading Commission). TradeStation Securities is a member of the Financial Industry Regulatory Authority, the National Futures Association, and a number of exchanges.
Options trading is not suitable for all investors. Your TradeStation Securities’ account application to trade options will be considered and approved or disapproved based on all relevant factors, including your trading experience. See www.TradeStation.com . Visit www.TradeStation.com for full details on the costs and fees associated with options.
Margin trading involves risks, and it is important that you fully understand those risks before trading on margin. The Margin Disclosure Statement outlines many of those risks, including that you can lose more funds than you deposit in your margin account; your brokerage firm can force the sale of securities in your account; your brokerage firm can sell your securities without contacting you; and you are not entitled to an extension of time on a margin call. Review the Margin Disclosure Statement at www.TradeStation.com .
TradeStation Securities, Inc. and TradeStation Technologies, Inc. are each wholly owned subsidiaries of TradeStation Group, Inc., both operating, and providing products and services, under the TradeStation brand and trademark. When applying for, or purchasing, accounts, subscriptions, products and services, it is important that you know which company you will be dealing with. Visit www.TradeStation.com for further important information explaining what this means.
NVDA Put Signal Triggered: Institutions Turning BearishNVDA QuantSignals V3 Weekly 2025-12-08
Direction: PUT Bias
Confidence: 58% (Medium)
Expiry: 2025-12-12 (4 days)
Entry Zone: $1.62 – $3.02 (depending on strike)
Recommended Strikes:
$182.50 (higher delta, stronger move)
$180.00 (safer, cheaper, wider buffer)
🧠 Why NVDA Shows Downside Risk
Katy AI forecasts a short-term decline of –0.73% to –1.70%
Options Flow: Extremely bearish — PCR 5.20 → 7.05 (institutions buying puts aggressively)
Technical Levels:
Strong resistance at $188.00 – $188.34
Key support around $180.00
Volume 2.4× above average → exhaustion at the highs
News: Mixed sentiment, increased volatility, China export headlines
🎯 Trade Setup (Simple Version)
Buy Puts
Strike: 180–182.5
Entry: $1.62–$3.02
Target: $2.45–$4.50
Stop Loss: $1.20–$2.10
Position Size: Small (2%)
⚠️ Risk Note
Katy’s confidence is only 50% and LLM shows conflict, so treat this as a high-risk, short-duration weekly trade.
NVIDIA must hold $169A clear line in the sand is evident (in my eyes)
Closing beneath $169 could beget further selloffs and trigger a Head and shoulders pattern.
Which projects down to $135.
Around a -36% Haircut
At which point it could represent really good value to the long side.

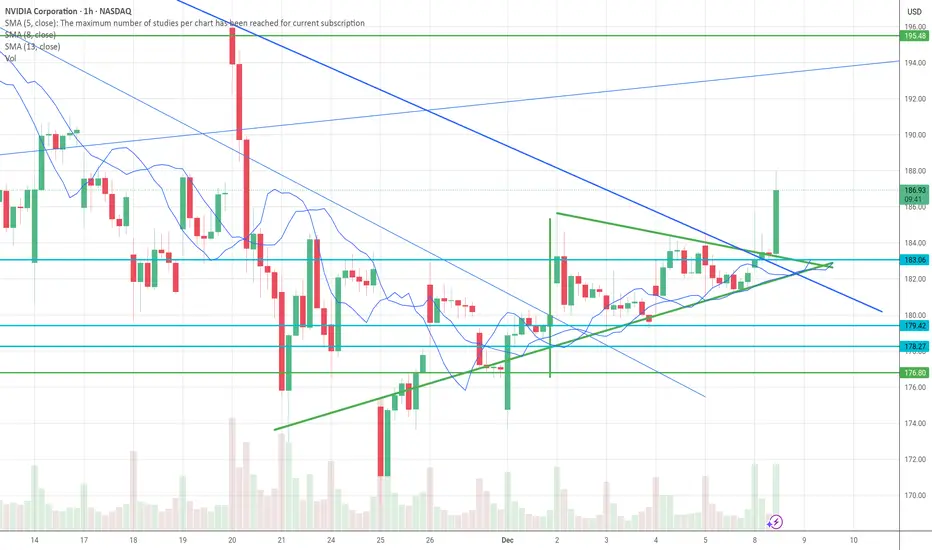
NVDA breaks out of wedge and above 20ema. Mega bullish. NVDA’s push above the wedge and reclaim of the 20‑EMA tilts the very short‑term bias back to bullish, but it’s breaking into nearby resistance rather than into empty space.
Where price sits now NVDA is trading around 187–188, just above today’s 20‑EMA (~184) and basically on top of the 50‑EMA/50‑SMA cluster near 187–188.
The prior month’s action had price oscillating around these MAs, so this area is a battle zone, not clean air. Short‑term technical services still flag 20‑EMA as a “Sell” and 50‑EMA as “Sell/neutral,” reflecting recent downside momentum despite today’s pop.
Wedge breakout implications A breakout above a falling wedge after a pullback in a larger uptrend is typically bullish, with measured‑move targets often taken as the wedge height projected from the breakout.
Given NVDA’s broader uptrend (200‑day EMA/SMA rising around 155–163), this looks more like a continuation setup; the breakout favors a retest of the upper recent range (low 190s, then 200+) if it holds above the 20‑EMA.
Key intraday / short‑term levelsSupport to hold the breakout:183–185: 20‑EMA zone and today’s intraday low area; losing this quickly would make today look like a fake‑out 178–180: prior micro‑swing area; below here, wedge breakout thesis weakens and risk shifts back toward 170s.Resistance / upside magnets:190–192: recent local resistance band flagged by several TA services and discretionary analysts as a sell zone on first touch.
Above 192 on strong volume opens room toward the prior high zone near 200–212 over days to weeks if the AI/semis tape cooperates.
Good luck. Fortune awaits.
This is not financial advice. Please do your due diligence.
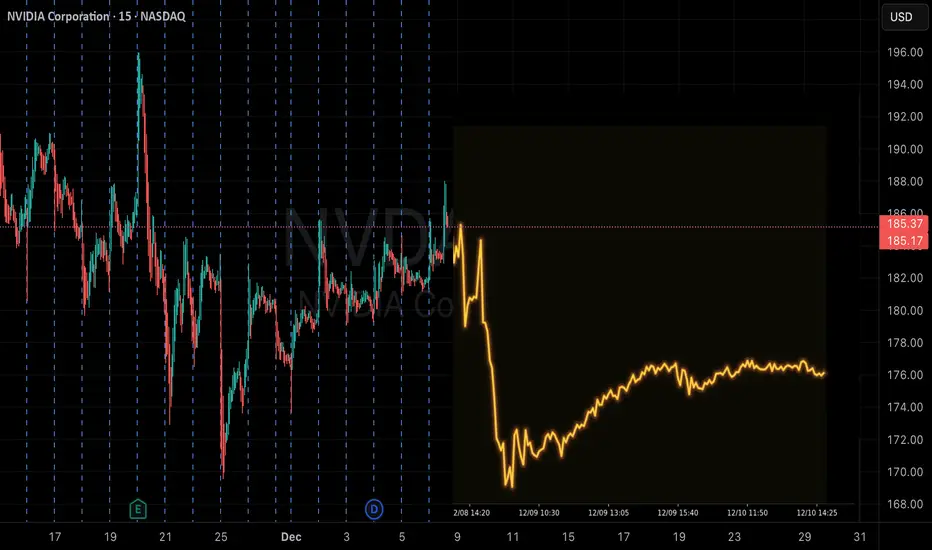
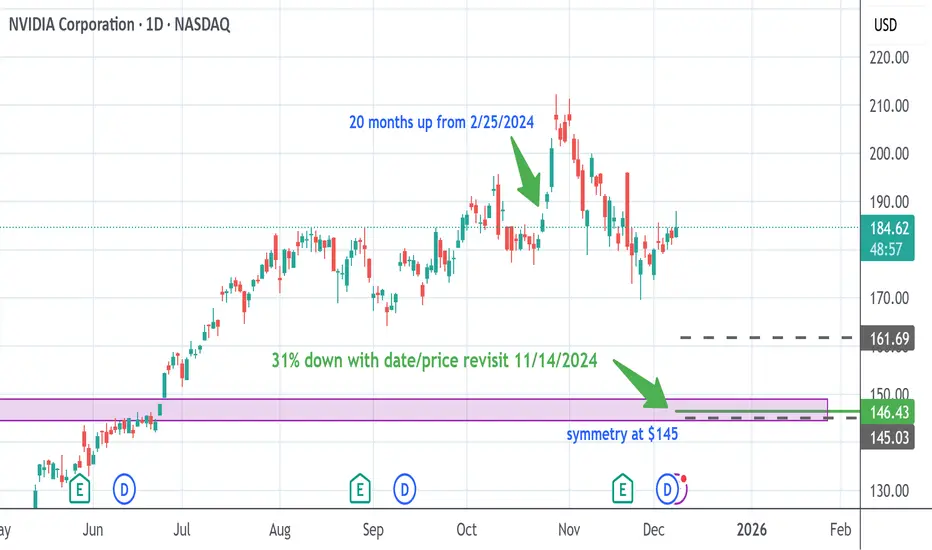
How low do we go? NVDAI get my information on where stocks might be headed based on my dowsing- as-in, with a pendulum. A super interesting thing occurred, which is that I did a reading on NVDA back on Feb. 25, 2024, which suggested a future date to be aware of in 20 months from then.
I just put the date in my my phone calendar for Oct. 24th 2025 with a couple alerts so I can pay attention. When I saw NVDA made these highs and pulled right back, I was super intrigued as it was in my date window. It's now head and shouldersy looking, and as such, I did draw a couple symmetry lines (are annotated as gray dashes) for reference.
(Love than my target is right above the second symmetry.)
I have been getting lower levels on NVDA, but I'm getting tired of some of these multiple numbers I get, so I just asked what advice there is and it said to get a date.
When I get a date, it often means a price revisit, or could be a pattern repeats from the past.. In this case, it's suggesting a price revisit to where NVDA traded on 11/14/2024. Then, I asked how many percent down from the ath at $212 & it gives me 31%.
My joy came when I drew the price lines out for the date, and lo and behold they overlay the 31% down price (146.41)!
I attempted to find out when this may hit, and I get Feb. 20th or 26th zone.
Let's boogie!
NVDA – TA for Dec 8–12Compression Under Resistance, Demand Below (Full TA + GEX Insight)
NVDA is entering the week sitting right beneath an important resistance band while holding onto a broader ascending structure. The stock is consolidating after a strong run, and the market is now deciding whether this pause leads to continuation or a deeper pullback. This week’s movement will hinge on how NVDA behaves at the key levels that have repeatedly controlled price throughout November and December.
Daily Timeframe (1D)
On the daily chart, NVDA has been drifting sideways-to-lower ever since rejecting the upper supply zone near 198–212. The structure hasn’t broken down completely — the stock is still defending its rising trendline — but momentum has clearly cooled.
A key observation on the daily chart is how NVDA keeps holding above the mid-line around 176–178, which acts as both a structural support and a zone where prior liquidity was collected. Beneath this, deeper demand sits between 164–170, with a much larger demand block far lower on the chart that has not been touched in months.
If NVDA loses the 176–178 zone on the daily, the market will likely move swiftly into the 164–170 liquidity pocket. But if buyers continue defending the trendline, NVDA may attempt another approach toward resistance.
A daily close above 185–186 would be the first sign of strength returning.
1-Hour Timeframe (1H)
On the 1H chart, NVDA is compressing beneath a clear supply shelf between 183–186. This area has acted as a ceiling multiple times over the past sessions. Each approach into the zone has produced a rejection, and the most recent push created a BOS but failed to maintain follow-through.
At the same time, NVDA is sliding into a rising intraday trendline, creating a tightening wedge. This type of structure often forces a decisive move — either a breakout into the supply zone or a breakdown into the liquidity block below.
A reclaim and hold above 184–186 is the confirmation needed for bullish continuation. Without that, the 1H chart continues to lean toward a retest of 180, 178, or even the stronger demand at 174–176.
Short-term momentum is weakening, but buyers are still defending intraday demand. This makes NVDA a range-bound market heading into the week.
15-Minute Timeframe (15M)
The 15M timeframe highlights this compression even more clearly. NVDA is trading within a tight descending channel inside a larger demand zone. Each bounce is getting smaller, but sellers also haven’t been able to break the lower block around 180–182 despite repeated tests.
This type of price action suggests the market is building energy for a larger move. The path becomes clear once NVDA either:
* sweeps the 180–182 demand and sharply reverses
or
* breaks cleanly above the 183–186 supply band and retests it as support
Until that happens, price is likely to remain choppy, and intraday trades should be taken with caution.
A break below 180 on the 15M would shift the structure decisively bearish intraday.
GEX Insight (Options Positioning & Dealer Influence)
NVDA’s gamma landscape explains why the stock has been stuck between 180 and 186.
The region around 184–186 aligns with the highest positive NET GEX, which creates a natural resistance band where dealer hedging suppresses upward momentum. This matches the repeated intraday rejections you’re seeing on the chart.
Above 190, gamma begins to thin out significantly. If NVDA can break and hold above the 186 supply zone, the path toward 192–195 becomes much easier because hedging pressure shifts from restrictive to supportive.
Below 180, gamma flips and begins pulling price toward lower put-heavy regions:
* 172
* 165
* 162.5
These areas align cleanly with the chart’s major liquidity blocks.
In summary:
* Staying below 186 keeps NVDA pinned
* Breaking 186 opens the path toward 190–195
* Losing 180 exposes liquidity down to 172–165
GEX and price action are in full agreement this week.
Trading Focus for the Week
NVDA is coiling into a decision zone. The idea is not to predict the breakout but to react once the market commits.
The cleanest long setups come from:
* A liquidity sweep into 180–182 followed by a clear reversal
* A breakout and hold above 186
The cleanest short setups come from:
* Rejection wicks in the 183–186 supply zone
* A confirmed breakdown below 180
With momentum fading but structure still intact, NVDA is preparing for a directional move — traders just need to wait for confirmation.
Disclaimer
This analysis is for educational and informational purposes only and does not constitute financial advice. Trading involves risk, and traders should conduct their own research and apply proper risk management before entering any position.

NVDA🌎NVIDIA: At the Peak or the Brink?
Nvidia's record highs are accompanied by warning signs. A market cap of $4.37 trillion and a P/E ratio of 51 indicate inflated expectations.
Risks:
Speculative demand: The $23.7 billion investment looks like an artificial market pump.
Macro threats: The AI boom will face energy shortages.
Historical parallel: The scenario mirrors Cisco's pre-dot-com bubble.
Fierce competition: AMD, Intel, and cloud giants are creating their own chips.
Growth drivers:
Leadership in AI, a closed CUDA ecosystem, and 66% data center revenue growth.
Nvidia is a leader, but its shares have become a high-risk asset. Any slowdown in business performance will lead to a collapse in the stock price.
The baseline scenario is a broad sideways trend.

NVIDIA at a Critical Trendline: Bounce or Breakdown?Price is sitting exactly on a major long-term uptrend line. This area will decide whether the bullish trend continues or a deeper correction begins.
Bullish Scenario
If price holds above 182–185:
• Target 1: 195
• Target 2: 205–210
• Stop-loss: Daily close below 180
Bearish Scenario
If price closes below 180:
• Target 1: 165
• Target 2: 150
• Stop-loss: Close back above 187
Short Fundamental View
• NVIDIA remains the leader in AI chips.
• Demand from data centers remains high.
• But valuation is extremely stretched at all-time highs, so downside risk exists if growth slows.

Long trade
🟩 Buy-Side trade
Pair: NVDA
Date: Mon 1st Dec 2025
Time: 12:30 pm
Session: NY Session PM
Entry: 180.25
TP: 195.71 (8.57%)
SL: 178.54 (0.949%)
RR: 9.04
🟦 STRUCTURE
NVDA formed a bullish MSS → BOS on the 1H
Price retraced into discount (0.618 fib region)
Strong displacement candle confirmed the long bias
FVG inside retracement zone provided algorithmic entry logic
Target aligns with HTF premium zone around 195–200
🟨 LIQUIDITY
Sweep of sell-side liquidity beneath 178.50–179.00
Inducement engineered before bullish expansion
Upside liquidity magnets:
187.80 (0.382 retracement)
195.70 HTF equilibrium level
Gap above → likely draw-on-liquidity
Large volume cluster supports bullish continuation
🟧 SENTIMENT
NVDA remains fundamentally bid due to AI/semiconductor strength
Broader tech sector showing rotation back into high-beta names
NY PM session typically generates continuation moves
Market repricing risk-on after morning volatility clearance
