OXY updateI expect the price to break above the resistance of 70.65 and goes higher , first to 75 then higher this year.
Trade ideas

OXY LONGMassive base around historical trendline
Good zone to buy the dips till 55.85
Indicators oversold and bullish divergence.
Warren Buffet bought more $2.5 million value shares this weekend.
Medium term target is $75
Long term $140+

Well DUH...Inverse Head and Shoulders printing on the WEEKLY TIME FRAME
No worries here. Got my bags loaded and waiting on this baby
to fly...looking for OIL per BARREL to TRIPLE almost overnight
in 2025 after "BLEEEEEEEP" gets a serious spanking.
*************** NOT FINANCIAL ADVICE*****************

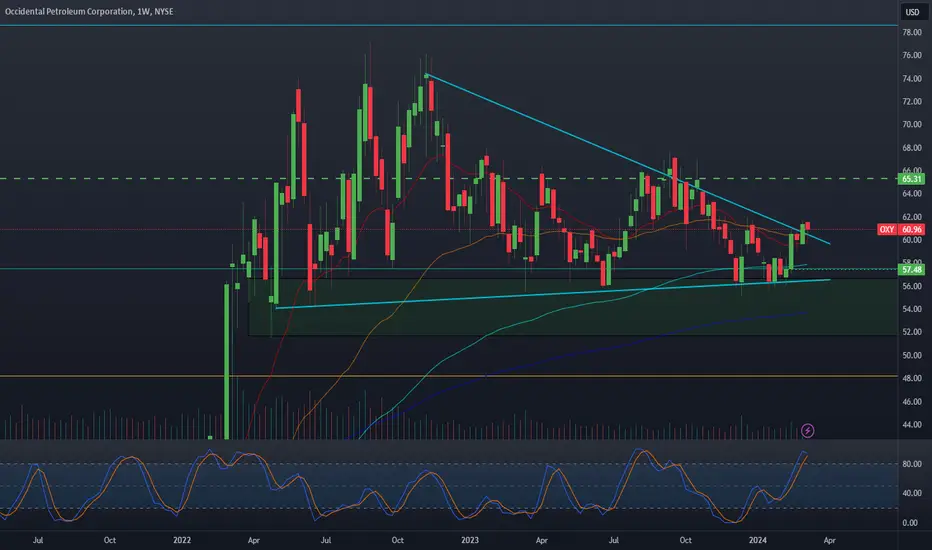
OXY - retesting for the massive move!!Oxy has been in an uptrend for the last few months while consolidating within the triangle. We have recently broken out and are in motion for the retest. Expect a bounce to break out of the greater down trend before we shoot to the stars.

Mean Reversion First then Go LongOXY is very extended relative to its moving average ribbon. But the breakout looks promising for a long. Look for consolidation for a few days or a pull back to its 13 EMA to enter long on the the multi year breakout. I traded the fake breakdown on a recession signal a few months ago and now its time to trade the possible breakout on more inflation!
To be clear if the pull back doesn't happen I wont chase. Let it reload first. If not There are lots of other tickers out there.

OXY should bounceI am expecting oil and Oxy stock to bounce here. Oxy finds itself on the 100 EMA which serves as support on pivots and overall up trending assets. A historic bottom of the stochastic RSI is marked in dashed red as well. This stock is very oversold here after the tremendous rally. This is actually my best trade of the year, those 70$ Jan 2025 calls made me bank and I still have 33% of my position riding. The question now is do I add here?

Is this retracement the opportunity to buy? 🤔 Price target $117Is this retracement the opportunity to buy? 🤔
If Warren Buffett owns it so should we 🚨
Price should bounce if it retraces to the bull flag breakout point.
We have mapped predicted price movement.
Our upside price target is $117.
Will you be buying if we retrace further?

OXY expect bounceOXY had a doji reversal candle on the weekly with a body pretty close to the center, not tremendously bearish long term but definitely made sense for a pullback. There is a ton of historical price action here and I expect a bounce and continuation around this level. My target for the year of 74+ dollars remains.
-I did sell 66% of my 70$ Jan 2025 calls on the major pump
-I will keep my last 33% to keep exposure to this stock and the oil sector.

OXY - a bullish setup for the agesOXY is on the verge of breaking through a major resistance line which was first touched over a decade ago. As the daily chart repeatedly bumps up against, but not crossing, this key resistance line, multiple factors make OXY a screaming buy.

OXY LONGOXY here on a weekly trendline
Bullish here at $56 to target 90.81 within a few months
Personally grabbed Jan 2025 calls
I think we either get a DIRECT bounce from this spot, OR we see a failed breakdown scenario first, but ultimately the target is the same.

OXY Gap Retrace and GoSimple Gap N Go on a nice Fib retracement, Gap might fill but will place stop below previous day low

OXY breakout to all time highFractal move from previous all time high could play out ( blue 🔵 line). Also we can see a breakout from a bull flag that could take us to all time hight now that the energy sector is heating🌡️up. In the shorter term we see a minor retracement to recent break out support line that was previously resistance. Upper Bollinger band is current short term resistance point

OXY at an APEXOXY has converging lines of resistance and support. Usually this means big move incoming. Waiting until a break and retest before entering.

Immediate buy on OXY!🔉Sound on!🔉
Thank you as always for watching my videos. I hope that you learned something very educational! Please feel free to like, share, and comment on this post. Remember only risk what you are willing to lose. Trading is very risky but it can change your life!

Update on OXY tradeI have decided to cover my initials since I am up 500$ per contact on these 70$ Jan calls. I am able to utilize this cash for more CLSK limit orders on the dip. I plan on keeping the other 66% of my OXY calls until at least my initial yearly target of 74$. I will then layer out and lock in the win. Congrats to anyone who used demand zones to buy into this exceptional trade, calling the CL (oil) bottom was also pivotal to this.

OXY hit first targetMy first target for the year just hit on OXY, my setup is 70$ calls in Jan. I plan on holding these longer since the oil reversal was so strong. My next target is 73.5$ which was my hopeful target for the year, but at this rate OXY could hit 80 plus dollars. This slow accumulation and dip into demand over and over is what caused this move, this alongside the oil reversal.
-I plan on holding my Jan calls until deep ITM if possible, I will definitely sell the contracts in the winter.

OXY Imminent Breakout This is a multi-year consolidation here that is on the cusp of breaking out.
Oxy over 66 triggers a breakout move into 73.14 where a multi-decade trend line will be tested. If bulls overcome that level the next target is 90.71
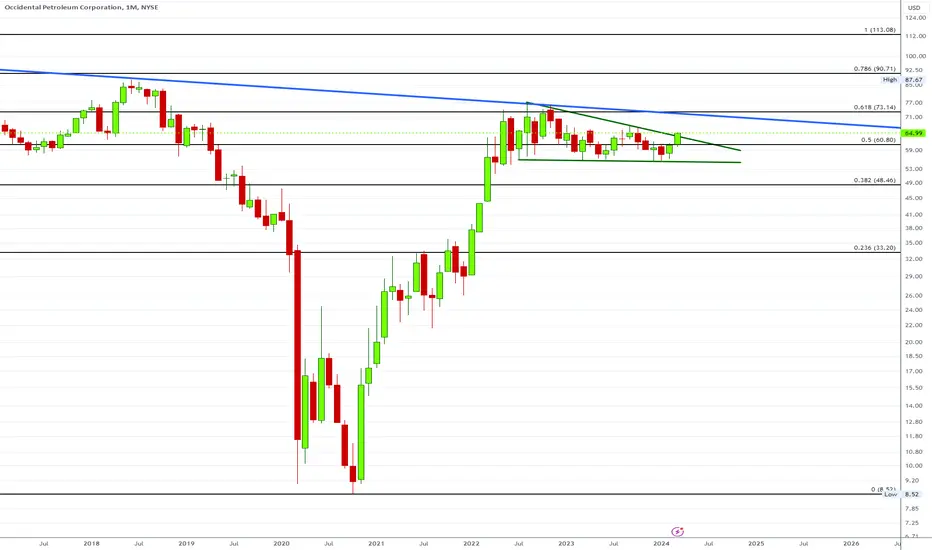
Oxy is THE setup of the decade.I do not think it is too late to reap the rewards, And I do not think there will be better opportunities to enter ever again. I believe oil is starting its third wave.
Bullish engulfing candle on the weekly here, and also on USOIL.
Long term support held, and failed to break down. There will be consequences for bears.
I think it is important to own an oil company with most of its exposure in the USA. This is the only land that cannot be negatively influenced by geo-political risk.
Other oil bulls appear to include - Warren Buffet, and Rick Rule.
I have included a fractal, they rarely play out exactly, but they serve as a rough guide to future expected price action.
My cost basis for this stock is 57.15, but i will be re-investing dividends over time.

OXY: Potential BuySeems like double bottom could be forming after rejecting a major S/R zone. Trend line as a first target. Final target at $66,7.

OXY updateOXY confirmed the wedge breakout on the weekly. I have a bunch of 70$ calls for Jan 2025, I wanted to tie up less capital to bet on oil prices increasing. This is the benefit of options vs spot. I can risk less money for more upside than just buying spot. Breakouts on longer-term time frames are much more reliable than lower term.
-Price targets remain 65$ short term
-74$ for the yearly

Stocks pairs trading: FANG vs OXYExploring the financial indicators and market behaviors of Occidental Petroleum Corporation (OXY) and Diamondback Energy, Inc. (FANG) offers crucial insights for investors looking to optimize their investment strategies in the energy sector. This analysis highlights the strengths and weaknesses of these companies, guiding investors towards making informed decisions that align with their investment goals.
Reasons to Consider Buying FANG Over OXY:
Valuation: FANG's P/E ratio of 10.52 is more attractive than OXY's P/E ratio of 15.51, suggesting FANG may be undervalued relative to its earnings potential. This could indicate a more compelling investment opportunity for value-seeking investors.
Forward P/E: With a forward P/E of 8.91, FANG is positioned as more favorably valued than OXY, which has a forward P/E of 13.83. This points to analysts expecting FANG's earnings to grow more efficiently compared to its current valuation, presenting a stronger future outlook.
Dividend Yield: FANG offers a higher dividend yield, with estimates ranging up to 4.51%, compared to OXY's estimated yield of up to 1.37%. This higher yield suggests FANG is more committed to returning value to shareholders, making it attractive for income-focused investors.
Market Performance: FANG has demonstrated superior performance metrics over the past year, including a year-to-date increase of 19.07% compared to OXY's more modest 1.41%. This outperformance underscores FANG's stronger market position and investor confidence.
Profit Margin: With a profit margin of 37.09%, FANG significantly outpaces OXY's margin of 13.24%. This higher profit margin reflects FANG's more efficient operations and superior ability to convert sales into net income, highlighting its operational excellence.
Growth Prospects: Despite a higher EPS growth next year projected for OXY, FANG's overall market performance, including its performance quarter-over-quarter and year-over-year, along with its strategic position within the energy sector, suggest that it has robust growth prospects. FANG's resilience and ability to adapt to market dynamics make it a potentially stronger investment in the long run.
Decision:
Buy 1 FANG: Considering FANG's lower valuation, higher dividend yield, superior profit margins, and impressive market performance, it emerges as a compelling buy. Its strategic market position and potential for future growth offer an attractive proposition for investors looking to capitalize on the energy sector's opportunities.
Sell 3 OXY: Given its higher valuation, lower dividend yield compared to FANG, and less impressive recent market performance, reallocating investments from OXY to more promising opportunities like FANG could enhance portfolio returns. While OXY shows potential for future EPS growth, FANG's overall financial health and market position suggest a more favorable investment outlook, providing a stronger case for investment reallocation.

OXY Ready to run?OXY is defending a major support once again after completing a bullish shark 2 months ago.
We are bullish on US Oil already and these stocks are looking ready also.
Bullish convergence at a major support level with a completed type 2 Bullish Shark.

OXY tests breakoutOXY and oil in general have been on a major upswing these last few weeks. This wedge I have been following for a while looks to be doing the retest on a breakout here. I have a moderate sized position in Jan 70$ calls for this wedge setup
- My first target is marked with dashed green at 65$
- My target for the year remains 74$