PANW Positioned to Pop?Palo Alto Networks is one of the most important companies in modern network and cloud security. As the digital world expands and AI-driven systems become central to business operations, corporations are investing heavily in cybersecurity to protect themselves from increasingly sophisticated threats.
Palo Alto works with major global names such as Amazon, Alphabet, Microsoft, Nvidia, and countless Fortune 500 companies. Around 75–80% of its revenue comes from recurring subscriptions, making its income highly predictable and sticky. Many customers are locked into 3–5 year contracts, and the company also secures multi-year deals with federal and military agencies. Fundamentally, Palo Alto remains one of the strongest cybersecurity companies in the sector.
Technical View
NASDAQ:PANW is currently trading inside a clear ascending channel and is now sitting near the lower boundary support of that channel. If this support holds, it could offer an attractive risk-reward opportunity.
However, for higher-probability confirmation, I would personally wait for:
- A bullish MACD crossover, and
- A recapture of the 200-day EMA, signaling a stronger trend reversal.
If those conditions align, Palo Alto looks like a compelling long-term buy in an AI-driven economy where cybersecurity is becoming non-negotiable.
Palo Alto Networks, Inc. Shs Cert Deposito Arg Repr 0.02 Sh
No trades
Trade ideas

LONG PANW ~185-188 - Targeting 210-215After the earnings report and a series of acquisitions the company made, the stock was volatile to the down side as investors had some concerns about the future estimates of revenue.
Fundamentally, Palo Alto is a market leader in the cybersecurity industry, and it is basically controlling that market. now with the acquisition of cyberark, the potential of the company the even wider its grip on the market - is even bigger. I think that this stock can go even higher.
Technically speaking, we can see that buyers decided to step in on the ~180 level. this is a very strong support level for this stock, it has been tested several times and the stock was trading and bouncing from this level multiple times.
If the market will push higher, there is no reason for that stock to not go back to trade above 200, and I expect that move to happen in following week or two.
Stop should be placed bellow 180 level, as if we go back to test this price range, we can assume that this was a false move upwards.
BH

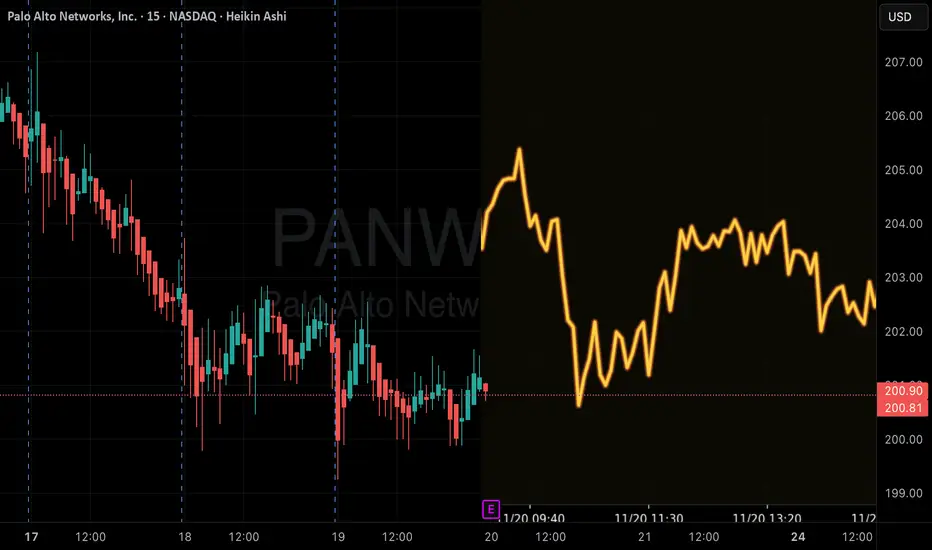
PANW Short-Term Reversal CALL – High-Probability SetupPANW QuantSignals V3 – Short-Term CALL Trade (2025-11-19)
Trade Signal:
Direction: BUY CALLS (Long)
Strike Price: $202.50
Entry Range: $6.20–$6.40 (mid $6.30)
Target 1: $9.30 (50% gain)
Target 2: $12.40 (100% gain)
Stop Loss: $4.65 (25% risk)
Expiry: 2025-11-21 (2 days)
Position Size: 2% of portfolio
Confidence: 65% (Medium)
Market Analysis:
Trend: Katy AI shows NEUTRAL trend with slight downward bias (-0.32% over prediction period)
Price Action: Current $201.10 near session lows, bearish momentum (ROC: -5.62%)
Technicals: RSI 26.4 (oversold), resistance $203.99, support $199.00
Options Flow: Bullish, Put/Call Ratio 0.48, institutional call interest at $245 strike
News Sentiment: Positive – IBM quantum-safe partnership, strong earnings focus
Volatility: Medium – technical bounce potential from oversold levels
Competitive Edge:
Oversold RSI + strong call flow creates a high-probability reversal setup
2-day expiry captures potential short-term bounce
Tight stop limits downside while allowing technical reversal play
Risk Notes:
Katy AI neutrality with slight bearish bias requires careful monitoring
Earnings not until 2026-02-11 – this is a technical/reversal trade, not earnings-driven
Low volume (0.8x average) suggests position size should be moderate
Strategy Rationale:
Overrides Katy AI neutrality due to strong technical and options flow evidence
Bullish reversal opportunity supported by oversold RSI, institutional calls, and positive news
Quant Signals V3 PANW Earnings – Bullish Calls Ahead of CatalystPANW Earnings Signal | 2025-11-18
Instrument: PANW
Date: 2025-11-18
Signal Type: Earnings (Pre-Earnings Position)
Model: QuantSignals V3
Direction: Calls
Confidence: 58%
Conviction: Low
Earnings Date: 2026-02-11
Earnings Estimate: $0.95
Expiry: 2025-11-21
Options Setup
Strike Focus: $202.50
Entry Range: $7.60
Implied Move: $15.17 (7.5%)
Profit Target: $11.40
Stop Loss: $5.70
PCR (Flow Intel): 0.94 (neutral)
24h Move: –1.59%
Volume: 0.5× average (low liquidity)
Price & Technicals
Current Price: $202.11
Katy Prediction Range: $201.03 – $202.51 (neutral / mild bearish)
Trend Classification: Neutral
RSI: 29.1 (oversold)
MACD: +0.8311
Momentum (ROC): –5.79%
24h Range: $199.81 – $207.19
Support: $199.81
Resistance: $207.19
AI Forecast (Katy Model)
• Short-term rangebound movement
• Mild bearish drift despite overall neutral signal
• Composite directional signals tilt toward calls based on fundamentals
Fundamental & News Notes
• Strong long-term revenue growth (2627%)
• Multiple analyst upgrades (targets: $230, $250)
• Positive expectations for platform expansion and demand rebound
• Market sentiment moderately bullish despite short-term weakness
Options Flow
• PCR 0.94 = neutral flow
• Notable unusual activity at $235 calls (institutional interest)
• No strong directional dominance in near-term strikes
Risk Notes
• High risk due to low confidence (58%)
• Neutral AI signal with bearish momentum
• Low volume (0.5×) reduces conviction
• 3-day expiry increases time-decay pressure
• Pre-earnings pressure may create a discount but increases uncertainty

PANW Rose 55% in Six Months to Record Highs. What Its Chart SaysAI-powered cybersecurity giant Palo Alto Networks NASDAQ:PANW recently hit an all-time high after rising some 55% from its April lows. What does its chart and fundamental analysis say ahead of this week's fiscal Q1 earnings report?
Let's take a look:
Palo Alto Networks' Fundamental Analysis
PANW plans to report results after the bell on Wednesday for the three months ended Oct. 31. The company will bat leadoff among major cybersecurity stocks, with rivals Zscaler NASDAQ:ZS reporting results next week and CrowdStrike NASDAQ:CRWD the week after that.
That said, Cisco Systems NASDAQ:CSCO -- whose primary business is networking, but whose second-largest operation is security -- last week reported a 2% year-over-year contraction in security revenues, although CSCO posted a very good quarter overall. I'm not quite sure what the portends for PANW's earnings, but it bears keeping in mind.
As I write this, the Street's consensus estimate for Palo Alto Networks calls for the firm to report $0.89 in adjusted earnings per share on roughly $2.5 billion of revenue. That would represent a sharp contraction from PANW's year-ago print of $1.56 in adjusted EPS, but about a 15% gain from fiscal Q1 2025's $2.1 billion in revenue.
All told, 35 of the 46 sell-side analysts that I know of who cover PANW have increased their earnings estimates since the quarter began, while only one analyst has revised their estimate lower. (Ten have left their forecasts unchanged.)
Palo Alto Networks' Technical Analysis
Now check out PANW's chart going back approximately one year and running through last Tuesday:
I'd be lying if I were to say that looking at this chart, I'm not concerned about PANW's short-term future.
Readers will see that from late 2024 into early 2025, PANW developed a double-top pattern of bearish reversal, as marked with two red boxes, a jagged red line and pink shading at the chart's left.
Technically speaking, this pattern worked like a charm, with PANW falling some 30% from a $208.39 February high to a $144.15 April low.
Then this past spring, the stock developed a rising-wedge pattern of bearish reversal, as noted in the above chart's center.
Once again, this pattern worked like a charm. PANW fell some 21% in a matter of weeks from a $210.39 July peak to a $165.21 August low.
Next, Palo Alto Networks put together yet another rising-wedge pattern of bearish reversal from August into late October, as denoted at the above chart's right.
Since then, PANW has fallen 9.3% between hitting a $223.61 all-time intraday high on Oct. 28 and closing on Monday at $202.90.
All in, this stock has repeatedly developed bearish patterns over the past year -- and so far, these set-ups have preceded fairly sharp sell-offs. In fact, PANW is currently struggling with its latest bearish pattern ahead of earnings.
The stock has recently been testing its 50-day Simple Moving Average (or "SMA," marked with a blue line at $208.60) from above. That $208.60 level now represents the stock's downside pivot, and PANW closed below that on Friday and Monday. Meanwhile, PANW's $223.61 Oct. 28 record high might be the stock's upside pivot.
Readers will also see that Palo Alto Networks' Relative Strength Index (the gray line at the chart's top) is still neutral, but appears to be weakening.
Similarly, the stock's daily Moving Average Convergence Divergence indicator (or "MACD," marked with black and gold lines and blue bars at the chart's bottom) is sending some bearish signals.
The histogram of the 9-day Exponential Moving Average (or "EMA," denoted by blue bars) is below the zero-bound and has been for most of the past six weeks. In addition, the 12-day EMA (the black line) moved below the 26-day EMA (the gold line) in early November, and both of those lines have moved towards zero from above.
An Options Options
As I write this, the options market is pricing in a roughly 6.5% move in PANW's share price in response to the company's upcoming earnings. With Palo Alto Networks trading at about $203 recently, a 6.5% move would put the shares in a roughly $190-$216 range.
Some option traders who are neither bullish nor bearish on PANW might look to take advantage of any greater-than-expected post-earnings move by the stock by employing a so-called "long strangle." That consists of simultaneously buying a call with a higher strike price and a put with a lower strike price, with both having the same expiration date.
Conversely, some options traders who expect PANW won't move that much at all around this week's earnings might use what's called a "short strangle" to attempt to take in some premium. A short strangle consists of simultaneously selling a call with a higher strike price and a put with a lower one -- again, with both contracts having the same expiration date.
Here's an example of a short strangle:
-- Selling one PANW $195 put with a Nov. 21 expiration date (i.e., after the earnings release). This would cost about $3.70 at recent prices.
-- Selling one Nov. 21 PANW $215 call for about $3.70.
Net credit: $7.40
Should the shares not trade outside of the $195-$215 range at expiration, the options would expire worthless and the trader would keep the $7.40 net credit above.
But on the downside, an options trader faces two risks at expiration with this trade.
First, the person could end up owning 100 PANW shares at a $187.60 net basis at a time when the shares are trading below $195.
Conversely, the trader risks being short 100 PANW shares (with theoretically unlimited risk) at a $222.40 net basis when the shares are trading above $215.
Moomoo Technologies Inc. Markets Commentator Stephen "Sarge" Guilfoyle was long PANW and CRWD at the time of writing this column.)
This article discusses technical analysis, other approaches, including fundamental analysis, may offer very different views. The examples provided are for illustrative purposes only and are not intended to be reflective of the results you can expect to achieve. Specific security charts used are for illustrative purposes only and are not a recommendation, offer to sell, or a solicitation of an offer to buy any security. Past investment performance does not indicate or guarantee future success. Returns will vary, and all investments carry risks, including loss of principal. This content is also not a research report and is not intended to serve as the basis for any investment decision. The information contained in this article does not purport to be a complete description of the securities, markets, or developments referred to in this material. Moomoo and its affiliates make no representation or warranty as to the article's adequacy, completeness, accuracy or timeliness for any particular purpose of the above content. Furthermore, there is no guarantee that any statements, estimates, price targets, opinions or forecasts provided herein will prove to be correct.
Options trading is risky and not appropriate for everyone. Read the Options Disclosure Document (j.moomoo.com) before trading. Options are complex and you may quickly lose the entire investment. Supporting docs for any claims will be furnished upon request.
Options trading subject to eligibility requirements. Strategies available will depend on options level approved.
Maximum potential loss and profit for options are calculated based on the single leg or an entire multi-leg trade remaining intact until expiration with no option contracts being exercised or assigned. These figures do not account for a portion of a multi-leg strategy being changed or removed or the trader assuming a short or long position in the underlying stock at or before expiration. Therefore, it is possible to lose more than the theoretical max loss of a strategy.
Moomoo is a financial information and trading app offered by Moomoo Technologies Inc. In the U.S., investment products and services on Moomoo are offered by Moomoo Financial Inc., Member FINRA/SIPC.
TradingView is an independent third party not affiliated with Moomoo Financial Inc., Moomoo Technologies Inc., or its affiliates. Moomoo Financial Inc. and its affiliates do not endorse, represent or warrant the completeness and accuracy of the data and information available on the TradingView platform and are not responsible for any services provided by the third-party platform.

PANW - Palo Alto Earnings Setup for This WeekHello Everyone , Followers,
PANW - Palo Alto Networks will release its financial reports on Wednesday after market closed. I would like to share my view and follow up level depends on good and bad reports
Bullish Scenario
If earnings beat + guidance strong → next target: 224 - 226
Bearish Scenario
Weak numbers → potential drop to between 185 - 187
🔹 Key Support Zones
First support: 199.50
Deeper support: 186.80
🔹 Resistance Levels
Main resistance: 210 - 211
Breakout target: 227 - 228
🔹 Outlook
As long as It stays above 199.50 - 200.00 , momentum remains bullish.
A breakdown below that level could open the door for a deeper pullback. This is depends on Results of financial reports.
🔹 My Plan
I will wait for the financial report before i buy it . With a bearish scenario my buy level is between 211-212 .
If it can achive to stay above 199.50 and if you like to take a risk then you can buy it above this level before the Reports released.
If you enjoy and like clean, simple analysis — follow me for more.
Have a lovelly and Sunny Weekend to all.

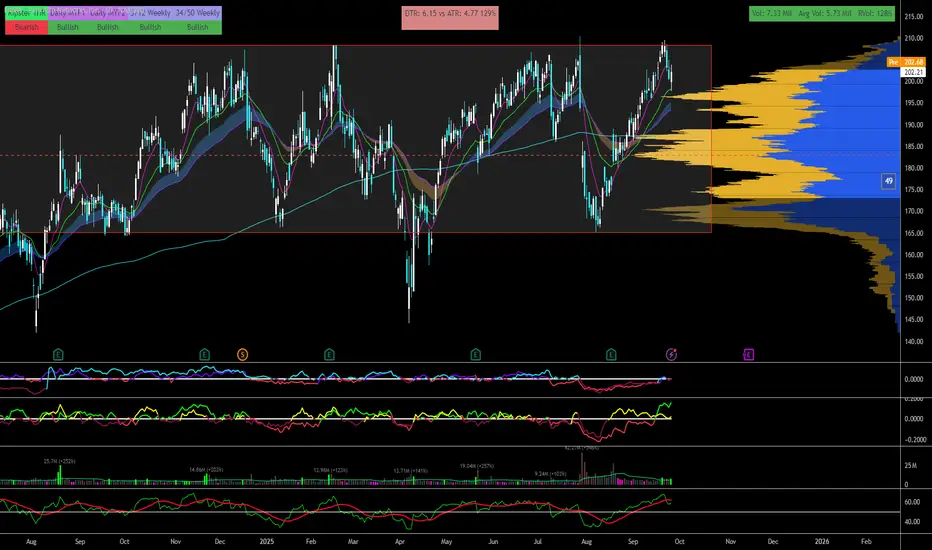
ATH Breakout Setup with Psych 200 and 2 year consolidationThe last breakdown from ATH happened before their earnings for some acquisition news.
It recovered quite quickly since August and tested ATH again in September. Now sitting at 21ema
Whats good here?
+200 Psych level under us
+Big Volume shelf VRVP and Support $196.75
+Above all significant MAs
+2 year of consolidation in this Range Box
+this cloud/security/software sector has been taking a back seat with AI push but its consolidated very nicely in the last few months
What we need for the Swing confirmation?
+Earnings can be a catalyst or some news that can bring the shift
Plan
+Adding 1/3rs size now and will scale up if it holds 200
+Risk vs 196 will bail if vrvp wont hold
Manage risk first and profits will take care of themselves
Palo Alto Networks: Pullback Follows New All-Time HighPalo Alto initially climbed to a new all-time high, but the upward momentum soon faded, leading to a notable pullback. However, we expect the stock to recover soon and, as part of the magenta wave (3), break through resistance at $232.29. The following waves (4) and (5) are also projected to develop above this level, further fueling the ongoing upward trend. That said, we still see a 37% chance that PANW will instead complete (or has recently completed) turquoise wave alt.B below the $232.29 mark. In that scenario, wave alt.C could trigger sell-offs to a new low for magenta wave alt.(2) , though support at $139.18 should remain intact.

PANW QuantSignals V3 Weekly 2025-11-05PANW QuantSignals V3 Weekly 2025-11-05
PANW Weekly Signal | 2025-11-05
• Direction: BUY PUTS | Confidence: 65%
• Expiry: 2025-11-07 (2 days)
• Strike Focus: $212.50
• Entry Range: $2.44
• Target 1: $3.66
• Stop Loss: $1.71
• Weekly Momentum: BEARISH (-1.23% 1W)
• Flow Intel: Bearish (High P/C Ratio) | PCR 2.77
• Max Pain: $212.50 (+0.4% vs spot)
• ⚠️ MODERATE RISK WARNING: Consider reducing position size due to moderate confidence level.
⚖️ Compliance: Educational commentary for QS Premium members only. No financial advice.
🎯 TRADE RECOMMENDATION
Direction: BUY PUTS
Confidence: 65%
Conviction Level: MEDIUM
🧠 ANALYSIS SUMMARY
Katy AI Signal: Neutral with 50% confidence, but targets $218.46 with stop loss at $208.48, suggesting upward bias with tight risk control
Technical Analysis: Current price $211.65, weekly momentum BEARISH (-1.23%), EMA alignment confirms downtrend, range position at 13.7% suggests room for further downside
News Sentiment: No major catalysts identified - market driven by technical factors and options positioning
Options Flow: Extremely bearish with Put/Call Ratio of 2.77, heavy put buying activity, high volume at $208 puts, Max Pain at $212.50 (+0.4% vs spot)
Risk Level: MEDIUM - 2-day expiry creates time decay risk, but strong options flow signals provide edge
💰 TRADE SETUP
Expiry Date: 2025-11-07 (2 days)
Recommended Strike: $212.50
Entry Price: $2.21 - $2.66 (mid: $2.44)
Target 1: $3.66 (50% gain from entry)
Target 2: $4.88 (100% gain from entry)
Stop Loss: $1.71 (30% loss from entry)
Position Size: 3% of portfolio
⚡ COMPETITIVE EDGE
Why This Trade: Strong options flow divergence (PCR 2.77) combined with technical bearish momentum and Katy's tight risk parameters
Timing Advantage: Mid-week positioning with Max Pain acting as resistance near current levels
Risk Mitigation: Katy's stop level at $208.48 provides natural exit point if trade reverse
Image
QS Analyst
APP
— 5:33 PM
s
🚨 IMPORTANT NOTES
Katy AI shows neutral signal (50% confidence) but technicals and options flow strongly favor puts
2-day expiry creates significant time decay - trade requires quick momentum
VIX rising (18.01) supports option premium expansion
Monitor for any breaking news that could disrupt technical patterns
📊 TRADE DETAILS 📊
🎯 Instrument: PANW
🔀 Direction: PUT (SHORT)
🎯 Strike: 212.50
💵 Entry Price: 2.44
🎯 Profit Target: 3.66
🛑 Stop Loss: 1.71
📅 Expiry: 2025-11-07
📏 Size: 3.0
📈 Confidence: 65%
⏰ Entry Timing: N/A
🕒 Signal Time: 2025-11-05 20:33:01 EST
⚠️ MODERATE RISK WARNING: Consider reducing position size due to moderate confidence level.

Inverse head and shouldersThe price has completed the formation of an inverse head and shoulders pattern, closing Friday above the neckline ($212), marked in blue.
The breakout occurred on very low volume, so caution is advised due to the risk of a potential reversal.
The stock has already reached a P/E ratio of 135, so I’m not attaching any long/short bias to this idea.
I recommend waiting for a pullback to retest the neckline before considering a potential long entry.

$PANW all time highs break now looking for $225 and $240PANW - stock finally breaking and holding above $210 level, Stock hitting all time highs today. looking for bigger move here. Stock has next resistance at $225 and $240. looking for those price targets to hit. Stock is decent at the indicator level.
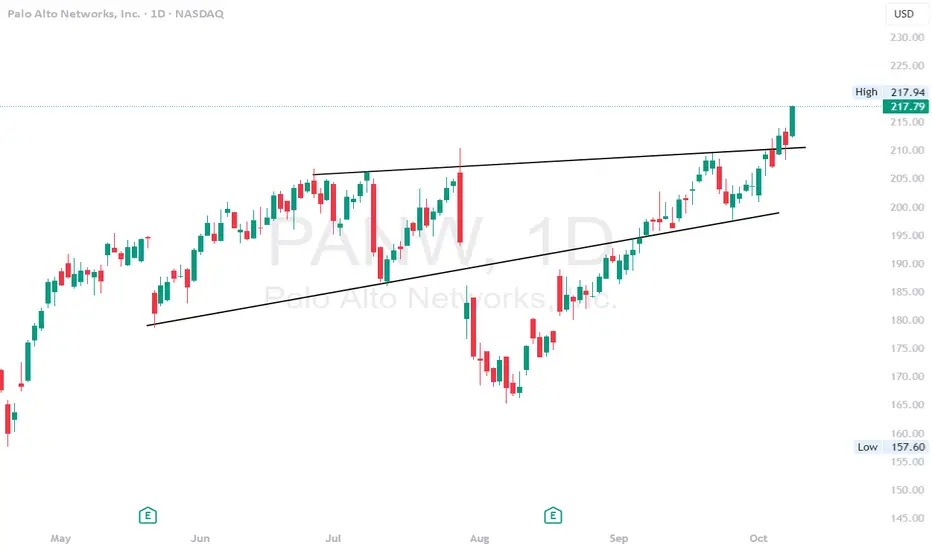
PANW - all time highs break here more upside possiblePANW - Stock hitting all time highs today after finally holding trendline resistance breakout on the daily. calls above $213.50 looking good here for a move towards $225 and higher. Stock needs to hold $210 critical support level. on high watch this week

$PANW next big mover $250+?If you look at the chart, you can see that PANW has formed a large inverse head and shoulders, a move above the resistance line should produce a huge move to the upside.
I have no clue what causes the move, but breaking $207.50 should trigger a move to the upper resistance levels.
Let's see if it plays out.

PANW eyes on $191: Dual-Fibs may give dip to catch the TrainPANW got a nice boost from the last earnings report.
Secondary Wave just hit a resistance zone $191.26-191.72
Look for a Dip-to-Fib or Break-n-Retest to catch the train.
.
See "Related Publications" for other PRECISE and TIMELY charts
======================================================
.

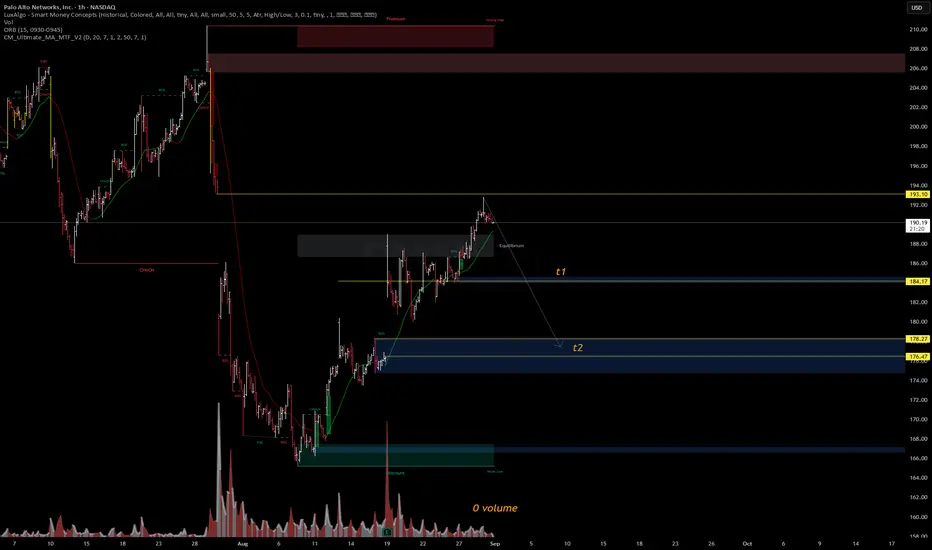
PANW Probabilistic Outlook (30D Horizon)🔮 PANW Probabilistic Outlook (30D Horizon)
Current Price: $190.16
📉 Forecast Models
WaverVanir DSS → 15D: $182.44 (-4.5%), 30D: $191.78 (+0.4%)
Institutional Model → Target: $179.18 (-5.8%), Signal: Strong Sell
📊 Options Flow
Heavy put sweeps at 185 (Sep 5) = bearish bias
Light call activity at 192.5, but outweighed by puts
📐 Technical Levels
Resistance: $193.10
Support: $184.17 (T1) → break here likely sends price toward
$178.87–176.47 (T2) = high-probability magnet
🧮 Probability Scenarios (Next 30 Days)
Bearish (55–60%) → Break below $184, test $179–176
Neutral/Range (25–30%) → Consolidation $186–194
Bullish (10–15%) → Breakout > $194, possible retest $200+
⚖️ Summary
Models + options flow tilt bearish. Unless bulls reclaim $194, downside toward $179–176 is the path of least resistance.
PANW Long to close the gap after earnings next Aug 18Because of the fall of NASDAQ:PANW was due to the acquisition of CyberArk and as sympathy fall from NASDAQ:FTNT but not because of fundamental reasons or sector/market issues, I used 1 year Fib Retracement to see what would be the worst bottom and best probability bounce taking in consideration that earnings will be very soon (Aug 18) and every short position will be most likely covered before earnings and the stock price taking a more down neutral level to go up or down after earnings.
So, considering this risk reward factors, last August 07th, when the stock went down to $166, I bought one Call Option OCT17 175 @7.75 just because this is the first time I trade this stock and it's not very liquid, and theta decay was less than -8, so I decided to place a swing trade and needed an option with low theta decay but maintaining 0.50 Delta.
The next day I say a Big Delta Long Vertical Trade made from a larger investor:
SELL -5,000 PANW 17OCT25 195 @2.82
BUY +5,000 PANW17OCT25 180 @6.45
That gave me more patience to wait for the bounce because the stock wasn't having the hard bounce I expected right away but someone invested almost 2 millions in this trade, which can be confirmed as Open Interest in the options chain.
Because this company has slightly beaten earnings expectations in the last quarters, and until now, there are no downgrades justifying the current price level:
UBS maintains Neutral at $185 lowering the PT from $200
Piper Sandler Upgraded PT from $200 to $225
And almost all ratings from the last months were in the bullish side.
I think the stock will close the gap after earnings around $195 where the explanation on how the CyberArk acquisition will be in the long term something beneficial, although this stock won't go back soon to its higher $210 price, I will expect a drop in the following days after earnings to around $180.
I'll close my position around $180 Before earnings or around $190 After earnings.

A Move Up For $PANWHere you'll see two projected paths for $PANW. #1) If price can stay above 186.92 it should continue to fill gap up to 193.68. Now there is a small gap below at 178. #2) if it can't break above these moving averages then it has potential to retrace, fill lower gap before a move up.
My short term play is 9/19 $190 calls to 193 and leave a runner to resistance at orange block $204

PANW Earnings Surge Incoming: 180C Call Targeting 300%
# 🛡️ PANW Earnings Options Play – 8/22 AMC
📊 **Market Context**
* Revenue Growth: +15.3% YoY 📈
* Gross Margin: 73.6%, Operating Margin: 9.8%
* Forward EPS: \$7.20 → historically beats 8/8 quarters
* Sector Tailwinds: Cybersecurity demand surging, favorable macro trends
📈 **Options Flow**
* Call volume strong at \$200 strike → institutional bullish
* Put/Call Skew: Slight bearish hedge → anticipating large move
* IV Rank: 70% → favorable premium pricing
📉 **Technical Momentum**
* Trading below 50 & 200 DMA → oversold sentiment
* RSI: 32.78 → oversold, potential sharp reversal
* Support: \$175 | Resistance: \$180 / \$185
---
## 🎯 Trade Setup (Pre-Earnings Call)
* **Instrument**: PANW
* **Direction**: CALL (LONG)
* **Strike**: \$180.00
* **Expiry**: 2025-08-22
* **Entry Price**: \$5.20
* **Profit Target**: \$15.60 (\~300% potential)
* **Stop Loss**: \$2.60 (50% of premium)
* **Size**: 1 contract
* **Confidence**: 75%
* **Entry Timing**: Pre-earnings close
* **Earnings Date/Time**: 8/22 AMC
* **Expected Move**: \$6.50
---
## 🧠 Key Notes & Risk Management
* **Position Sizing**: Limit 2–3% of portfolio
* **Exit Scenarios**:
* Target hit → exit at \$15.60
* Stop triggered → exit at \$2.60
* Time exit → close by 11 AM ET post-earnings if neither condition met
* **Gamma & Volatility Risk**: High around earnings, monitor closely
---
# ⚡ PANW 180C EARNINGS PLAY ⚡
🎯 Entry: \$5.20 → Target: \$15.60
🛑 Stop: \$2.60
📅 Exp: 8/22 AMC
📈 Bias: Moderate Bullish (75%) 🐂
---
📊 **TRADE DETAILS JSON**
```json
{
"instrument": "PANW",
"direction": "call",
"strike": 180.0,
"expiry": "2025-08-22",
"confidence": 75,
"profit_target": 15.60,
"stop_loss": 2.60,
"size": 1,
"entry_price": 5.20,
"entry_timing": "pre_earnings_close",
"earnings_date": "2025-08-22",
"earnings_time": "AMC",
"expected_move": 6.5,
"iv_rank": 0.70,
"signal_publish_time": "2025-08-18 14:05:22 UTC-04:00"
}
```

PANW: 3 day's rule!🔑 Key Levels (from chart)
Support (bull trigger): $180.4 equilibrium
Immediate resistance: $186 supply zone
Upside target: $193.5–195 gap-fill
Bear case: Breakdown below $180 → $174 → $166
📈 Bullish Play – Gap Fill to $195
Buy Calls
Strike: $185 or $190 Calls
Expiry: 2–3 weeks out (Sep 5–12, 2025) to allow move.
Target exit: $193–195 zone.
Stop-loss: If PANW closes < $179.
Call Debit Spread (safer)
Buy $185 Call, Sell $195 Call (same expiry Sep 12).
Lower cost, max profit capped near gap-fill.
Ideal risk/reward since target is defined.
📉 Bearish Play – Breakdown Below $180
Buy Puts
Strike: $180 or $175 Puts
Expiry: 2–3 weeks (Sep 5–12, 2025).
Target exit: $174 first, $166 second.
Stop-loss: Close > $186 (rejection invalidates bear thesis).
Put Debit Spread (conservative)
Buy $180 Put, Sell $170 Put (same expiry Sep 12).
Lowers premium cost, profits if price drifts toward $170.
⚖️ Positioning & Risk
Risk no more than 1–2% of account per side.
You can ladder both bullish and bearish spreads → whichever breaks first confirms direction.
Watch volume on $182–183 zone:
If buyers step in → favor call side.
If sellers dominate → favor put side.
✅ Summary:
Bull side: $185C / $190C → Gap fill to $195.
Bear side: $180P / $175P → Flush to $174–166.
Best R/R: Debit spreads around $185C–$195C or $180P–$170P, expiring Sep

Palo Alto Networks (PANW) – Buy Opportunity PANW closed at $177.09 with a strong rebound after recent pullback. The weekly chart shows a potential reversal supported by buying volume from the $158–160 support area.
🎯 Targets:
• First target: $185
• Second target: $195
Stop-loss: Weekly close below $158.

Palo Alto Networks Has Stumbled YTD. What Does Its Chart Say?Cybersecurity firm Palo Alto Networks NASDAQ:PANW will report fiscal Q4 results next week at a time when the stock is up 300%+ over five years, but down some 4% year to date. What does PANW's fundamental and technical analysis say?
Let's take a look:
Palo Alto Networks' Fundamental Analysis
PANW, CrowdStrike Holdings NASDAQ:CRWD and Zscaler NASDAQ:ZS are arguably the "Big Three" cloud-based, AI-assisted software cybersecurity platforms -- a group that's done well over the past year, but has been under pressure in recent weeks.
PANW has lost some 16% since its July 29 intraday peak, while CRWD has shed about 18% since its July 3 near-term top and ZS has given back 15% since its July 8 session high.
The group has pulled back even as the S&P 500 and Nasdaq Composite set new all-time highs. Cybersecurity firms have suffered as passive capital has been pulled from software in general.
However, that could change when the group reports quarterly earnings, starting with Palo Alto Networks.
PANW will release fiscal Q4 results next Monday after the bell, with analysts' consensus estimate calling for the firm to disclose $0.89 in adjusted earnings per share on $2.5 billion of revenue.
That would represent an 18.7% gain from the $0.75 in adjusted EPS that PANW reported in the same period last year, as well as a roughly 14% growth from the year-ago quarter's $2.2 billion in revenue.
In fact, Palo Alto Networks has reported 12%-15% year-over-year sales growth for five consecutive quarters.
Brad Zelnick of Deutsche Bank this week upgraded PANW to a "Buy" from a from a "Hold" this week, while increasing the stock's price target to $220 from an earlier $200.
Six other analysts also reiterated "Buy" or "Buy-Equivalent" ratings on Palo Alto Networks this week, with one increasing his price target to $225 from a prior $200.
That said, Roger Boyd of UBS recently took his PANW price target down to $185 from a previous $200, although the analyst reiterated his "Hold" grading of the stock.
All in, these eight analysts have collectively assigned Palo Alto Networks a $219.63 average target price vs. the $174.68 PANW was trading at Friday morning.
And interestingly, of the 44 sell-side analysts that I can find that cover PANW, 37 have revised their earnings estimates for the quarter higher since the period began. Just one has lowered his numbers, while six left their forecasts unchanged.
Palo Alto Networks' Technical Analysis
Now let's check out PANW's chart going back 12 months and running through Wednesday afternoon:
Readers will first notice that this chart shows an overarching "Triple Top" pattern of bearish reversal that began in earnest about a year ago.
This pattern's "neckline" or "pivot" is at $144 -- much lower than PANW's $174.68 Friday morning price. So, the chart is showing some risk for the stock.
On the other hand, PANW is looking to possibly test its 21-day Exponential Moving Average, or "EMA," marked by green line at $181.30 in chart above.
Taking that line could get the swing crowd behind Palo Alto Networks and potentially allow for a run at the stock's all-important 200-day Simple Moving Average, or "SMA" (denoted with a red line at $187.40 above).
Meanwhile, PANW's Relative Strength Index (or "RSI," marked with a gray line at the chart's top) is off of its weakest readings and approaching a more neutral level.
Similarly, the stock's daily Moving Average Convergence Divergence indication (or "MACD," denoted by black and gold lines and blue bars at the chart's bottom) has been weak, but appears to be strengthening going into earnings.
The histogram of the stock's 9-day EMA (the blue bars) is still in negative territory, but is ascending towards the zero-bound rather quickly.
Similarly, the 12-day EMA (the black line) is curling up towards the stock's 26-day EMA (the gold line). Although both are still in negative territory, a crossover there would be technically helpful for the bulls.
(Moomoo Technologies Inc. Markets Commentator Stephen “Sarge” Guilfoyle was long PANW and CRWD at the time of writing this column.)
This article discusses technical analysis, other approaches, including fundamental analysis, may offer very different views. The examples provided are for illustrative purposes only and are not intended to be reflective of the results you can expect to achieve. Specific security charts used are for illustrative purposes only and are not a recommendation, offer to sell, or a solicitation of an offer to buy any security. Past investment performance does not indicate or guarantee future success. Returns will vary, and all investments carry risks, including loss of principal. This content is also not a research report and is not intended to serve as the basis for any investment decision. The information contained in this article does not purport to be a complete description of the securities, markets, or developments referred to in this material. Moomoo and its affiliates make no representation or warranty as to the article's adequacy, completeness, accuracy or timeliness for any particular purpose of the above content. Furthermore, there is no guarantee that any statements, estimates, price targets, opinions or forecasts provided herein will prove to be correct.
Moomoo is a financial information and trading app offered by Moomoo Technologies Inc. In the U.S., investment products and services on Moomoo are offered by Moomoo Financial Inc., Member FINRA/SIPC.
TradingView is an independent third party not affiliated with Moomoo Financial Inc., Moomoo Technologies Inc., or its affiliates. Moomoo Financial Inc. and its affiliates do not endorse, represent or warrant the completeness and accuracy of the data and information available on the TradingView platform and are not responsible for any services provided by the third-party platform.

$PANW Showing signs.Showing signs of market appreciation, good response from the last dip market showing some resistance when it happened. the current price around 172, still trading around golden Fibonacci area, im positive that it would bounce back seeing the market appreciation by big volume node around 30 July, there is no anomaly seen. Forming the right shoulder for IHNS pattern, a good signs showing by touching the ATH area 4 times already means that the market is now speculating to test it on the 5th time while the price is guarded heavily, lets see can we have another breakout soon? or not.

LONG PANW targeting 190-200After the announcement of buying cyber ark the stock took a major hit. We could see that buyers decided to step in at ~170, and the stock was trading around this price for several trading days and it is basing around that level. from here we could have a potential run up towards 190 for the up coming earning reports.
I think, that if the company decided to purchase cyberark for 20B, it is more likely that it had some success in the last quarter. therefore, I'm bullish on the stock.
losing 165-170 price level would be a negative sign, therefore stop should be placed bellow at ~163.
BZH
