UiPath good R/R UiPath presents a potential long setup opportunity. There is a mitigation zone around the $15 range, with possible expansion toward the first macro target at $20. However, there is an open imbalance around the $13 range, which would serve as the stop-loss (SL) for this setup.
Not finacial advice.
UiPath, Inc. Shs Cert Deposito Arg Repr 0.5 Shs
No trades
1,150 ARS
−68.88 B ARS
1.34 T ARS
About UiPath, Inc.
Sector
Industry
CEO
Daniel Dines
Website
Headquarters
New York
Founded
2005
Identifiers
2
ISIN AR0343130982
UiPath, Inc. engages in the development and provision of a software platform to automate business processes. The firm serves the public, healthcare, telecommunication, finance, and banking industries. It also offers accounts payable automation, claims processing automation, contact center automation, and finance and accounting automation. The company was founded by Daniel Dines and Marius Tirca in 2005 and is headquartered in New York, NY.
Related stocks

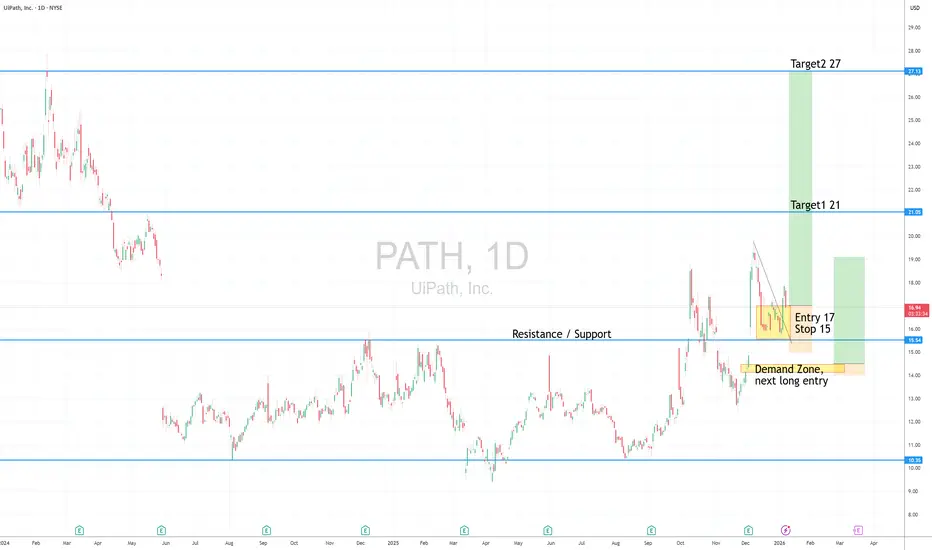
PATH LongDouble bottom breakout + retest
Long entry 17
Stop 15
Target 21, 27, 38 (Weekly Chart target)
Risk management is much more important than a good entry point.
I am not a PRO trader.
In my trading plan, the Max Risk of each short term trade should be less than 1% of an account.
Index will drop this stock for good solid buyindex will push this down for some liquidity sweep below. Will be nice almost 100% once the trade is done.

Trading Journal- January Massive earning move up, retraced, bought on the retake of the 21 EMA, sold for -8% loss..

Small long on PATHIt should go up as I see it. Just watch and see, not much more to it as i don't want to reveal my secrets;)


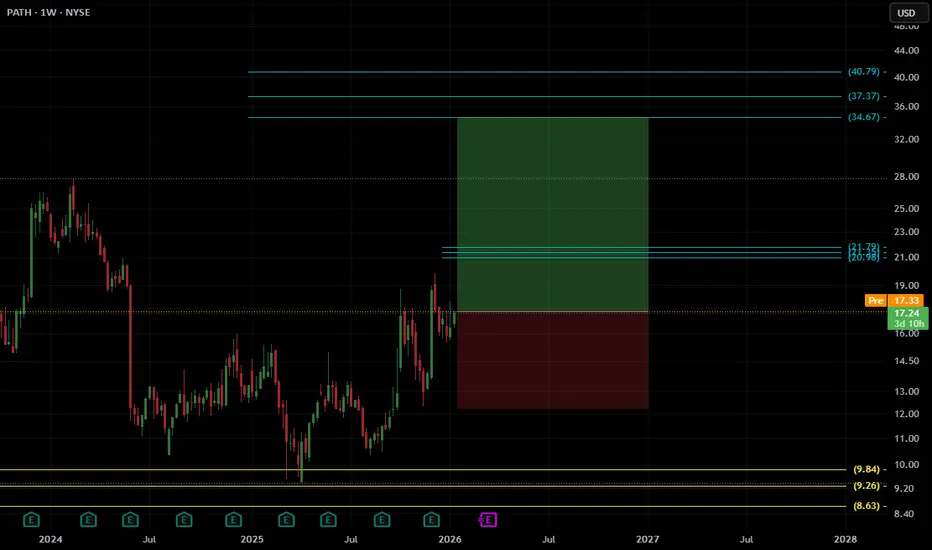
$PATH , SetupEntry : CMP
TP1 : 20.98
TP2 : 34.67
SL : If you wish
⚠️ Financial Disclaimer:
This post is not financial advice. I am not your financial advisor, your life coach, or your legally responsible adult.
Always do your own research and never trade based solely on internet comedy.
UiPath automates workflows and apparently the chart tooPATH pretends nothing happened after a perfect diamond breakout
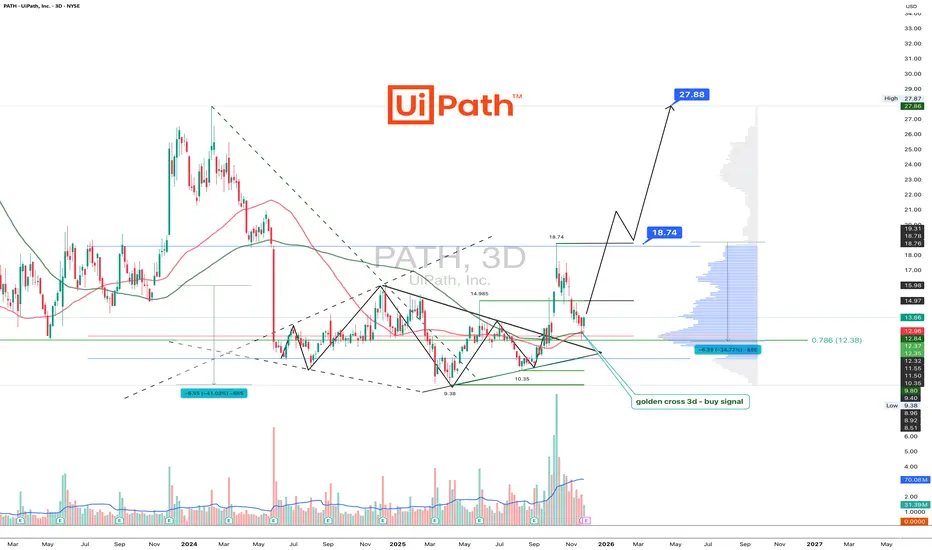
PATH is trading at 13.86 after the diamond pattern completed a clean breakout toward 18.74 and shifted into a corrective phase. The pullback landed precisely in the Fibonacci 0.786 zone between 12.00 and 12.50 where a clear demand a
A Massive Intersection Approaching See where a major downtrend broke support and upper bound of the subsequent uptrend respected it; it got rejected exactly there. But now, the time component has been increasingly kicking in a confluence effect; forming a subtle wedge which closes on Jan 26. I am expecting a dramatic move in the thir

PATH Bullish Idea: Tight Post-Episodic Base Under ResistanceWhat I see
PATH had an episodic pop (AI/partnership headline) and then spent weeks digesting gains instead of collapsing—bullish “hold of character.”
Price is now building a tight range around 16–17.5 with moving averages starting to curl up and compress (setup maturing).
Clear overhead supply si

See all ideas
Summarizing what the indicators are suggesting.
Oscillators
Neutral
SellBuy
Strong sellStrong buy
Strong sellSellNeutralBuyStrong buy
Oscillators
Neutral
SellBuy
Strong sellStrong buy
Strong sellSellNeutralBuyStrong buy
Summary
Neutral
SellBuy
Strong sellStrong buy
Strong sellSellNeutralBuyStrong buy
Summary
Neutral
SellBuy
Strong sellStrong buy
Strong sellSellNeutralBuyStrong buy
Summary
Neutral
SellBuy
Strong sellStrong buy
Strong sellSellNeutralBuyStrong buy
Moving Averages
Neutral
SellBuy
Strong sellStrong buy
Strong sellSellNeutralBuyStrong buy
Moving Averages
Neutral
SellBuy
Strong sellStrong buy
Strong sellSellNeutralBuyStrong buy
Displays a symbol's price movements over previous years to identify recurring trends.