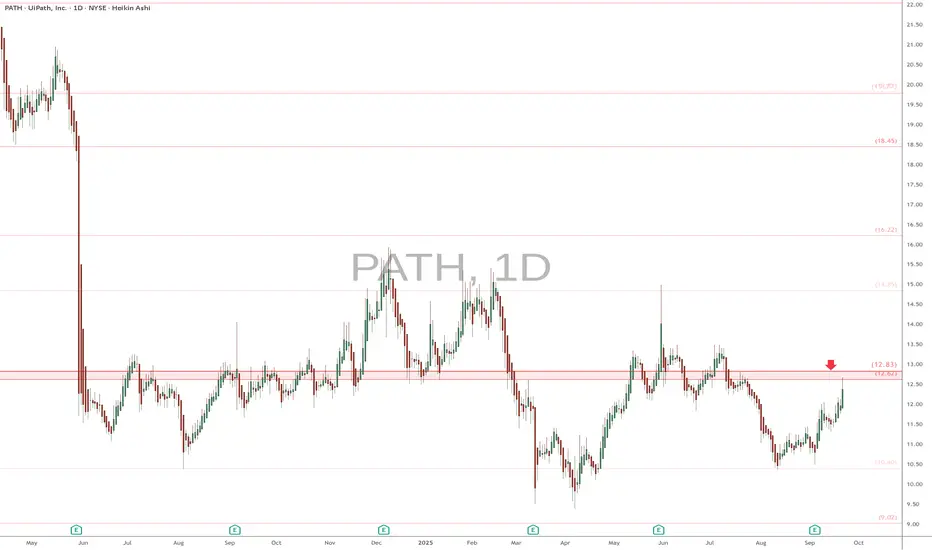
PATH - Price Reclaims 50-EMA and 200-EMAPATH - CURRENT PRICE : 14.50 - 14.70
PATH is gaining traction after reclaiming both the 50-EMA and 200-EMA, signalling a shift back into short-term bullish momentum 📈. Price strength is supported by rising RSI and an improving MACD cross, suggesting buyers are regaining control.
🔥 Bullish Points
Price reclaimed 50-EMA and 200-EMA
RSI trending above 50 → bullish momentum returning
MACD turning positive with increasing histogram
Volume uptick on recent green candles = buyers active
ENTRY PRICE : 14.50 - 14.70
FIRST TARGET : 16.00
SECOND TARGET : 17.30
SUPPORT : 13.00
Trade ideas

UiPath automates workflows and apparently the chart tooPATH pretends nothing happened after a perfect diamond breakout
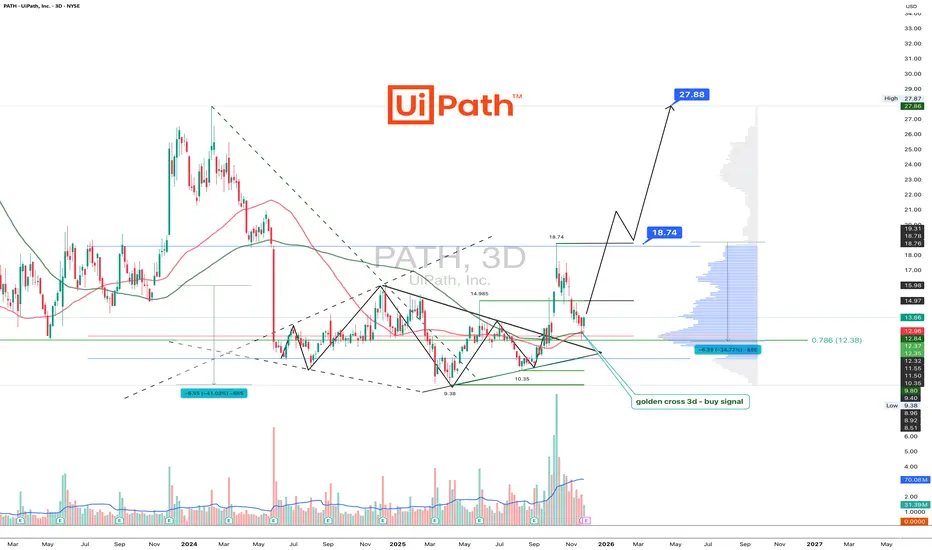
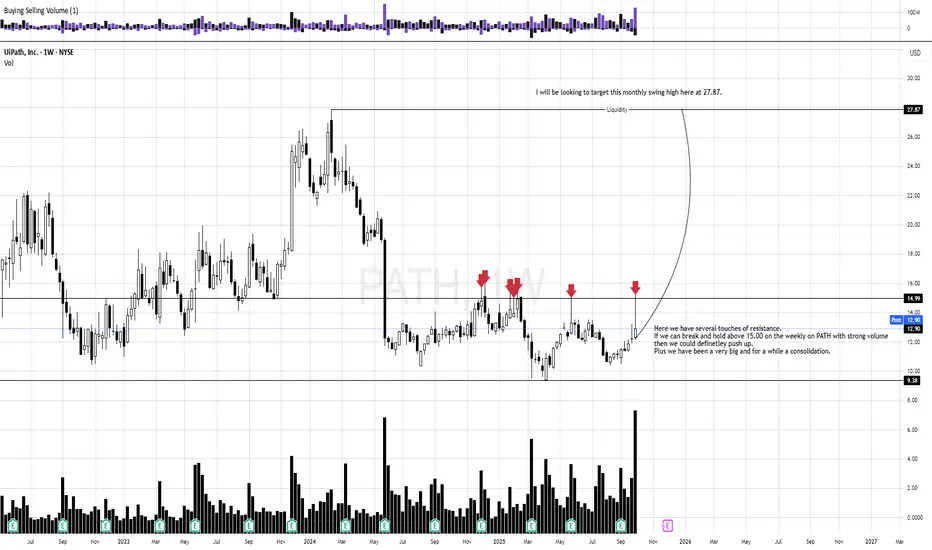
PATH is trading at 13.86 after the diamond pattern completed a clean breakout toward 18.74 and shifted into a corrective phase. The pullback landed precisely in the Fibonacci 0.786 zone between 12.00 and 12.50 where a clear demand area formed. Buyers reacted sharply and the three day chart printed a golden cross through the MA50 crossing the MA100 which strengthens the bullish scenario.
As long as price holds above 12.00 the structure remains bullish. The next confirmation level sits at 14.97. A solid close above this zone opens the path back to 18.74 and later to the extended target at 27.88 where higher timeframe liquidity is located.
Fundamentally UiPath continues to show strength as of November 29 2025. Annual revenue exceeds 1.55 billion dollars which reflects a near 15 percent year over year increase. Gross margin stays near 83 percent indicating high operational efficiency. Cash reserves are above 1.7 billion dollars which keeps the balance sheet among the strongest in the automation sector. Customer growth remains steady across banking telecommunications and public sector clients. The transition to subscription based models continues to improve the predictability of cash flows. The main risk remains sensitivity of enterprise budgets in slow economic cycles.
The reaction to the 12.00 support confirms solid demand. Holding above this zone keeps the bullish scenario active with targets at 18.74 and 27.88. If buyers reclaim 14.97 the trend could accelerate quickly.
Automation removes friction from business processes and sometimes the chart removes friction for traders. Fibonacci and MA100 hint louder than words.
PATH has a very long path upsidePATH can be a double from here soon if this AI theme continues for some more time.
UiPath isn't soemthing new for Robotic Automation but it's use case for the AI Agentic automation is the catalyst now.
- Breaking and holding above this long base of accumulation phase
- Good volume on the breakout
- Cup and Handle setup
- Above all recent anchored VWAPs
Long anywhere here.
Stop loss - 11
Target 1 - 24
Target 2 - 30
This has more potential but have a close watch on the AI theme and market conditions.
PATH Earnings Trade: Capitalizing on Pre-Market Rally PATH Earnings Trade Overview (QS Premium) — 2025-12-03
Direction: BUY CALLS
Confidence: 60% | Conviction: Medium
Expiry: 2025-12-05 (2 days)
Strike Focus: $15.00
Entry Range: $0.91
Target 1: $1.35 (+50%)
Target 2: $1.80 (+100%)
Stop Loss: $0.54 (-40%)
Position Size: 2% of portfolio
Market Context & Analysis
Katy AI: Neutral, slightly bearish (-3.73%, 50% confidence) → mild downward pressure.
Technical: Pre-earnings rally +7.48%, price near daily high ($14.87/$14.92), MACD bullish, stochastics overbought (82.4).
News: Earnings today; strong fundamentals — 100% beat rate, +41.4% avg surprise, 401% revenue growth.
Options Flow: Neutral PCR 0.77, implied move 13.3% ($1.97), some hedging at $16 put.
Risk Level: ELEVATED — high volatility (221% IV), Katy AI conflict, earnings binary event.
Trade Rationale
Edge: Strong fundamental history, earnings beat momentum, pre-market institutional positioning outweighs slight technical overbought and Katy’s bearish signal.
Timing Advantage: Earnings today with large implied move → positioned for post-earnings continuation.
Risk Management: Delta 0.511, tight stop, reduced size (2%) due to conflicting signals and extreme IV.
⚠️ Note: Extremely high volatility; monitor closely during earnings release, scale in/out to manage risk.
Elliott Wave Analysis and Key Levels for the Next MoveThis analysis shows how to apply Elliott Wave Theory together with fundamental and volume research. The content is professional, but it is also educational for anyone learning wave counting and market structure. I cover the full correction, the start of the impulse phase and the main levels that guide the scenario.

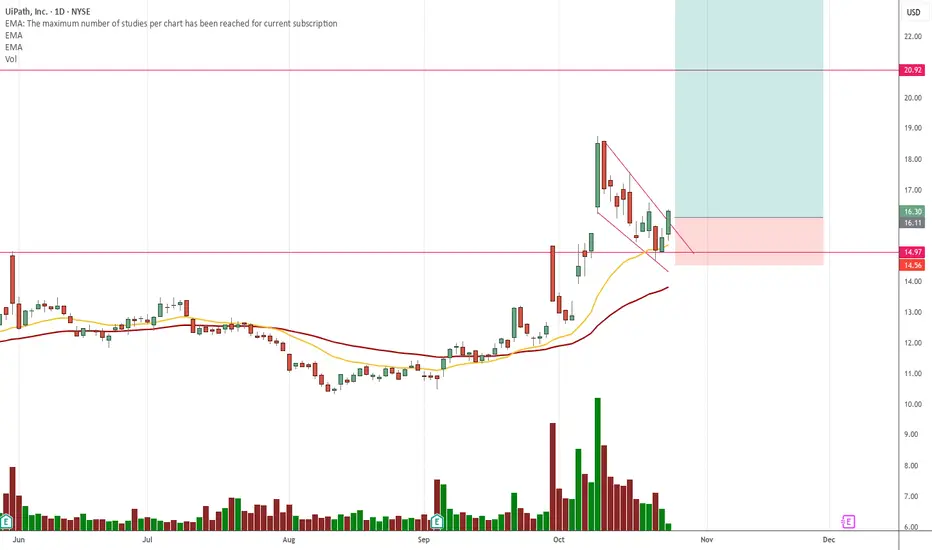
PATH - Go in the direction of the WINDOW!PATH - CURRENT PRICE : 17.14
The Japanese Candlestick theory refer to what we call in the West a gap as a window. Whereas the Western expression is "filling in the gap," the Japanese would say, "closing the window."
A rising window is a bullish signal. There is a price vacuum between the prior session's high (that is, the top of the upper shadow) and the current session's low. It is said by Japanese technicians to "go in the direction of the window." This is because windows are continuation signals. Consequently, with the emergence of a rising window, one should look to buy on dips.
PATH has formed three rising windows (gaps upward) in just two weeks that remain unfilled. This pattern suggests strong demand and sustained bullish momentum. Each window shows that buyers overcame sellers before the prior candle closed, reinforcing confidence in the trend.
Furthermore, a Golden Cross has formed for the first time in a long period (look at blue circle), where the 50-day EMA has crossed above the 200-day EMA — a classic long-term bullish confirmation. Notably, the last occurrence of this pattern was in November 2023, making this the first reappearance in over two years, further reinforcing its significance as a potential turning point in market sentiment.
For short-term target is 20.00 and 24.00. For position trader that holds for several months may target around 30.00. Investors holding for approximately one year, the target is 50.00.
ENTRY PRICE : 16.80 - 17.20
FIRST TARGET : 20.00
SECOND TARGET : 24.00
SUPPORT : 14.77 (the low of 08 Oct 2025 candle) - cutloss if price close below support level on closing basis.

UiPath Swing Long. Elliot WavesPath hitting a key level of support. Look for swing long to new highs. Invalidation of this wave 4 would be closing the weekly candle below 13.31 based off the elliot wave principles.

10 Stocks READY to EXPLODE!🔥 10 STOCKS READY TO EXPLODE! 🔥
NYSE:LMND , NYSE:FUBO , NASDAQ:GRAB , NYSE:PATH + 6 more primed setups. 🚀
Watch before they run 👇
Are you in any of these trades/ investments?

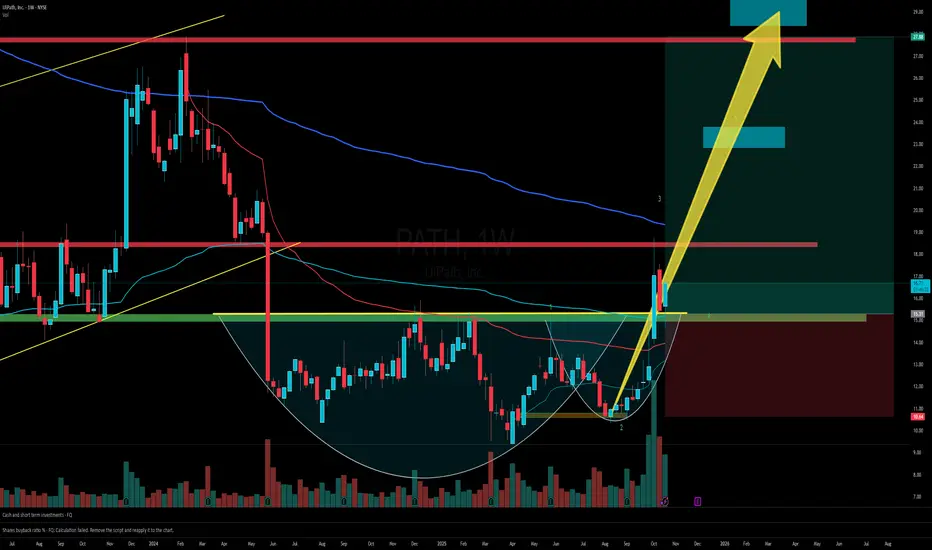
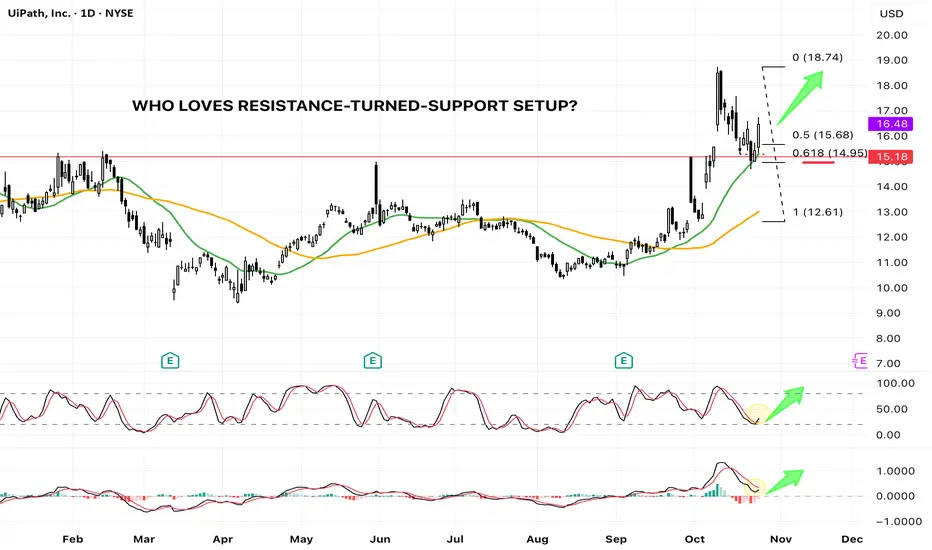
PATH - Textbook R/S Flip at Key Fib & MA Support (Bullish Setup)UiPath ( NYSE:PATH ) spent the majority of 2025 range-bound, oscillating between the $10 and $15 marks. This consolidation phase ended dramatically in early October, when the price decisively breached the long-standing 2025 horizontal resistance at approximately $15.
The breakout led to a swift rally, tagging a new year-to-date high of $18.74 . Following this strong move, the stock began a healthy retracement, pulling back to test the very level that had previously acted as resistance—the classic Resistance-Turned-Support (R/S Flip) setup.
The Confluence of Support
This current pullback is resting on a powerful confluence of technical supports, significantly increasing the probability of a bullish continuation:
1. Horizontal Support: The previous major resistance line (around $15) now acts as a crucial horizontal support.
2. Moving Average Support: The price is testing the 20-day Simple Moving Average (SMA 20, Green Line) . Importantly, this is the first time the price has pulled back to the SMA 20 since the bullish SMA 20/SMA 50 Golden Cross , signaling a strong trend retest.
3. Fibonacci Golden Pocket: The retracement has landed perfectly into the 0.618 Fibonacci Retracement level (from the $12.61 swing low to the $18.74 swing high), a statistically significant reversal zone often called the "Golden Ratio."
Momentum Indicators Confirm Bullish Bias
Beyond the price action, our auxiliary indicators are flashing constructive signals:
* Stochastic: The Stochastic oscillator is reversing from the oversold territory and is showing a clear bullish cross , indicating waning selling pressure and the start of a new upward momentum cycle.
* MACD: The Moving Average Convergence Divergence (MACD) indicator is attempting a bullish cross above the zero line , a powerful sign of increasing positive momentum.
Conclusion
The confluence of price action and indicator signals presents a high-probability bullish setup. The market is currently rewarding the successful test of the R/S flip at the 0.618 Fib and SMA 20 support.
While this setup suggests a strong likelihood for the next leg higher, traders must remember that trading involves probabilities. A clearly defined stop-loss is essential to manage risk should the market invalidate this robust support zone.
PATH: Let's join the wavePATH:
.
PATH came down backtest with low supply volumes- good signals.
Let's join and ride the wave.
.
US STOCKS- WALL STREET DREAM- LET'S THE MARKET SPEAK!
$PATH breakout play! - NYSE:PATH is breaking out from a very critical resistance of $15
- It has been a range bound stock for very long.
- However, I have been beating the drum that Agentic AI is a big tailwind because it requires integration with tools and LLMs like Gemini, Grok, ChatGPT
- NYSE:PATH is leading RPA (robotic process automation) which could easily catch a bid in next phase of AI goldrush of robotics which is a by product of AI maturity curve.

UiPath : Unleashed Potential SELL Then BUY It!UiPath redefines enterprise automation, freeing human potential with advanced RPA and process orchestration. Their software is the traffic controller that coordinates robotic fleets in modern business.
Uipat ( PATH ) buy idea Entry: around 17.5 – 18.2
Target: 20 – 23
Stop: 15.4
Big breakout + strong volume 📈
OpenAI news giving it more momentum ⚡️
#PATH #AI #Stocks
PATH eyes on $12.62-12.81: Key Resistance break to mark BOTTOM PATH trying to paint a bottom after much dumping.
Testing a proven resistance zone at $12.62-12.83
Look for a Break-n-Retest to hopefully mark BOTTOM.
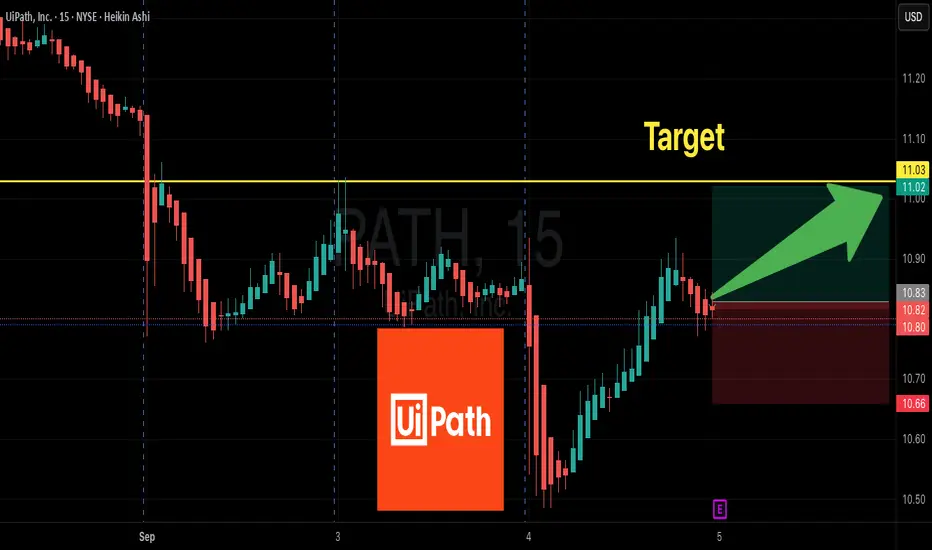
PATH breakout potential?Please reference to the photo why I am looking for a breakout, what my criteria's are and where I will be looking to target. Thank you as always for checking out my post!
[PATH] Investment PositionFollowing the AI evolution, this stock start to be interesting and not only fundamentally but also technically now.
Looking for a reversal of the down trend for a long term upside move.
Great Trade !

UiPath BuyFits wyckoff accumulation perfectly and think this will run up until earnings are a heavy sell off. Targets are on the chart provided using volume profile.

UiPath ($PATH) Earnings: Call the $11 Spike!
# 🚀 PATH Earnings Trade Setup — 09/04/2025
**Directional Bias:** **Moderate Bullish** (63% confidence)
**Event:** PATH FQ2 2026 Earnings (AMC 09/04/25)
**Strategy:** Short-dated, asymmetric **single-leg call**
---
## 🎯 Trade Details
| Item | Details |
| ----------------- | --------------------------------- |
| **Instrument** | PATH |
| **Direction** | CALL (LONG) |
| **Strike** | \$11.00 |
| **Expiry** | 09/05/2025 |
| **Entry Price** | \$0.58 |
| **Profit Target** | \$1.16 (+100%) |
| **Stop Loss** | \$0.29 (-50%) |
| **Size** | 1 contract (adjust per portfolio) |
| **Entry Timing** | Pre-earnings close |
| **Expected Move** | \~6% |
| **Confidence** | 63% (Moderate Bullish) |
---
## 🔍 Why This Trade
* **Guidance History:** 100% beat streak last 8 quarters → asymmetric upside.
* **Options Flow:** Heavy **call buying at \$11**, elevated OI & volume → potential **gamma squeeze**.
* **Technical:** Slightly bearish (below 50/200 MA) but neutral RSI — event-driven trade overrides weak technicals.
* **Fundamentals:** Strong cash & FCF; decelerating revenue & negative GAAP margins.
* **Macro/Sector:** Enterprise RPA tailwinds; cautious market sentiment.
---
## ⚡ Risk / Reward
* **Max Loss:** \$0.58 → \$58 per contract
* **Stop Loss:** \$0.29 → \$29 per contract
* **Target:** \$1.16 → \$116 per contract
* **R\:R (Stop / Target):** 1:2 (\~+200% upside vs -50% downside)
---
## 📈 Execution Tips
1. **Enter pre-close** on 09/04 at or near ask \$0.58.
2. **Scale out:** 50% at +100% (\$1.16), 50% at +200% (\$1.74).
3. **Hard stop:** 50% loss (\$0.29) or gap below \$10.00 → exit.
4. **Intraday exit:** Close within 2 hours post-market open if targets not hit.
5. **Size safely:** Risk ≤2–3% of portfolio.
---
## ⚠️ Key Risks
* Missed earnings / negative guidance → sharp drop, IV crush.
* High put OI below \$11 → downside hedges could exaggerate dips.
* Limited liquidity at open → use limit or mental price orders.
* Event-driven binary risk → only hold intraday; avoid overnight.
PATH --- Pop?PATH — Setting Up for a Pop?
UiPath (PATH) is showing signs of strength as it builds a base just above key Fibonacci support and prepares for a potential breakout in the broader AI + Robotics narrative.
Technical Setup:
Price holding above the 38.2% Fib retracement from the May rally.
Volume shelf + value area support at ~$12.30–$12.50 creating a launchpad.
21/50/200 SMAs converging — this type of compression often precedes expansion.
TTM Squeeze building pressure — prior squeezes on this name have led to fast directional moves.
Fundamental Tailwinds:
PATH is an automation leader riding the AI + enterprise software wave.
Sector rotation into Robotics and AI names (SYM, ROK, RR) lifting sentiment.
Recent dark pool activity shows accumulation—large 8M+ share blocks suggest institutional interest.
Thesis:
A close above $12.70 could trigger a move into the $13.40–$14.60 resistance zone, with a possible gap fill toward $18 on strong momentum.
Risk:
Invalidation below $11.80 (50% retracement / SMA cluster). Tight risk-reward if using LEAPs or long shares.

PATH ready to advance to 14.9-15$ this summer!Order flow indicating strong buy sequence to 14.9-15$ range is imminent. Still expecting additional volatility this summer before price advances to 18$ primary buy-side target later this yr.
Holding call options for Aug and Sept expiration

Next Move Decides the Trend: PATH’s $13 Level is Make or BreakYou're looking at UiPath Inc. (PATH), and it's a clean textbook setup "moment of truth".
PATH has rallied sharply off $11 and just tagged major overhead supply ($13), a former long-term support-turned-resistance zone. The reaction here matters a lot — it’s the line between a failed breakout and the start of a new bullish leg.
Technical Breakdown
1. Price Action – Retesting a Broken Base
Price slammed into the $12.90–$13.00 resistance, which was a clear prior demand zone that broke down in March. This is a classic bearish retest setup — price often rallies into this zone, exhausts, and rolls over.
However, if bulls absorb selling here, it flips the narrative to accumulation breakout.
2. Volume – No Conviction Yet
Volume on the way up was relatively weak, and there’s no high-volume breakout to confirm a structural shift. That favors a fade or stall, unless we see sudden buying pressure soon. Compare that to the heavy volume on the breakdown in March — sellers have muscle here.
3. MACD – Bearish Crossover
MACD just crossed bearish with declining histogram.
This suggests momentum is fading, and could be rolling over for a downside move.
The last time this happened (early April), it preceded a ~10% drop.
4. RSI – Bearish Divergence Setup
RSI made a lower high, while price made a higher high — a textbook bearish divergence.
RSI is now back to ~53, so momentum has already cooled off significantly.
This adds fuel to the argument that momentum peaked into resistance.
5. Structure + Fibonacci
The rally off the lows retraced ~61.8% of the previous selloff — a key Fib level.
If price fails to close above this Fib + structure zone, it becomes a high-probability reversal area.
$11.35 becomes the key support target if it rolls over.
The bull case hinges on:
Break above $13.30 with volume
MACD re-cross bullish with RSI > 60
Target would then be $14.25+, possibly back toward Jan highs

PATH // The yellow line is our support point. Let's wait for the 22 exponential average to cut upwards to the 50 exponential average.
