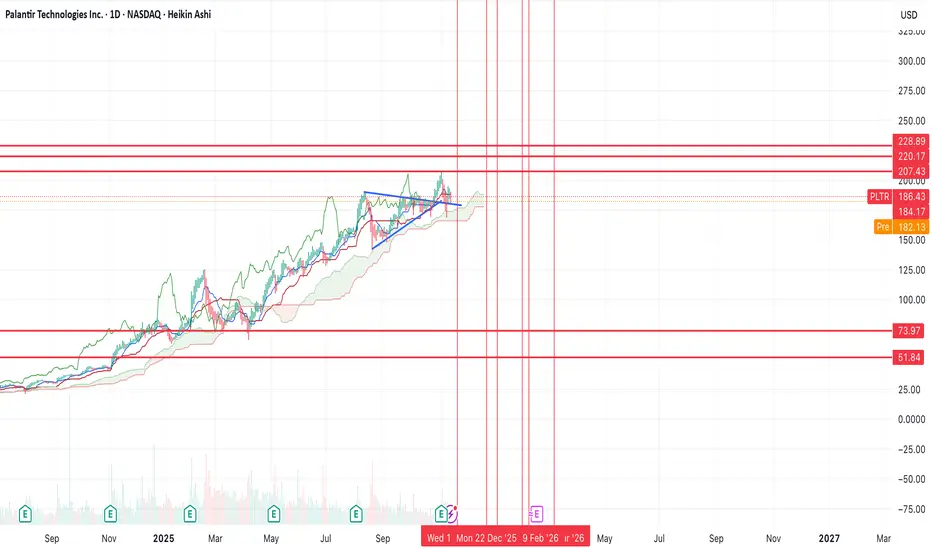
PLTR CAUTION!PLTR is at a key critical area, which has already given a warning shot to bulls.
We have a complete rising wedge structure with 3 waves up and a hook that has already cracked! Within it, we also have a head and shoulders at the top, which is bearish. (H&S not a top is usually a continuation patter
200 ARS
423.22 B ARS
2.62 T ARS
About Palantir Technologies Inc.
Sector
Industry
CEO
Alexander Caedmon Karp
Website
Headquarters
Denver
Founded
2003
ISIN
AR0132889822
FIGI
BBG01M5Z8WY1
Palantir Technologies, Inc. engages in the business of building and deploying software platforms that serve as the central operating systems for its customers. It operates through the Commercial and Government segments. The Commercial segment focuses on customers working in non-government industries. The Government segment is involved in providing services to customers that are the United States government and non-United States government agencies. Its platforms are widely used in areas such as defense, intelligence, healthcare, energy, and financial services, supporting data integration, large-scale analytics, and operational decision-making. The company was founded by Alexander Ceadmon Karp, Peter Andreas Thiel, Stephen Cohen, Joseph Lonsdale, and Nathan Dale Gettings in 2003 and is headquartered in Denver, CO.
Related stocks

Palantir - A devastating -40% drop!🤬Palantir ( NASDAQ:PLTR ) will create a major correction:
🔎Analysis summary:
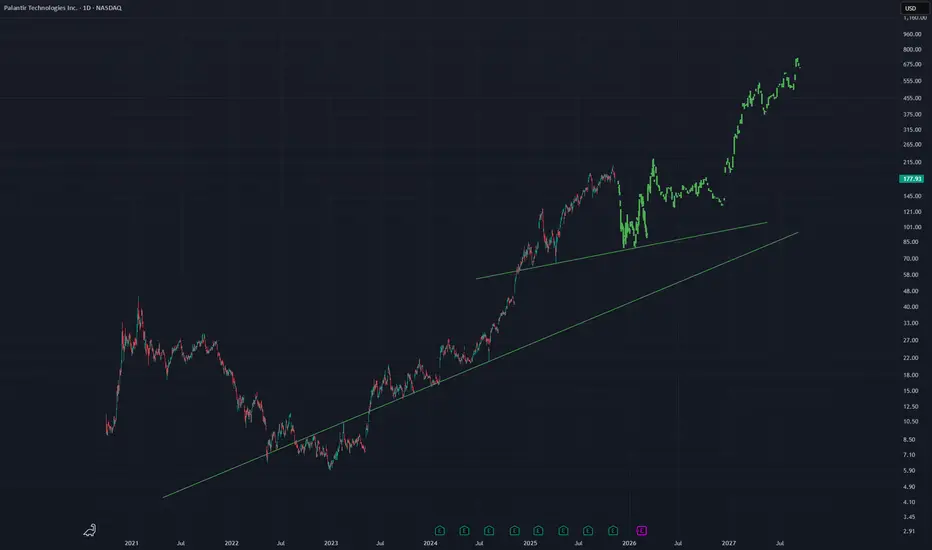
After a textbook bullish break and retest in mid 2024, we witnessed a parabolic rally on Palantir. During the entire rally, we only witnessed one red candle, which clearly shows some significant overextension. Theref

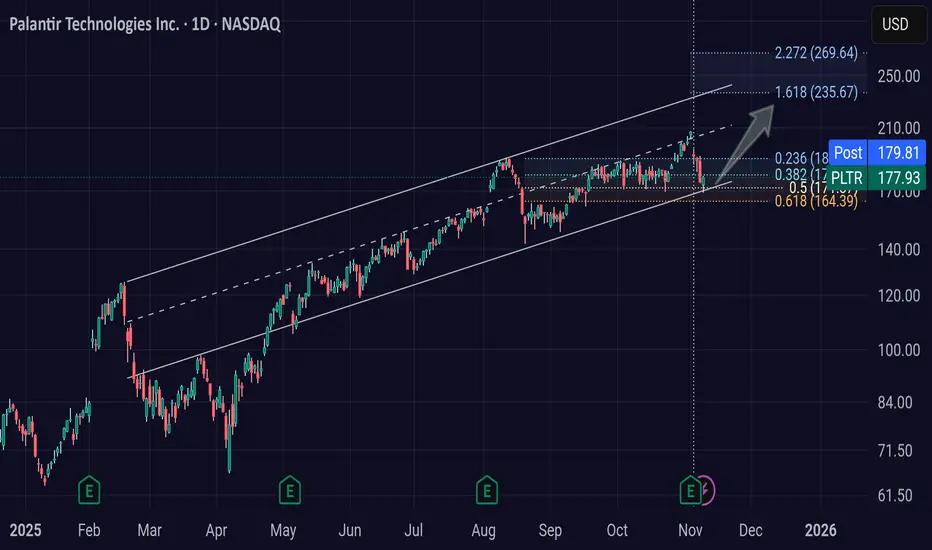
PLTR: staying on track for the time beingBullish channel in tact. Successful rebound on the .5 fib.
I can see a 40%+ move from here in the short-term, and following the trend.
Will it hold? Idk.
I'm a long term holder (10-20 yrs), and don't make any trade advice.
PLTR - Is that a top?Perhaps one of the clearer counts on offer at the moment suggesting that we might be due a correction at least in a number of US tech stocks and especially this one. Again, some decent fib extensions here and a nice inverse hammer candle before price headed down.

PALANTIR GOES READY TO 'WHAKA-WHAKA-WHAKA' ALL-MICHAELS-BURRIESPalantir Technologies has recently announced its Q3 2025 Earnings results.
“114% - our Rule of 40 score!*
These results make undeniable the transformational impact of using AIP to compound AI leverage.
Year-over-year growth in our U.S. business surged to 77%, and year-over-year growth in U.S. co

PLTR - Bars Pattern PredictionsUsing the bars pattern tool on this daily chart for PLTR to see if there will be a retest of a lower trend line before continuation upward
The lowest trend line probably will not be hit but i leave it there
See if future price action looks anything at ALL like this
PLTR long daily gap playI already entered too early.
Maybe new entry at the daily gap. would cut the trade when we close below the gap.

PLTR one more push up before a 70% correction?NASDAQ:PLTR looks like it's on it's last legs here.
If it can push off of this trend line here, then I think we can see one last move higher either into prior resistance, or there's a chance we can break it and form brief new highs. However, after that, I think we'll see a 70% correction back to
Palantir Technologies (PLTR) Shares Fall Despite Strong EarningsPalantir Technologies (PLTR) Shares Fall Despite Strong Earnings
Palantir Technologies (PLTR), a company specialising in big data analytics software, released a strong quarterly report this week:
→ Earnings per share: actual = $0.21, expected = $0.17
→ Revenue: actual = $1.181 billion (up 63% yea

PLTR Watching a Major Retest This Week (Nov 10–14)PLTR just pulled back from the top of its multi-month rising channel, and this week is all about whether it can stabilize or whether the sellers are finally stepping in for a deeper reset. Here’s the full multi-timeframe read based on structure, SMC, trendlines, and GEX.
1. Weekly Timeframe (1W)
Ma

See all ideas
Summarizing what the indicators are suggesting.
Oscillators
Neutral
SellBuy
Strong sellStrong buy
Strong sellSellNeutralBuyStrong buy
Oscillators
Neutral
SellBuy
Strong sellStrong buy
Strong sellSellNeutralBuyStrong buy
Summary
Neutral
SellBuy
Strong sellStrong buy
Strong sellSellNeutralBuyStrong buy
Summary
Neutral
SellBuy
Strong sellStrong buy
Strong sellSellNeutralBuyStrong buy
Summary
Neutral
SellBuy
Strong sellStrong buy
Strong sellSellNeutralBuyStrong buy
Moving Averages
Neutral
SellBuy
Strong sellStrong buy
Strong sellSellNeutralBuyStrong buy
Moving Averages
Neutral
SellBuy
Strong sellStrong buy
Strong sellSellNeutralBuyStrong buy
Displays a symbol's price movements over previous years to identify recurring trends.