PLTR: Earnings week!My thoughts on PLTR into earnings!
Hope you find it helpful, but as always not advice!
Safe trades everyone and enjoy your weekend!
S(t) = E f_t]
(new pretentious signature ;))
Palantir Technologies Inc. Shs Cert Deposito Arg Repr 0.3333333333 Sh
No trades
Trade ideas

$PLTR - $200 break for a move towards $220PLTR - Stock breaking all time as expected. Swing call added in the group. Stock looking strong here. calls above $200 looking good for more upside. Stock has nice pattern breakout on the daily.

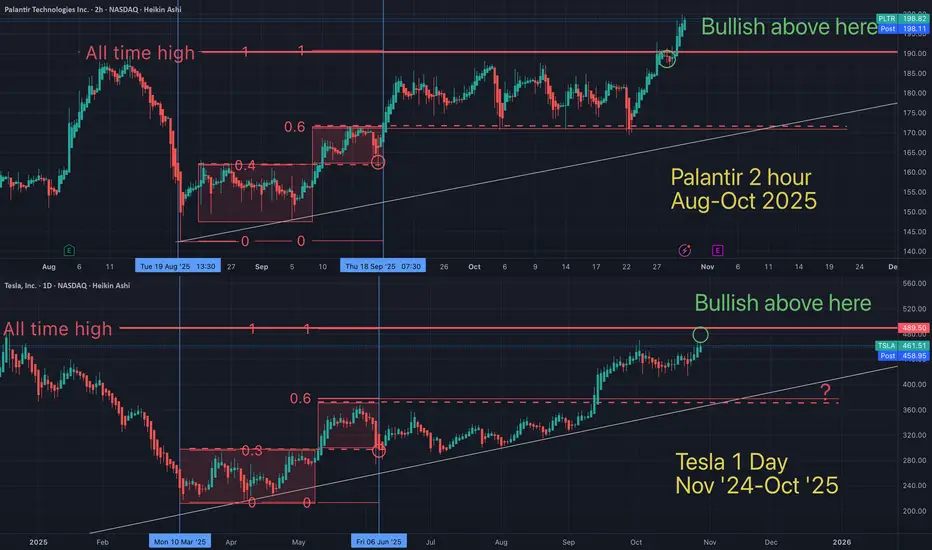
A broader look at the Palantir / Tesla Fractal (Tesla ATH Next?)What do you think? Is Tesla primed for an all time high (soon)...and a blow off top?
May the trends be with you
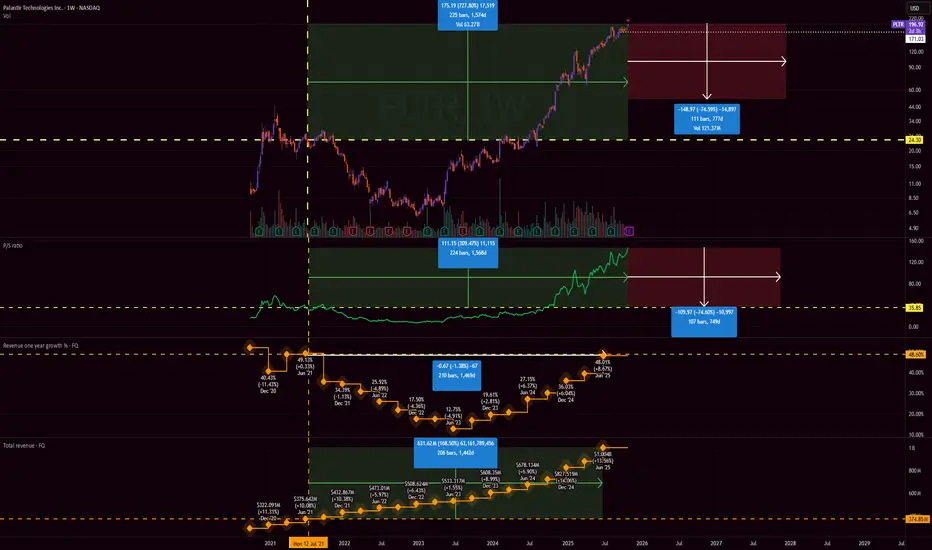
Palantir is at dot-com levels of overvaluationTl;dr, Palantir is grossly overpriced against the general market, as well as against its own financial metrics from 4 years ago, and its valuation metrics put it in peak dot-com bubble territory.
Metrics
Palantir's current price puts it at a market cap of $467.35B. With expected $3.5B in annual revenues in 2025, the price/sales (PS) ratio is at ~147 . PS ratios are the financial metric to watch for growth stocks, since growth companies prioritize revenue growth.
A high PS ratio should mean that the market expects high revenue growth. While Palantir's revenue growth is pretty high, it's not as exceptional as the PS ratio would imply. It seems that the market is not only extrapolating the revenues to continue rising, but it's also extrapolating that the growth itself (or first derivative of revenues) is going to keep increasing for years sequentially. Palantir has to generate far higher annual growth than it currently has to come close to justifying this valuation, I'd expect at least 175% annually.
For reference, Nvidia traded at a PS ratio of 43 in mid 2023, and then generated 125% growth 2 years in a row. The PS ratio stayed relatively stable since then, and never went past 43. Important thing to note here is that Nvidia also has higher net profit margins than Palantir, and profit margins play a role in how PS is interpreted (since earnings is what really matters). Palantir's profit margins have been growing consistently, from 10% -> 16% -> 32% annually, but still not close to Nvidia's 50%. Further profit margin growth would help to justify the overvaluation.
Comparisons
As the chart shows, Palantir's annualized revenue growth last quarter is equivalent to its growth in 2021 at ~50%. Revenues since then increased by 170%. Palantir at the time traded at a PS of 37, which is pretty high for 50% growth, but not too crazy.
If the stock traded at the same PS ratio as in 2021, where its growth was the same, the stock would be trading at ~$53 today at a market cap of $120B.
A PS ratio of >100 implies extreme bubble levels. From what I've found, during the very peak of the dot-com bubble:
Yahoo! traded at PS 100
Amazon traded at ~50
Ask Jeeves traded at ~55
CMGI traded at >300
Internet Capital Group traded at >200
Webvan traded at ~150
With Palantir trading at a PS of 147, it's well within the peak dot-com levels of overvaluation. While the entire tech/AI market is currently at very high valuations, Palantir still towers far above them.
Some examples of other high growth stocks today:
Crowdstrike at PS 30
AppLovin at PS 41
ServiceNow at PS 16
Netflix at PS 11
Even with the stock screener I couldn't find a stock that came close to trading Palantir's PS ratio, except for Microstrategy (which has no revenues as a crypto holding company) and for moonshot pharma R&D stocks which also have little to no sales by design.
The point of this idea is to show how grossly and absurdly overpriced this stock is, but it's not a recommendation to take a short position. The stock is so far decoupled from reality that you should consider it as equivalent to a meme coin. The financials don't matter, and it's simply an asset with a limited supply that is in high demand, so the price keeps going up.
Palantir Is +160% YTD. What Its Chart Says Ahead of EarningsPalantir Technologies NASDAQ:PLTR will report Q3 results next week as the security-software firm is enjoying roughly 160% year-to-date gains that have pushed its stock to all-time highs. Let's see what its chart and fundamentals say.
Palantir's Fundamental Analysis
PLTR plans to release earnings after the closing bell on Monday, with the Street currently looking for $0.17 in adjusted earnings per share on about $1.1 billion of revenue. This would represent a 70% year-over-year gain in adjusted EPS, as well as more than 50% in y/y sales growth.
If those numbers prove true, then the sales growth would represent the steepest year-over-year revenue gains that Palantir has ever put to the tape for any quarter. They would also mark the eighth consecutive quarter of accelerating year-over-year sales growth vs. the quarter prior.
In fact, 20 of the 21 sell-side analysts that I can find that cover Palantir have revised their earnings estimates upward since quarter began. (One estimate remains unchanged.)
Palantir's Technical Analysis
Next, let's check out PLTR's chart going back some eight months and running through Monday afternoon:
It looked recently like Palantir was forming a double-top pattern of bearish reversal after the stock found support at a 38.2% Fibonacci retracement of its April-through-August rally (the dark-gray line and shaded area in the chart above).
But as the shares managed to base and consolidate near that second top, this threat might have passed.
However, by stretching out the second top over several weeks, PLTR has instead formed an ascending-triangle pattern of bullish continuation with a $188 indicated pivot. The stock has traded above that at record levels recently ($196.29 as of Tuesday afternoon) as PLTR tries to hold the pivot ahead of earnings.
Meanwhile, the swing crowd appeared over the past few weeks to play both sides of Palantir's 21-day Exponential Moving Average (or "EMA," marked with a green line). That said, portfolio managers appear to have defended PLTR when the stock tested its 50-day Simple Moving Average (or "SMA," marked with a blue line at $172 above).
At the same time, Palantir's Relative Strength Index (the gray line at the chart's top) has rebounded out of neutral territory and is getting more muscular without yet reaching a technically overbought state.
The stock's daily Moving Average Convergence Divergence indication (or "MACD," marked with black and gold lines and blue bars at the chart's bottom) is also notably improving.
For openers, the histogram of the 9-day EMA (the blue bars) has crossed back into positive territory. In addition, the 12-day EMA (the black line) has crossed above the 26-day EMA (the gold line), with both in positive territory. These are all short-to medium-term bullish signals.
An Options Option
Options investors projecting a moderate upside move and seeking to profit using leverage might employ what's known as a "bull-call spread" in this scenario.
That's where you buy one call and simultaneously sell another with the same expiration date, but a higher strike price. Here's an example using recent market prices:
-- Long one PLTR $192.50 call with a Nov. 7 expiration date (i.e. after next week's earnings) at $10.30.
-- Short one PLTR Nov. 7 $207.50 call at $5.
Net Debit: $5.30
This trader is risking $5.30 to try to receive up to $9.70 for a maximum profit at expiration of 183%. Meanwhile, the maximum potential loss at expiration is the $5.30 net debit.
An options trader willing to end up owning Palantir might also choose to sell a put in addition to the above strategy, which could provide the person with PLTR shares at a lower cost basis. Example:
-- Sell (write) one PLTR Nov. 7 $177.50 put for $5.50.
New net credit: $0.20
The trader has essentially paid for the bull-call spread above by risking the possibility of having to buy 100 shares of PLTR at $177.50 at expiration even if the shares are trading lower than that price.
This may serve to lower the net basis for the shares by offsetting the cost of the long call, but also adds the risk of significant losses, as the stock could theoretically fall to zero.
(Moomoo Technologies Inc. Markets Commentator Stephen "Sarge" Guilfoyle was long PLTR at the time of writing this column.)
This article discusses technical analysis, other approaches, including fundamental analysis, may offer very different views. The examples provided are for illustrative purposes only and are not intended to be reflective of the results you can expect to achieve. Specific security charts used are for illustrative purposes only and are not a recommendation, offer to sell, or a solicitation of an offer to buy any security. Past investment performance does not indicate or guarantee future success. Returns will vary, and all investments carry risks, including loss of principal. This content is also not a research report and is not intended to serve as the basis for any investment decision. The information contained in this article does not purport to be a complete description of the securities, markets, or developments referred to in this material. Moomoo and its affiliates make no representation or warranty as to the article's adequacy, completeness, accuracy or timeliness for any particular purpose of the above content. Furthermore, there is no guarantee that any statements, estimates, price targets, opinions or forecasts provided herein will prove to be correct.
Options trading is risky and not appropriate for everyone. Read the Options Disclosure Document (j.moomoo.com) before trading. Options are complex and you may quickly lose the entire investment. Supporting docs for any claims will be furnished upon request.
Options trading subject to eligibility requirements. Strategies available will depend on options level approved.
Maximum potential loss and profit for options are calculated based on the single leg or an entire multi-leg trade remaining intact until expiration with no option contracts being exercised or assigned. These figures do not account for a portion of a multi-leg strategy being changed or removed or the trader assuming a short or long position in the underlying stock at or before expiration. Therefore, it is possible to lose more than the theoretical max loss of a strategy.
Moomoo is a financial information and trading app offered by Moomoo Technologies Inc. In the U.S., investment products and services on Moomoo are offered by Moomoo Financial Inc., Member FINRA/SIPC.
TradingView is an independent third party not affiliated with Moomoo Financial Inc., Moomoo Technologies Inc., or its affiliates. Moomoo Financial Inc. and its affiliates do not endorse, represent or warrant the completeness and accuracy of the data and information available on the TradingView platform and are not responsible for any services provided by the third-party platform.

Can Software Win Wars and Transform Commerce?Palantir Technologies has emerged as a dominant force in artificial intelligence, achieving explosive growth through its unique positioning at the intersection of national security and enterprise transformation. The company reported its first billion-dollar quarter with 48% year-over-year sales growth, driven by an unprecedented 93% surge in U.S. commercial revenue. This performance stems from Palantir's proprietary Ontology architecture, which solves the critical challenge of unifying disparate data sources across organizations, and its Artificial Intelligence Platform (AIP) that accelerates deployment through intensive bootcamp sessions. The company's technological moat is reinforced by strategic patent protections and a remarkable 94% Rule of 40 score, signaling exceptional operational efficiency.
Palantir's defense entrenchment provides a formidable competitive advantage and guaranteed revenue streams. The company secured a $618.9 million Army Vantage contract and deployed the Maven Smart System for the Marine Corps, positioning itself as essential infrastructure for the Pentagon's Combined Joint All-Domain Command and Control strategy. These systems enhance battlefield decision-making, with targeting officers processing 80 targets per hour versus 30 without the platform. Beyond U.S. forces, Palantir supports NATO operations, assists Ukraine, and partners with the UK Ministry of Defence, creating a global network of high-margin, long-term government contracts across democratic allies.
Despite achieving profitability with 26.8% operating margins and maintaining $6 billion in cash with virtually no debt, Palantir trades at extreme valuations of 100 times revenue and 224 times forward earnings. With 84% of analysts recommending Hold or Sell ratings, the market remains divided on whether the premium is justified. Bulls argue the valuation reflects Palantir's transformation from niche government contractor to critical AI infrastructure provider, with analysts projecting potential revenue growth from $4.2 billion to $21 billion. The company's success across nine strategic domains—from military modernization to healthcare analytics—suggests it has built an "institutionally required platform" that could justify sustained premium pricing.
The investment thesis ultimately hinges on whether Palantir's structural advantages—its proprietary data integration technology, defense entrenchment, and accelerating commercial adoption—can sustain the growth trajectory demanded by its valuation. While the platform's complexity requires heavy customization and limits immediate scalability compared to simpler competitors, the 93% commercial growth rate validates enterprise demand. Investors must balance the company's undeniable technological and strategic positioning against valuation risk, with any growth deceleration likely triggering significant multiple compression. For long-term investors willing to weather volatility, Palantir represents a bet on AI infrastructure dominance across both military and commercial domains.

Palantir / Tesla fractal STILL "strangely accurate".What is a fractal mathmatically?
All asset charts are graphs, governed by coordinates on an x-axis and y-axis "chart". Where there exist trendlines that price action "respects". These trendlines and ratios are dictated by equations with several variables. If variables were by definition "random", then what would be the chance of 1 fractal appearing in a random assortment of buyers and sellers, in all different time zones (and countries)... all buyin in different amounts...at different times...
Regardless the fractal seems to remain intact.
PLTR Weekly Outlook (Oct 28–31)PLTR Weekly Outlook (Oct 28–31): “$190 Gatekeeper — Breakout to $200 or Range Back to $175?”
1) Weekly (1W) — Macro read
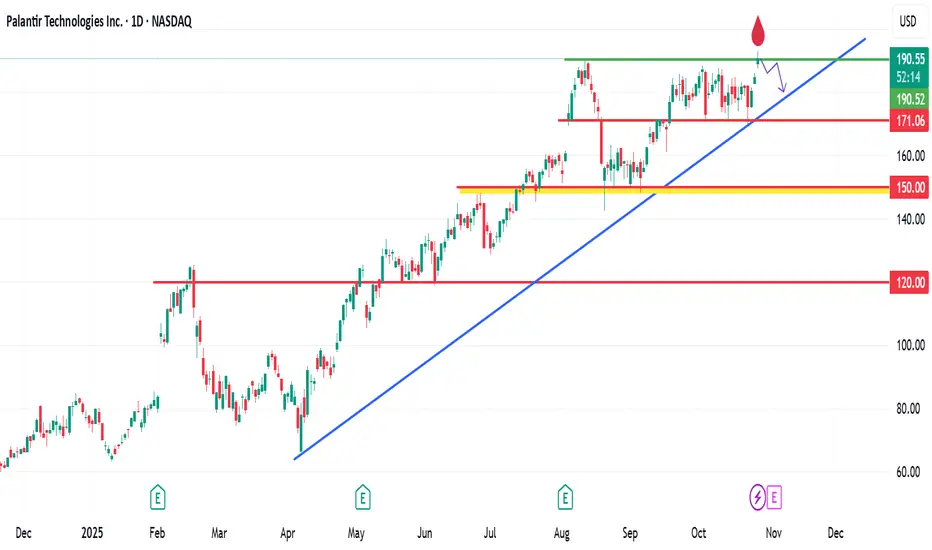
* Structure: multi-week BOS advance inside a rising channel; pressing right into the $188–$190 supply shelf.
* Momentum: MACD cooled but holding above zero; Stoch RSI curling up — favors continuation if $188+ holds.
* Key levels: Support: $173 → $169 → $142. Resistance: $190 (gate) → $200/205 channel tops.
My take: Higher-low trend intact; a weekly close above $190 shifts magnet to $200–$205.
2) Daily (1D) — Range control
* Price has chopped between $173–$190; last dip tagged demand near $173 then bounced back to the range high.
* A clean daily close above $190 converts prior supply to support and opens $195 → $200. Lose $186–$185, and the range rotates back toward $178–$173.
* Indicators: MACD flattening after a fade, Stoch RSI turning up — constructive if price holds mid-range.
Plan: Buy dips $186–$187 for a run at $195–$200; abandon if daily closes < $185.
3) 1-Hour (1H) — Execution zone
* Intraday trendline riding $186–$187; repeated BOS into $189–$190 then tight flag.
* Intraday triggers:
* Long: Break/hold $189.8–$190.2 → targets $192.5 → $195 (trail under VWAP/last HL).
* Short scalp: Only on < $186 with rising volume → $184.5 → $181; below $181 brings $178–$175.
4) GEX & Options Sentiment (from your chart)
* Highest positive NETGEX / Gamma wall: $188–$190 (acts like resistance/“pin”).
* Next call walls: $192.5 → $195 → $200 → $202.5.
* Put supports: $170, then $165.
* Stats on your panel: IVR 31.7, IVx avg ~71.2% (vol easing), Calls ~36% of GEX.
Implication: If price pins above $190, gamma can “walk” price toward $195–$200; failure back under $186 shifts magnet toward $175–$170 where puts dominate.
5) Suggested option plays (use small risk, scale in/out)
Bullish (preferred while > $186):
* Breakout: Buy 190C (0–2DTE) on a 15–30m hold above $190.
* Targets $192.5 / $195; lottery runner to $200.
* Invalidation: back inside $189 or a close < $186.
* Conservative: 190/195 or 190/200 call debit spread if IV upticks; better RR into gamma walls.
* Dip buy: If pullback to $186–$187 holds with higher low, take 190C for a push back to the top of range.
Bearish/Hedge (only if structure breaks):
* Lose $186 with volume → 185P (1–2DTE) targeting $181–$178; extend to $175/170 if momentum expands.
* Spread idea: 185/175 put debit if you want defined risk.
Neutral/income (trend intact, expect pin):
* Put credit spread 175/170 into week’s end if price holds $186+ and you prefer conservative theta.
Directional bias this week: Bullish if $186–$187 continues to hold and $190 flips to support → path of least resistance $195 → $200.
Risk line: A sustained break < $186 likely rotates price back to $181–$175 before buyers try again.
Educational only — not financial advice. Manage size, respect stops, and let the levels lead.

$PLTR 15% upside from here New all time high for Palantir after consolidating for a month just below fib level 0.886. next target fib level 1.618 at $219.

Palantir (PLTR) hit a new All Time HighPalantir (PLTR) ht a new All-Time-High (ATH) at $192.83 today.
Many of my friends said, ''Rawlings, why did you sell off at ATH?''
As an investor who knows how to be content, I learned my lessons along the way.
I bought my last PLTR holdings at the rate of $158.98 and sold at $191.89.
I made $32.91 for every $158.98 that I invested = over 20% ROI.
As a technical Analyst, I see a possibility of this stock pulling back a bit if the rally continues.
My target re-entry will be $180 zone and a retest of the ascending trendline on my chart.
Trade with care.
Also remember that knowing how to TP is a skill
$PLTR New ATH coming in After building support for a couple months. PLTR builds a triangle and pops out on Friday. Weekly tail candle shows confidence for a continuation upward.

Palantir - Knocking on heavens doorMultiple touches to the upside in the 185 - 190 USD range while ranging in an overall aggressive uptrend, paired with super-tight Bollinger bands on the daily are a telltale sign for me, that a breakout to the upside is coming.

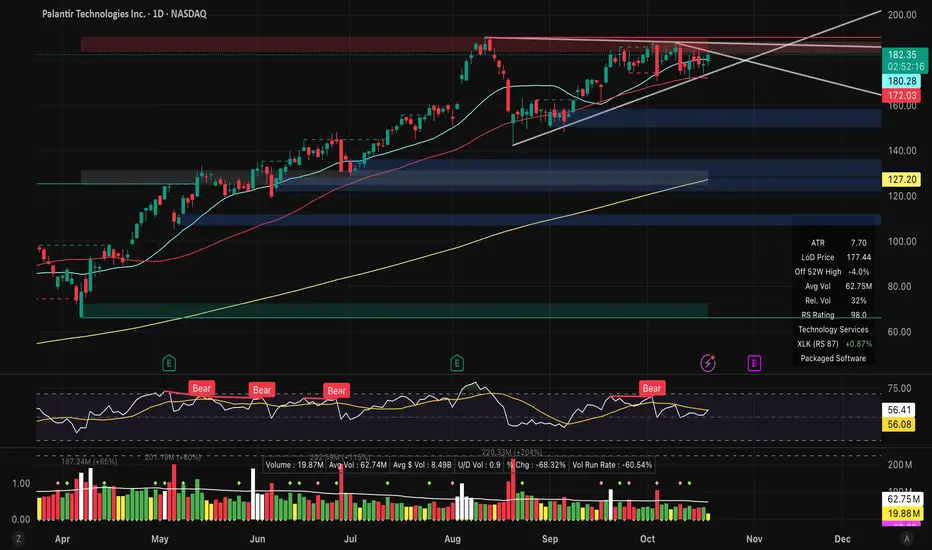
$PLTR Basing Analysis: 3-Month Technical OutlookFor the past twelve weeks, NASDAQ:PLTR has been consolidating near its all-time high (ATH). This prolonged basing period has resulted in the formation of a distinctive wedging pattern, commonly known as a Volatility Contraction Pattern (VCP). This pattern, popularized by Mark Minervini, is characterized by decreasing price swings and tightening ranges.
Technical Pattern and Implications
The VCP that has emerged on NASDAQ:PLTR 's chart typically signals a potential continuation in the direction of the prevailing trend. In this instance, the trend leading into the pattern has been upward, suggesting that a breakout to the upside could be the most likely scenario.
Trading Plan
To prepare for a possible breakout, an alert has been set just below the horizontal resistance area. If this alert is triggered, the plan is to initiate a new position in anticipation of further upward movement. While price targets are not usually set, in this case, an estimated gain of approximately 18% is anticipated following a breakout. This projection is based on the depth of the pullback from the ATH.
Risk Management and Disclaimer
Readers are strongly encouraged to conduct their own analysis and to adhere to their personal trading rules. Investing in the stock market always carries risk, and it is essential to make informed decisions with your own capital.

PALANTIR sitting on a Buy Zone. Target $220.Palantir (PLTR) has been trading within a Channel Up since early May and is currently consolidating on its bottom (Higher Lows trend-line). while holding he 1D MA50 (red trend-line). The 4H MA50 (blue trend-line) - 1D MA50 range has been technically the most optimal buy zone of this pattern.
With the 4H RSI exhibiting a Bull Flag similar to May - June, we expect the stock to aim for at least its 2.618 Fibonacci extension at $220.00. If broken, it may extend for an end-of-year rally to $255.00 completing a +80% Bullish Leg similar to the Channel's first.
-------------------------------------------------------------------------------
** Please LIKE 👍, FOLLOW ✅, SHARE 🙌 and COMMENT ✍ if you enjoy this idea! Also share your ideas and charts in the comments section below! This is best way to keep it relevant, support us, keep the content here free and allow the idea to reach as many people as possible. **
-------------------------------------------------------------------------------
💸💸💸💸💸💸
👇 👇 👇 👇 👇 👇

PLTR Gearing Up for a Friday Move: (Oct. 24 Outlook)Will $182 Trigger a Breakout or a Trap? 🚀
1. Market Structure (1H & 15M)
Palantir (PLTR) is showing a bullish short-term recovery after reclaiming structure from the $169 demand zone, where a strong CHoCH (Change of Character) flipped the prior bearish momentum. The Break of Structure (BOS) around $175 confirmed buyer aggression, and price has since climbed toward the key $180–$182 resistance range.
On the 1-hour chart, PLTR is now testing that upper liquidity pocket — precisely where a previous CHoCH reversal began last week. Smart money likely used the drop under $170 to accumulate positions, and now we’re seeing that energy unwind into overhead liquidity between $180–$183.
On the 15-minute timeframe,
a short-term rising wedge pattern has formed. The intraday CHoCH near $180.3 shows early signs of possible exhaustion, but until structure breaks below $178, the short-term bias remains bullish.
2. Supply and Demand / Order Blocks
* Demand Zone: $175–$177 (former resistance turned support; confirmed with high-volume absorption)
* Immediate Support (FVG Zone): $178–$179 — this area aligns with the 15-min fair value gap and could act as an intraday springboard for continuation.
* Supply Zone: $182–$184 — heavy liquidity cluster visible from prior distribution phase, aligning with multiple order blocks and GEX resistance.
If PLTR breaks and closes above $182.5 with strength, it could trigger a short-covering rally toward $185+. But a failed breakout could produce a sharp retrace back to $176 as trapped longs exit.
3. Indicator Confluence
* 9 EMA / 21 EMA: The 9EMA has crossed above the 21EMA on both 15M and 1H — a solid confirmation of bullish control as long as price stays above $179. The slope is positive, suggesting trend continuation.
* MACD: On the 1-hour, the histogram is strongly green with widening bars — showing bullish momentum regaining steam. On the 15-minute, momentum cooled slightly in the late session, suggesting consolidation before the next leg.
* RSI: The hourly RSI sits around 70, indicating strong but not extreme momentum. On the 15M, RSI cooled back toward 60 after a near-overbought condition, giving bulls room to push again if demand returns.
* Volume: Noticeable pickup on the breakout from $175, confirming participation and likely short covering.
4. GEX (Gamma Exposure) & Options Sentiment
Friday’s GEX map shows $185 as the highest positive gamma and call wall, creating a natural magnet if momentum continues. The HVL (High Volume Level) at $175 coincides with the main structural support and previous BOS zone — an important line for bulls to defend.
Below $175, the PUT wall at $170 marks a critical downside risk zone where dealers may need to sell into weakness. Above, the $180–$182 region carries stacked call walls — the zone where gamma flips could fuel acceleration or rejection.
IVR sits at 30.9, with moderate call bias (36.6%) and a GEX-positive environment, meaning the market is likely to lean toward volatility suppression until a breakout occurs. If PLTR clears $182 with volume, expect a gamma squeeze into $185–$187, while failure there could trap momentum longs and send price right back to $175.
5. Trade Scenarios for Friday, Oct. 24
Bullish Setup 🟩
* Entry Zone: $178–$179 retest or confirmed breakout above $182.3
* Targets: $183.5 → $185 → $187
* Stop-Loss: Below $177
* Confirmation: Price holds above 9EMA on 15M, MACD histogram stays positive, RSI > 55
Bearish Setup 🟥
* Entry Zone: $182–$183 rejection zone
* Targets: $179 → $176 → $172
* Stop-Loss: Above $184.5
* Confirmation: 15M CHoCH + MACD histogram flips red with RSI divergence
6. Closing Outlook for Oct. 24 (Friday)
Friday’s setup looks balanced but leaning bullish as long as $179–$180 holds intraday. A quick liquidity grab under that level early morning could give bulls a clean launch toward $185+. Conversely, if $182 rejects again with heavy volume, expect a pullback toward $175 — where both structure and gamma support align.
My personal take: PLTR looks coiled for a breakout, but the move needs confirmation above $182. A low-volume fakeout would likely fade, while a strong breakout could trigger dealer hedging and send this name flying into the upper $180s.
🔥 Final Thought:
“PLTR is sitting right under the ceiling — $182 is the key. If bulls break through, $185–$187 comes fast. But if it fails again, $175 will be back on the radar.”
This analysis is for educational purposes only and not financial advice. Always do your own research and manage your risk before trading.
Tight VCP setup forming just under resistance $PLTR 🚀 Stock on My Radar: NASDAQ:PLTR
NASDAQ:PLTR Tight VCP setup forming just under resistance around $189–$190.
✅ 3 clean contractions
✅ Volume dry-up
✅ RS Rating 98
✅ All key MAs aligned (10/21/50/200 uptrending)
Coiling under pivot — looks ready for a potential breakout.
📈 Watching for decisive move > $190 w/ power volume.
Risk stays tight below $178.
#VCP #SEPA #PLTR #MinerviniMethod #Trading
Palantir Technologies (PLTR) — Intraday TA (15-mins) Oct. 20
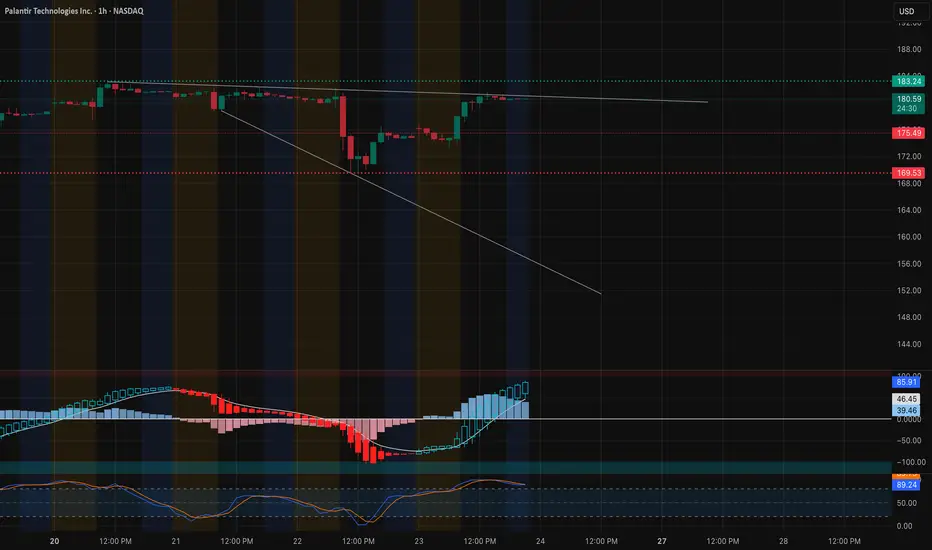
PLTR is showing a strong intraday recovery structure following an early liquidity sweep and CHoCH near $178.15, confirming buyers stepping in from that demand zone.
Market Structure
* The chart confirms a Break of Structure (BOS) to the upside after defending the morning low, indicating a short-term bullish shift.
* Price is now following an ascending trendline channel, with current resistance near $183.00–$184.00, aligning with the upper intraday trendline.
* As long as PLTR holds above $180.75–$181.50, bulls maintain short-term control.
Supply & Demand Zones
* Demand Zone (Support): $178.15 → $177.45 (where CHoCH occurred).
* Immediate Supply: $183.00 → $184.50 (potential short-term rejection zone).
* Clean break above $184.50 opens room for a move toward $186+.
Indicators
* MACD: Turning positive with a fresh bullish crossover. Histogram momentum is expanding — confirmation of intraday strength.
* Stoch RSI: Rising sharply from oversold, currently near the mid to upper range — expect possible short-term consolidation before continuation.
Scalping Outlook
* Bullish Setup: Watch for continuation above $183.00 with potential to retest $184.50–$186.00.
* Entry: Above $183.20
* Target: $185.50 → $186.00
* Stop: Below $181.50
* Bearish Scenario: Failure to hold above $181.50 could invite a pullback to the $179–$178 zone.
* Entry: Below $181.20
* Target: $179.50 → $178.20
* Stop: Above $182.80
Summary
PLTR is showing a reversal-to-continuation pattern, reclaiming structure after a strong morning flush. Momentum and structure both lean bullish, but it’s approaching a trendline resistance — watch for a breakout retest above $183 for confirmation.
Disclaimer: This analysis is for educational purposes only and not financial advice. Always do your own research and manage risk before trading.

PLTR Retracement x Gaza Reconciliation - Oct 20, 2025 Idea - CY PLTR Retracement x Gaza Reconciliation - Oct 20, 2025 Idea - CY

We could soon be talking again about Palantir...Ten weeks of consolidation could end by a Cup with Handle breakout... or not.
Key points at the time of writing.
✣ New bull market cycle running since June 2025
✣ Market Direction is Up 90%
✣ Stock Fundamentals are good with multi-year growth except in December 2024
✣ Earnings acceleration in last 2 quarters.
✣ Strong Institutional Interest with 2200 Buyers vs 1120 sellers TTM and a ownership of 45%
✣ Stock at base 5 is a red flag !
✣ TTM Performance is 310%
✣ Earnings due in 2 weeks !
If the pattern is broken to the upside, we could see a nice rise in the stock price...

PLTR Friday Crossroads – OCT. 17Bulls Defend $177 Zone as Gamma Pressure Builds Into the Close ⚔️
📊 Multi-Timeframe Breakdown
🕒 1. Daily Chart – Macro Structure (“The Why”)
PLTR has been in a strong uptrend since May, but this week’s CHoCH near $180 signals a short-term shift in character. The daily trendline from the summer lows remains intact, yet momentum has clearly slowed.
The broader structure shows consolidation under $190 supply and above $176 demand, forming a compression range where smart money appears to be rotating positions rather than trending.
Bias: Still bullish in the macro view, but with near-term weakness while price bases above $177–$178.
⏰ 2. 1-Hour Chart – Active Market Structure (“The Setup”)
Zooming in, the 1-hour chart highlights a descending channel with repeated CHoCH and BOS reactions — classic signs of accumulation under pressure. Buyers stepped in near $177.9, creating a reactive low, but sellers continue defending the $183–$185 supply band.
Both 9 EMA and 21 EMA are sloping down, showing short-term bearish bias, but the structure remains intact unless $176 breaks.
Key Levels:
* Support: $177.9 → $176.5
* Resistance: $183.5 → $185.0
* Trendline: Holding higher lows on the intraday uptrend.
Observation: Momentum is compressing, and volume is declining — often a sign of an upcoming volatility expansion.
💹 3. 15-Min Chart – Intraday Execution (“The How”)
On the 15-minute timeframe, PLTR is trading within a tight wedge beneath the intraday trendline.
A short-term BOS confirms bears still have control below $180.7, but the MACD histogram is flattening and Stoch RSI is curling from oversold — a potential early reversal signal.
If price reclaims $180.7 with momentum, we could see a fast push into $183+ as short-term shorts unwind.
Scalp Play Idea:
* Bullish: Enter on breakout above $180.7, target $183.3 → $185, stop below $178.
* Bearish: Enter on rejection below $179, target $176 → $172.5, stop above $181.2.
📈 4. GEX (Gamma Exposure) Chart – Dealer Positioning (“The Fuel”)
Options sentiment is pivotal going into Friday:
* Highest Positive GEX / Call Resistance: $187.5–$190
* Neutral-to-bullish pivot: $182 (Gamma flip)
* Major Put Walls: $175–$172
* Max Put Support: $170 (negative gamma pocket)
With IVR 48.3 and IVx avg 76.2, volatility remains elevated — expect fast moves once price breaks out of this compression zone.
A reclaim above $182 could ignite a dealer hedging squeeze toward $185+, while failure to defend $177 may trigger gamma-driven downside to $172.
🎯 Final Outlook
Friday is a battleground between $177 and $180. Bulls must defend this zone or risk triggering a deeper correction into next week.
If we see a liquidity sweep under $176.5 followed by a reclaim, that’s the setup I’ll be watching for a quick long back into $183+.
But if volume builds on a break below $176, the market could slide fast — fueled by negative gamma flow.
Either way, expect volatility and traps early before trend clarity in the second half of the session.
Disclaimer:
This analysis is for educational purposes only and not financial advice. Always manage your risk and trade your plan.

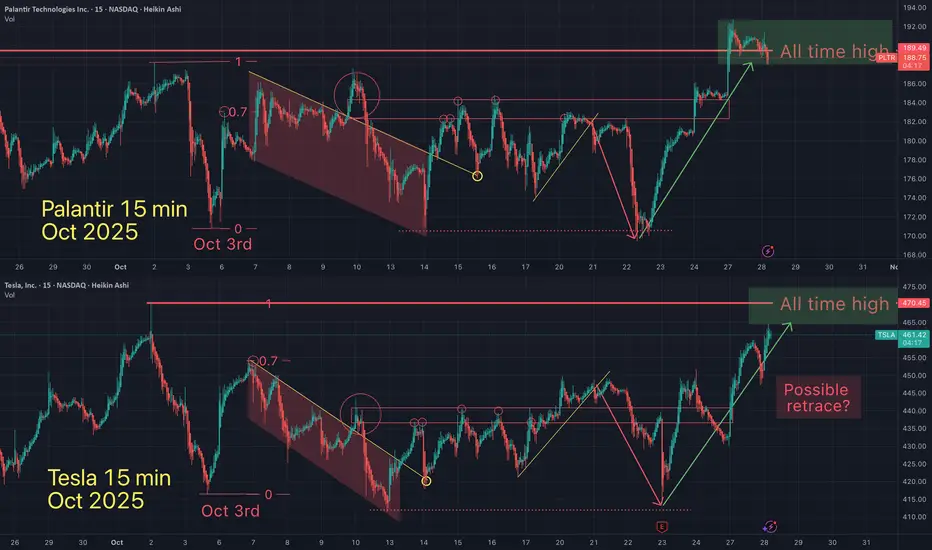
Tesla & Palantir STILL following this fractal.On oct 7th I suggested that Tesla and Palantir were following the same fractal (on the daily & 15 min time frames). They are both still following the fractal, over a week later.
Repeating patterns are everywhere, once we know how tho spot them.
May the trends be with you.

PLTR – Eyeing a Short-Term Push Into the 185–190 ZoneDescription
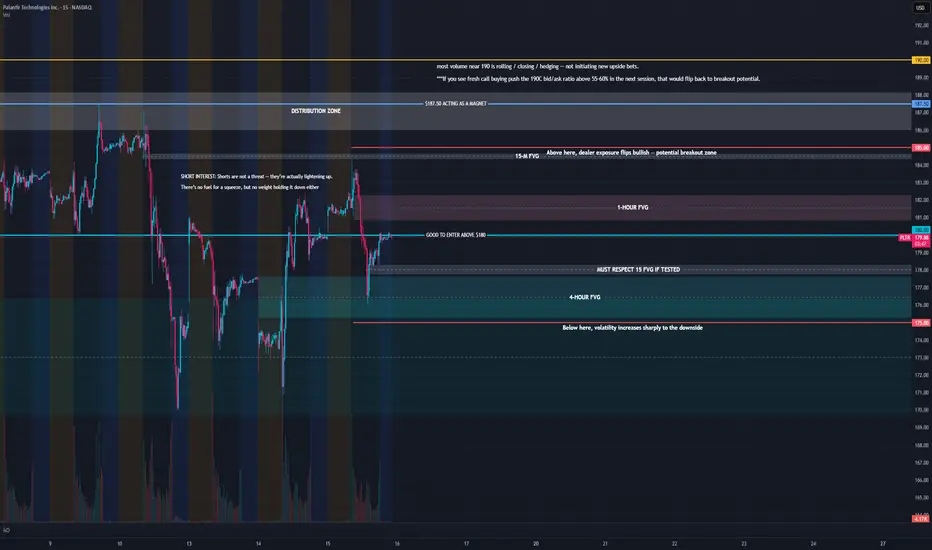
Been tracking PLTR’s short-term setup and the options flow is starting to paint a pretty clean picture.
Most of the call interest for this week is stacked between $185–$195, with the heaviest concentration around $185–$190 — basically forming a near-term “gamma magnet.” Dealers tend to hedge long when price trades into that zone, which usually supports upside momentum rather than capping it.
Short interest sits around 2.3% of float, and the cost to borrow has stayed soft. That’s not a squeeze setup, but it’s enough to say there isn’t a heavy wall of short pressure right now. Meanwhile, the bid/ask ratios on the 195–200 calls are rising above 55–60%, showing traders are rolling exposure higher rather than closing out.
In short — we’re seeing a healthy rotation of call volume upward while the lower strikes (180–182.5) stay firm. That’s constructive for a potential 3–5 day continuation move.
My Plan:
Watching for a hold above $181–182 to stay in the bullish zone
If PLTR clears $185 with volume, expecting momentum to build toward $188–$190
Planning to take partials there — could stretch to $192 if the OI at 195–200 keeps growing
Cut below $179.50 if it loses call wall support
This isn’t a “rip your face off” squeeze setup — it’s more of a steady gamma-fueled drift higher while dealers stay long hedged.
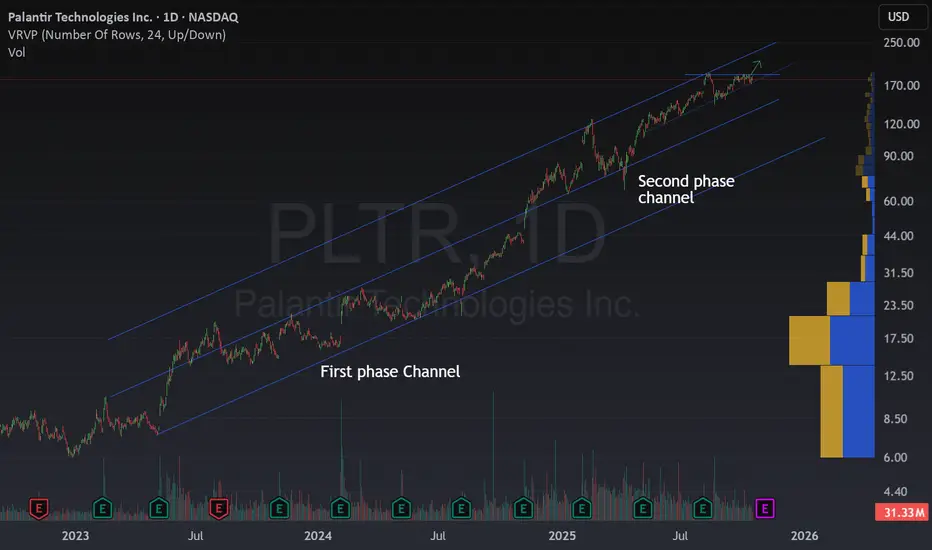
Palantir is Riding a Perfect Uptrend ChannelPalantir has been showing an impressive bullish trend lately.
What’s fascinating is how, from 2023 to 2024, it built a price channel, and after a strong rally, it continued respecting that same channel structure, with the same slope and rhythm, just at a higher price level.
As long as price remains inside this channel, I think the best move is to hold.
Right now, as Palantir approaches the mid-channel zone (blue dashed line) and faces a key resistance that could break soon, it looks like an interesting buy opportunity, if it confirms the breakout.
Several analysts, including Piper Sandler and BofA, have recently set price targets around $200, which aligns with the ongoing bullish momentum.
It’s a great way to join the Palantir rally, but with some caution if you’re holding long-term, it’s definitely running hot!
But… what isn’t these days? 😄