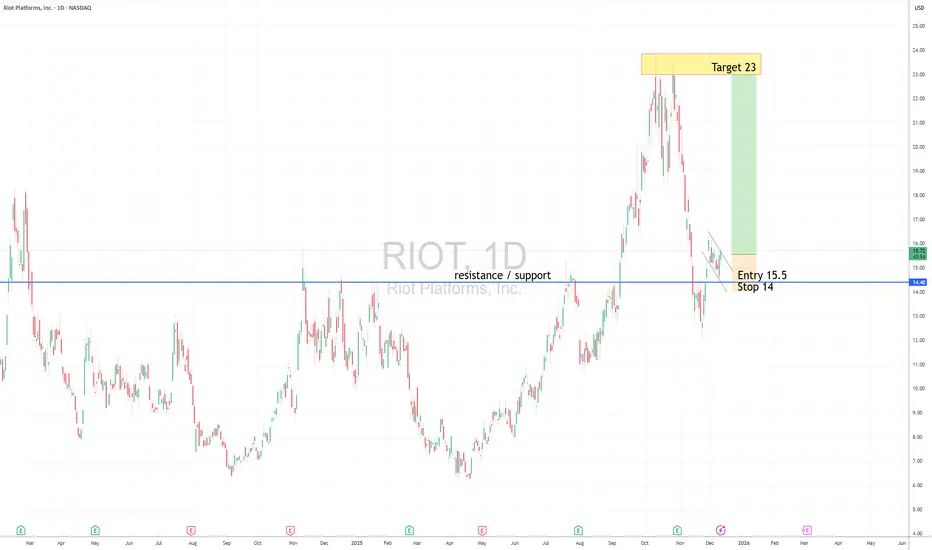
RIOT LongFlag pattern in Uptrend, Near support line
Long entry 15.5
Stop 14
Target 23
Risk management is much more important than a good entry point.
I am not a PRO trader.
In my trading plan, the Max Risk of each short term trade should be less than 1% of an account.
Riot Platforms, Inc. Shs Cert Deposito Arg Repr 0.3333333333 Shs
No trades
Trade ideas
$RIOT Bull Flag (long)There is a potential bull flag forming on the Riot Platforms 4 hourly timeframe.

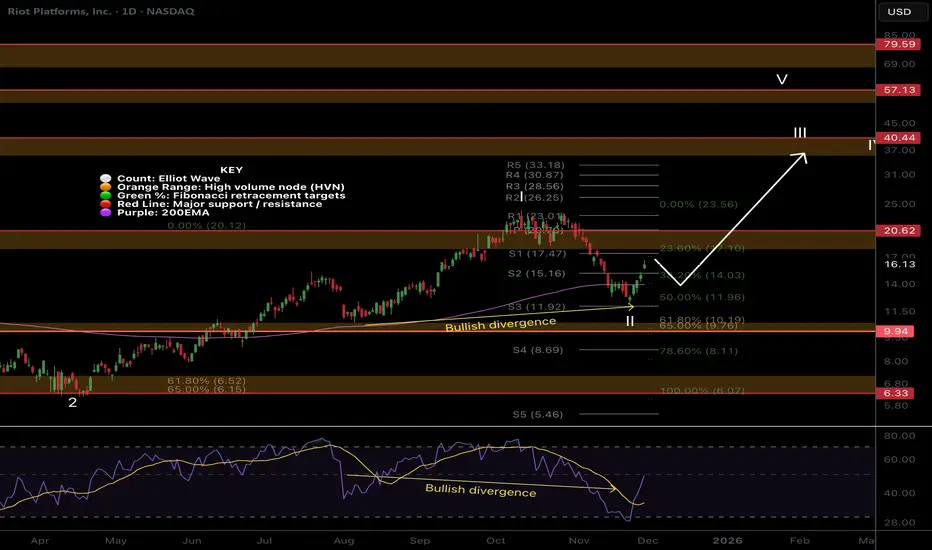
RIOT | DailyNASDAQ:RIOT — Technical Update
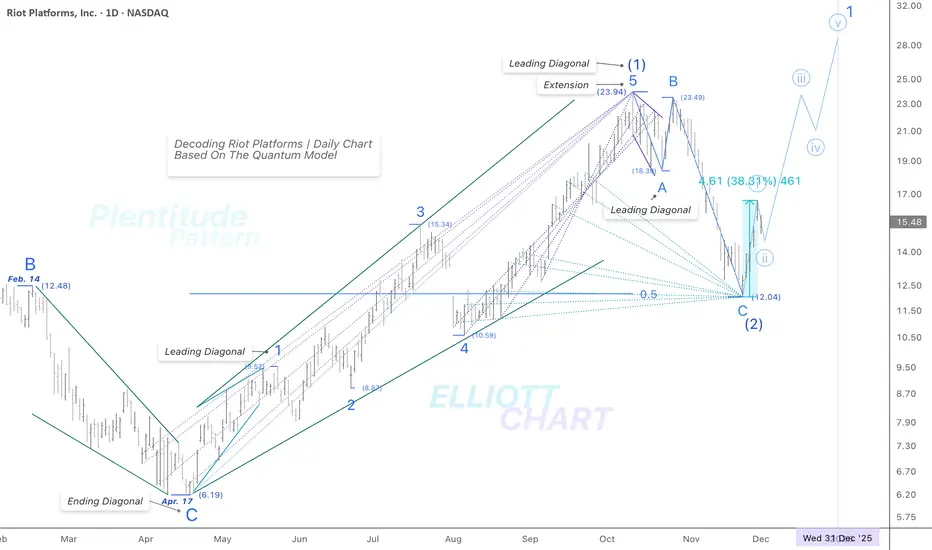
As anticipated in prior updates, RIOT completed a 50% retracement of the rising Leading Diagonal as Intermediate Wave (1), potentially marking the extreme low of Intermediate Wave (2).
Last week’s 38% initial surge — consistent with renewed strength across the broader mining sector — provides strong evidence that Intermediate Wave (3) has begun, though its developing Minor Wave 1 is reflected in the present chart view.
If this impulsive phase continues to unfold, NASDAQ:RIOT is poised to advance toward the 1.618 Fibonacci extension level, which lies beyond the current chart frame.
#StocksToWatch #MarketAnalysis #TechnicalAnalysis #ElliottWave #WaveAnalysis #TrendAnalysis #FibLevels #FinTwit #TradingView #Investing #DataCenters #BitcoinMining #CryptoMining #AIStocks #HPC #AI #BTC #Bitcoin #BTCUSD #RIOT #BlockchainTech #CryptoStocks #MiningStocks #Altcoins #StockAnalysis #QModel #Bullish #CryptoTrading #Investing #StockMarket CRYPTOCAP:BTC #BitcoinStocks #HalvingCycle #Hashrate #MiningSector
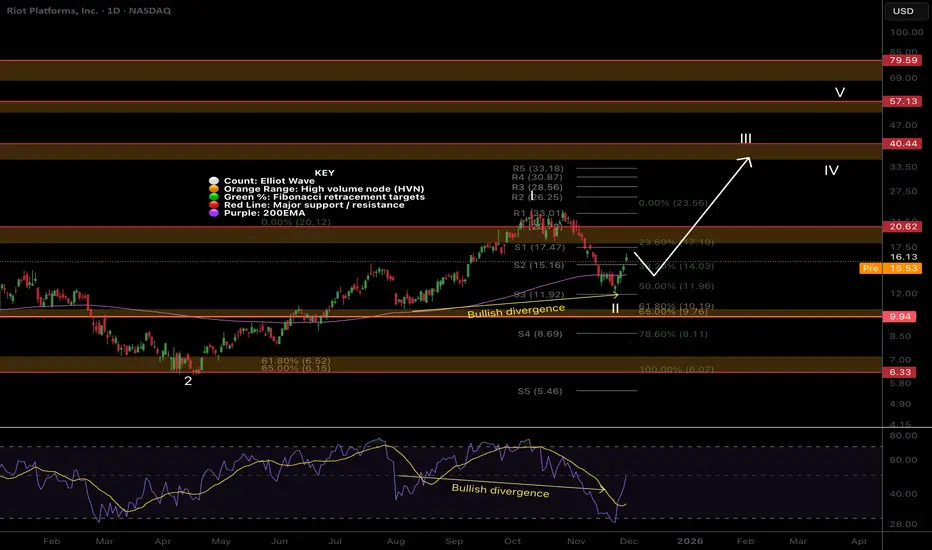
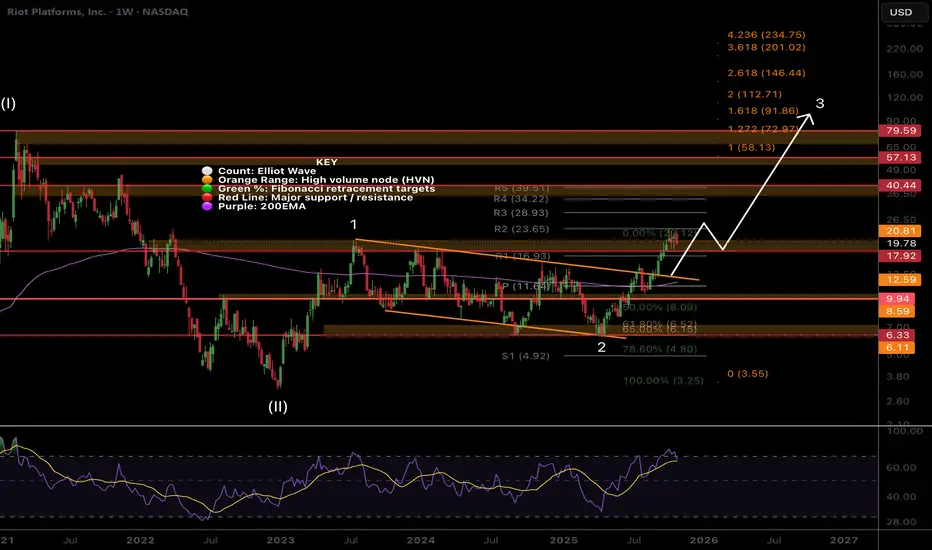
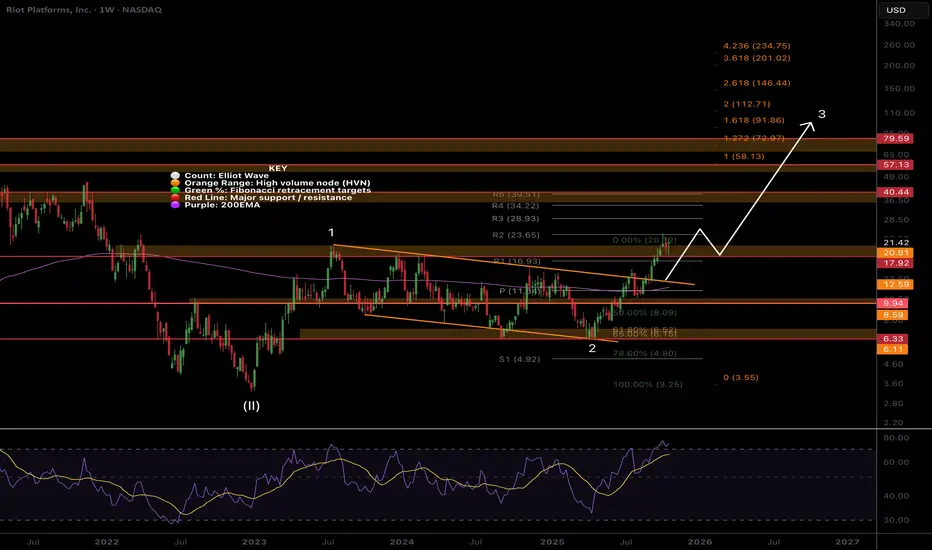
RIOT Macro outlook, weekly bullish divergenceNASDAQ:RIOT tested the upper boundary trend-line after its breakout. Expected behaviour.
A large weekly candle formed after hitting the weekly 200EMA and support suggesting the bottom is in.
Price remains above the downtrend and showed strength by poking above the wave 1 high.
🎯 Terminal target for the business cycle could see prices as high as $112 based on Fibonacci extensions
📈 Weekly RSI has bullish divergence
👉 Analysis is invalidated if we close below $6.33
Safe trading
Riot Platforms, Inc. (RIOT)Company Overview
Riot Platforms, Inc. stands as a vertically integrated leader within the Bitcoin ecosystem. Its core operations are strategically divided into two synergistic segments:
Bitcoin Mining: This is the company's primary revenue driver, where Riot focuses on the relentless expansion of its computational power, known as hash rate. The strategic objective here is to maximize the probability of successfully validating transactions on the Bitcoin network and earning block rewards, thereby directly leveraging Bitcoin's price and network performance.
Engineering: This segment provides a critical competitive advantage through vertical integration. Riot designs and manufactures specialized power distribution equipment and custom electrical products. This not only supports their own mining operations with enhanced efficiency and reliability but also represents a secondary revenue stream and a deep expertise in managing the immense energy demands of large-scale data centers.
Founded in 2000 and headquartered in Castle Rock, Colorado, Riot has established itself as a formidable player, further strengthened by strategic investments in companies like Verady and Coinsquare.
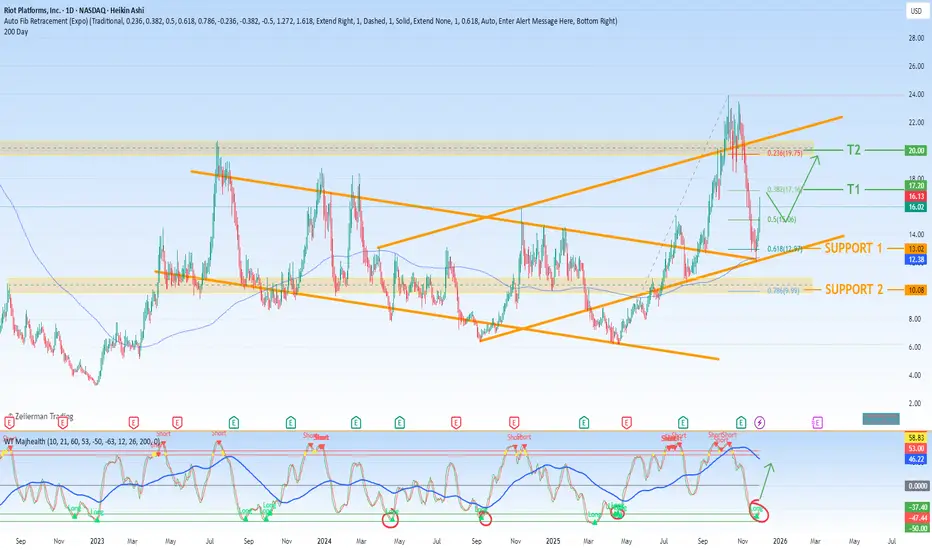
Technical Analysis & Fibonacci Framework
The current price action for RIOT can be effectively analyzed using key Fibonacci retracement levels, which identify potential levels of support (where buying interest may emerge) and resistance (where selling pressure may intensify).
Our analysis identifies two critical tiers of support and two corresponding tiers of profit-taking targets.
Primary Support Zone: The Foundation for a Reversal
The most significant demand zone, where buyer conviction is expected to be strongest, lies between the deep Fibonacci retracement levels. This zone represents a potential accumulation area for long-term investors.
Strong Support (0.786 Fib Level): $9.99
This level represents a deep retracement and is often considered a "last stand" for bulls. A successful hold here would indicate extreme selling exhaustion and could trigger a powerful reversal. It serves as a crucial line in the sand for the bullish thesis.
Significant Support (0.618 Fib Level): $12.97
Known as the "Golden Pocket," the 0.618 retracement is a classic level for trend reversions. A bounce from this area would signal that the longer-term upward trend remains structurally intact and that the current pullback is a healthy correction within a broader bull market.
Profit-Taking Targets: The Path to Recovery and Growth
Should the price find support and initiate a new upward leg, the following Fibonacci levels provide a logical roadmap for potential resistance and profit-taking opportunities.
Initial Target (0.382 Fib Level): $17.16
A rally to this level would represent a significant recovery from the support zone. This is the first major technical hurdle. A decisive break above $17.16 would signal strengthening momentum and open the path toward higher targets.
Secondary Target (0.236 Fib Level): $19.75
Achieving this price point would indicate a robust bullish reversal is fully underway, effectively negating the prior downward move. This level is a key objective for a sustained rally and would bring the stock back into a technically strong position, potentially targeting new local highs.
Strategic Outlook
In summary, RIOT is currently testing a critical juncture defined by a strong support band between $9.99 and $12.97. The reaction at these levels will be pivotal for its medium-term direction. A firm hold and reversal from this zone, particularly if supported by positive broader Bitcoin market sentiment, would validate the bullish setup and project a measured move toward initial resistance at $17.16, with a subsequent primary target at $19.75. Investors and traders should monitor price action closely within this defined Fibonacci structure.
RIOT holding up stronger than the others..NASDAQ:RIOT Price remains in its uptrend and wave II of 3 appears complete with a 3 white knight bullish candle pattern.
Price recovered the daily 200EMA and looks rady for higher.
📈 Daily RSI hit oversold with bullish divergence
👉 Continued downside has a target of the High Volume Node, $10
Safe trading
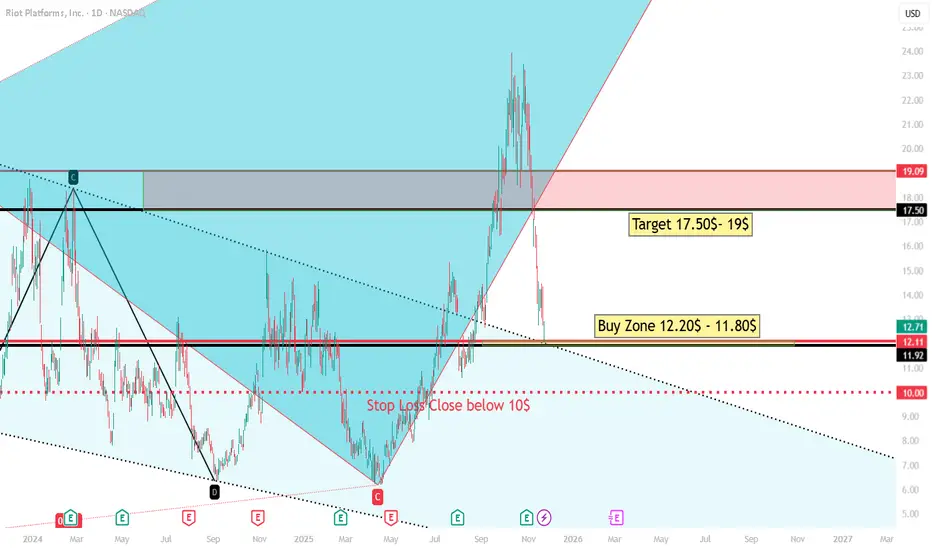
Riot📊 Riot Platforms (RIOT) – Technical Analysis
1. Current Price Action
The stock is trading around $12.7, showing a sharp pullback after a strong rally. The recent decline brought price back into a previously established demand/support region.
2. Key Levels
🔵 Buy Zone: $12.20 – $11.80
This zone is clearly marked on your chart and aligns with:
A previous support–resistance flip
The lower boundary of the recent breakout area
A potential Fibonacci retracement region (based on the structure)
Price is currently sitting just above this area, meaning the stock is approaching an attractive risk-to-reward entry level.
🔴 Stop Loss: Close Below $10
The $10 level is critical because:
It’s a major psychological support
It aligns with the bottom of a broader descending trendline zone
A close below it would break the bullish structure and invalidate the long setup
This makes it a logical and conservative stop-loss placement.
3. Target Zones
🎯 Target 1: $17.50
This level corresponds to:
The previous consolidation / supply zone
A Fibonacci extension / measured move region
A strong horizontal resistance visible on the chart
🎯 Target 2: $19.00
This is the upper boundary of the supply zone and a likely strong resistance point if momentum continues.
These targets provide a 3:1 to 4:1 risk-to-reward ratio, making the trade setup attractive if the buy zone holds.
4. Trend Structure
Your chart highlights:
A completed harmonic/gartley-like formation (C-D leg)
A breakout from a long-term descending trendline
A bullish channel formation after the breakout
The current pullback appears to be a healthy retest of:
The breakout zone
Major support
Demand region
If price stabilizes around $12.20–$11.80, the uptrend may resume.
5. Volume & Momentum
Although not explicitly shown in the screenshot, the price behavior indicates:
A sharp decline but without major capitulation volume
A possible formation of a higher low (if Buy Zone holds)
This suggests sellers may be losing strength as price approaches support.
📈 Summary – Professional Outlook
Bias: Bullish as long as price stays above $10
Entry Area: $12.20 – $11.80 (high-probability demand zone)
Targets:
First: $17.50
Second: $19.00
Stop Loss: Close below $10
Setup Type: Pullback to support / trend continuation
RIOT in BUY ZONEMy trading plan is very simple.
I buy or sell when at either of these events happen:
* Price tags the top or bottom of parallel channel zones
* Money flow volume spikes beyond it's Bollinger Bands
So...
Here's why I'm picking this symbol to do the thing.
Price in buying zone at bottom of channels
Money flow momentum is spiked negative and under bottom of Bollinger Band
Entry at $14.1
Target is upper channel around $19 or moving average at $18
Set your own stops
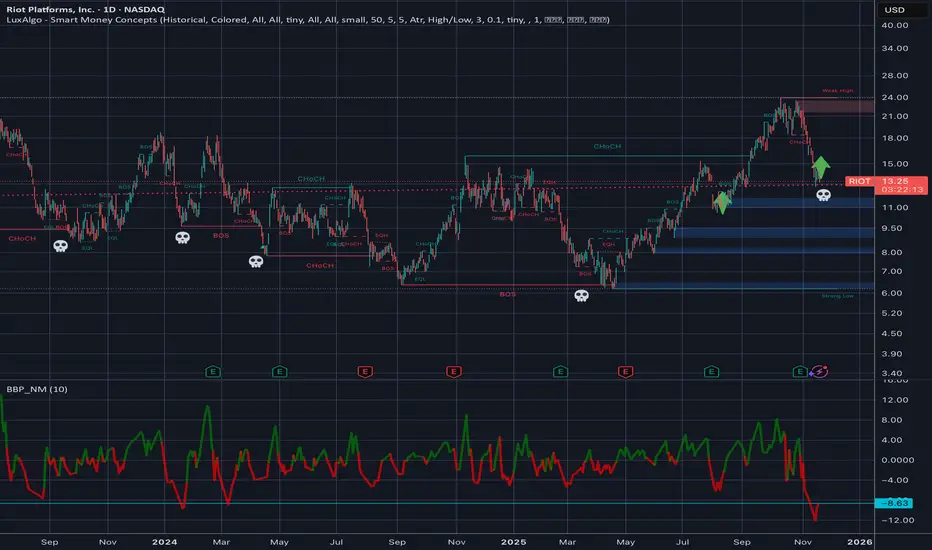
I’m Calling It: This Is the Bottom Ok, i get it, there is a risk of being wrong and early-wrong, but holistically - i think there is enough evidence that we've bottomoed. im 71% confident :o - Ok, here is my cycle-aware, data-driven technical analysis
Multi-Timeframe Structure = Capitulation Low
RIOT and CLSK show aligned structure across 1D / 3H / 1H:
Clear BOS (Break of Structure) into deep discount
Liquidity taken beneath prior swing lows
Price tapped a historical multi-month demand block
This exact sequence produced bottoms in:
Sep 2023
Aug 2024
Apr 2025
Same setup, different date.
Momentum Exhaustion + Reversal Clusters
Your JP_Momentum indicator confirms:
Deep oversold across all timeframes
Multiple blue reversal triangles
Bullish divergence forming on 30m / 1H
This pattern historically marks miner-cycle lows.
Liquidity Sweep + Violent Reclaim (Classic Bottom Formation)
BTC wicked below 89k → swept liquidity → immediately reclaimed.
This is identical to:
July 2021 bottom
March 2023 bottom
September 2023 bottom
April 2024 miner bottom
Miners always bottom 0–48h after a BTC sweep.
We are inside that window.
Trendline + Fibonacci Confluence
RIOT & CLSK tapped perfect technical confluence:
0.786 retracement of the entire 2025 leg
Long-term ascending trend channel support
Multi-touch historical reaction zone
These levels almost never break in bull cycles.
Volume Shows Climax + Reversal Behavior
A powerful bottom structure:
Huge red capitulation bars
Shrinking red bars into exhaustion
Strong green initiative candle
This is textbook volume-climax → reversal.
Price rarely prints this twice.
Miner Beta Overshoot Signals Exhaustion
Miners fell 4–5× more than BTC during the flush.
This is exactly how miner bottoms occur in high-volatility phases.
Statistically normal rebound range:
RIOT: $13 → $19–21 .
Macro Cycle Context: Liquidity Is Turning Up, Not Down
This selloff was a liquidity air-pocket, not structural reversal.
Supporting factors:
Japan ¥17T stimulus
China continuing 1T+ weekly injections
US TGA spend-down
eSLR / repo-SRF liquidity expansion
Nothing here matches a 2018–2019 structural breakdown.
🔥 FINAL THESIS
Oversold everywhere
Liquidity sweep completed
Trend support respected
Volume climax printed
Miners overshot and reversed
Macro liquidity improving
Probability bottom is IN: ~80–85%
Invalidation only if BTC closes below $88,800 on the daily.
If this isn’t the exact bottom, it’s within 3–5% of it.
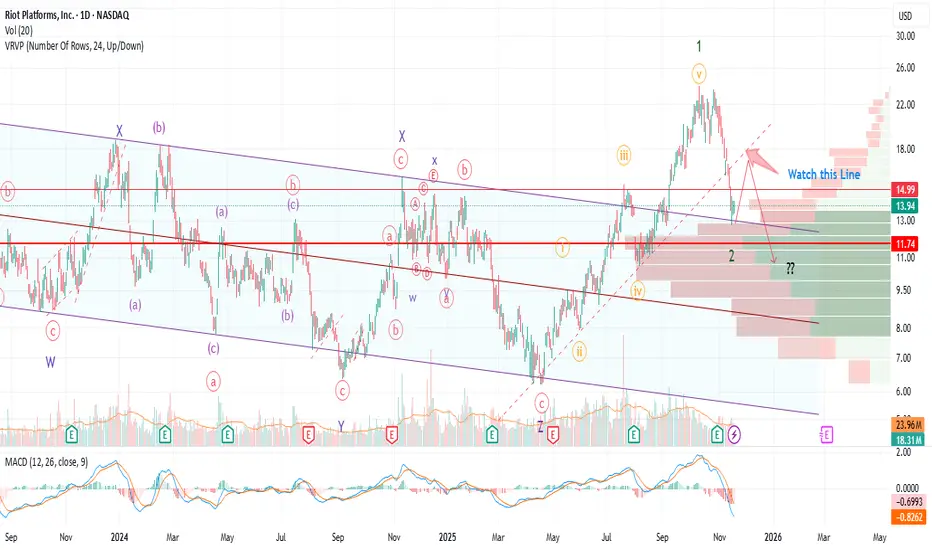
RIOT: Is the Low in?RIOT got support on a high volume node, around 0.618 fib retrace area. MACD is signaling a potential turnaround. The price decline was also on a low volume, suggesting a counter trend correction, rather than an impulsive one, also suggesting capitulation hasn't been done yet. Crypto market overall is super oversold and looking for at least a dead cat bounce. So, is the low in for RIOT? Maybe not. RIOT has a tendency of a long wave 2 with at least 2 fake out moves. This time might not be any different. The first clue would be to see the price getting support above the broken trend line. Second clue would be price getting above $24. Until then, I would expect price to get resistance on the trend line and making its way towards $11 support, maybe a bit lower. To be transparent, I did buy back some for the bounce play.
KLOK -RIOT-
IV4--11/13/25
OI--OK
Liq.--OK
EarningD.--01/29/26
Trend--UP
D.atr.W--1.65/2.98
1)ND-Bull Put-SP
P-12/+9
Exp.--12/19/25
E--Current Price
Sl--12.29
OR
2)D-Bull Put-SP
P-12/+7.5
Exp.--12/26/25
E--13.25
Sl--12.29

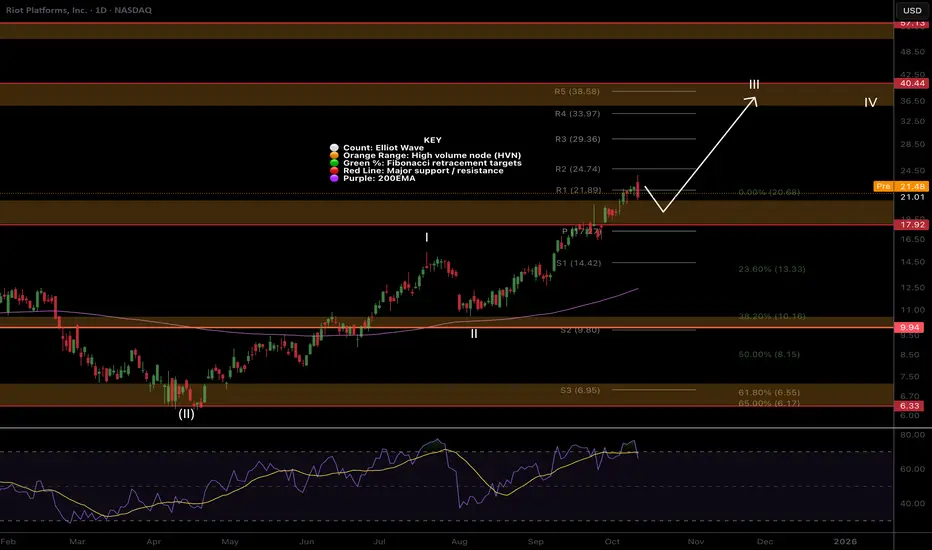
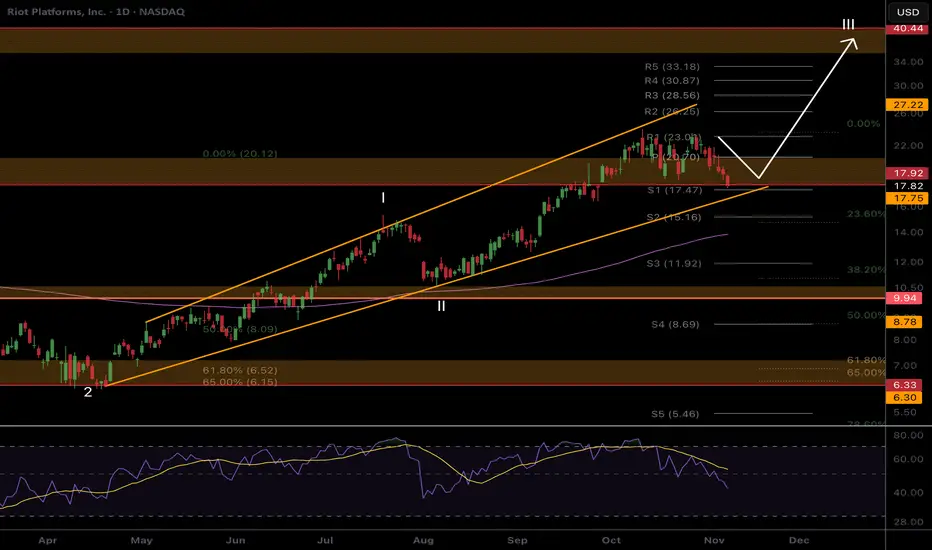
RIOT Respecting the boundariesPrice remains in its uptrend channel demonstrating shallow pullbacks as is characteristic of wave III.
Price is consolidating above support which could lead to a break down below but still within the boundaries of the channel. Daily 200EMA is ascending to meet price and support lines.
Daily RSI has printed unconfirmed bullish divergence at the EQ.
Continued upside has a $40 target at the next High Volume Node.
RIOT-Still bullishWe had a slightly crappy month closed.
But zoom out, monthly candle still closed in green,
We just broke out of a longgg~ 2 years side way accumulation, it seems unlikely we are stop going up anytime soon.
Still , Hodl and Pray.

RIOT, nothing changed, Higher...Riot is another low cap volatile asset that keeps people afraid with its wild swings as I am seeing panic in my comments across platforms.
Price remains in momentum breaking out of the channel in a wave 3 with a minimum target of the 1.618 Fibonacci extension at $91, a 4x from here. Wave 2 completed at triple support- Fibonacci golden pocket, High Volume Node and channel boundary before quickly overcoming the weekly pivot and 200EMA. Breaking out above wave 1 is a show of strength.
Price should stall at the High Volume Nodes as supply comes in; $21, $40 and $57 but ultimately they should be overcome.
🎯 Terminal target for the business cycle could see prices as high as $112 based on Fibonacci extensions
📈 Weekly RSI is oversold with no divergence and can remain here for months as price keeps increasing.
👉 Analysis is invalidated if we close back below $9
RIOT Platforms – Bullish Breakout Setup (Post-Earnings Momentum)Riot reported earnings after hours on Thursday, October 30, 2025, and crushed expectations:
• EPS: 0.519 vs –0.075 estimate → +791.7% surprise
• Revenue: $180.2M vs $172.2M estimate → +$8M (+4.65%) beat
This type of earnings beat typically signals renewed bullish sentiment, especially with Bitcoin showing early signs of strength.
On the 1H chart, price has consolidated beneath key resistance around $21–$24, forming a structure that looks ready for expansion. My expectation is that RIOT will first target $29.29, then retest it as new support before continuing higher toward the next liquidity zone in the $68–$78 range (yellow box / arrow projection).
If Bitcoin pushes aggressively toward the $79K region, I expect momentum to accelerate, confirming this upside path.
Summary:
• Bias: Bullish
• Key levels: $21.00 → $29.29 → $68.00 → $78.00
• Invalid below: $17.50 support breakdown
• Catalyst: Major EPS & revenue beat + BTC strength

RIOT | MASSIVE Rally Incoming | LONGRiot Platforms, Inc. is a bitcoin mining company, which engages in the provision of special cryptocurrency mining computers. It invests in Verady, Coinsquare, and Tess. It operates through the Bitcoin Mining and Engineering segments. The Bitcoin Mining segment focuses on maximizing ability to successfully mine Bitcoin by growing hash rate. The Engineering segment designs and manufactures power distribution equipment and custom engineered electrical products that provides them the ability to vertically integrate many of the critical electrical components and engineering service. The company was founded on July 24, 2000 and is headquartered in Castle Rock, CO.

RIOT upwards momentum well in tactNASDAQ:RIOT Price remains in momentum breaking out of the channel in a wave 3 with a minimum target of the 1.618 Fibonacci extension at $91, a 4x from here.
Wav 2 completed at triple support- Fibonacci golden pocket, High Volume Node and channel boundary before quickly overcoming the weekly pivot and 200EMA. Breaking out above wave 1 is a show of strength,
Price should stall at the High Volume Nodes as supply comes in, $21, $40 and $57 but ultimately they should be overcome.
Weekly RSI is overbought where it can stay for months as price extends.
Higher Bitcoin = Higher targets
Safe trading
RIOT – Short-Term Bullish SetupNASDAQ:RIOT completed its wave 4 pullback after attracting buyers at the #BlueBox support zone of $18.34–$17.24, and has already reacted higher from that level.
Currently, the wave ((ii)) correction is unfolding in 3 swings, reaching another equal legs area at $20.49–$19.58, where price is expected to resume the rally if support holds.

RIOT Breakout Setup – Eyes on $22.90 Zone
RIOT is forming a bullish pennant right below key resistance at $22.90.
A breakout above this level could open the way toward $23.96.
Failure to hold above $22.00 might lead to a short-term pullback toward $21.00.
📊 Bias: Bullish above $22.00 – watching for breakout confirmation.
🎯 Targets: 22.94 / 23.96
🛑 Support: 21.00

RIOT: strong trend pump?Having the narrative of Bitcoin mine company that transform it’s facilities to become AI data center.
PA previous monthly candle closed, broken out of a 2 years consolidation bullish flag to the upside.
If this is turn out to be a start of a strong trend/fomo pumping price action ,
Potential upside target based on historic pump $170-$600

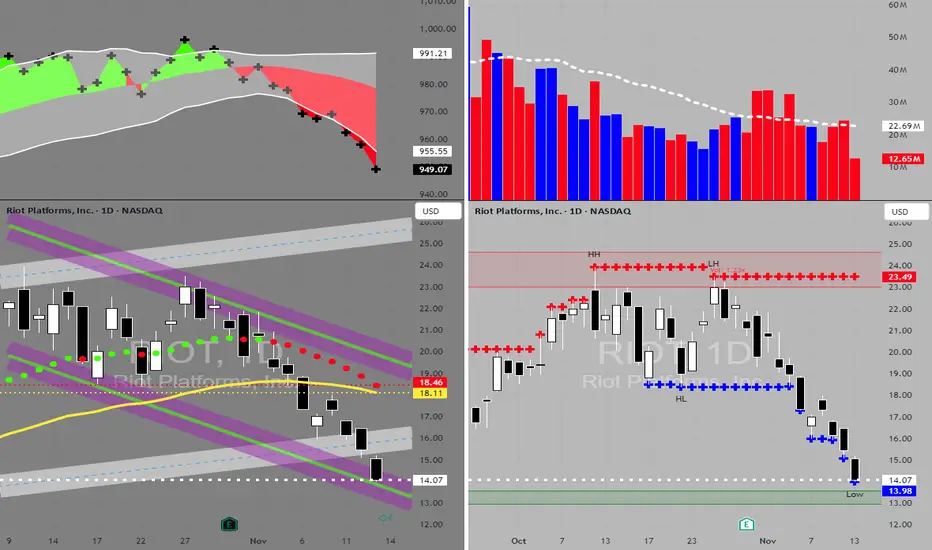
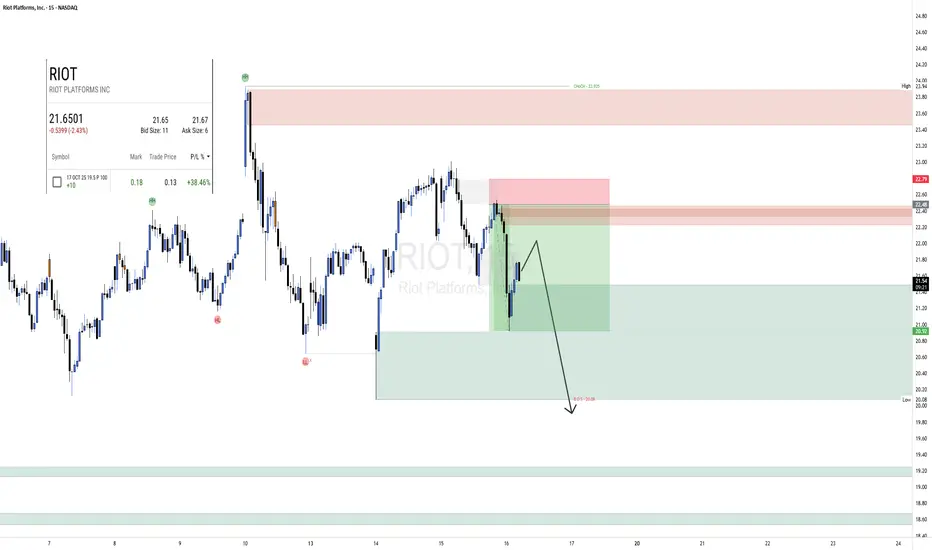
RIOT ShortMarket Structure:
RIOT is showing a clear transition from bullish to bearish structure. After forming a Higher High (HH) around $23.95, price failed to maintain upward momentum and broke below the previous Higher Low (HL) near $20.98, establishing a decisive Break of Structure (BOS) to the downside. This confirms a shift in market sentiment, aligning with the Change of Character (CHoCH) marked near $23.95. The overall structure now favors continuation lower unless buyers can reclaim the $22.40–$22.60 region.
Supply & Demand Zones:
The upper supply zone between $22.20 and $22.60 remains strong—price previously dropped sharply from here, leaving behind large bearish candles with minimal pullback, showing strong seller control. The main demand zone now sits between $20.00 and $21.00, where buyers last stepped in aggressively and caused a short-term bounce. However, given the bearish structural shift, this demand appears weakened and could soon be tested or broken. A deeper untested demand region is visible around $18.50–$19.20, which remains a more significant liquidity pool if price continues its descent.
Current Price Action:
Price is currently rebounding modestly from the mid-range of the demand zone but remains under short-term supply pressure. The projected path suggests a minor pullback toward $22.20–$22.40, followed by renewed selling interest and a continuation lower toward $20.00 or below. This pattern aligns with a standard lower-high formation before the next leg down.
Bias & Outlook:
The trade bias is bearish, anticipating a continuation to the downside after a corrective move. The expected direction is down toward $19.50–$20.00. A clean break above $22.60 would invalidate the bearish setup and signal that buyers are regaining control.
Momentum & Candle Behavior:
Momentum currently favors sellers, with recent impulsive bearish candles showing wider bodies and smaller wicks compared to the weaker bullish retracements. No reversal candle patterns are confirmed yet—just compression and retracement within the bearish leg.
RIOT wave 3 continues, $57 min targetWave 3 continues in NASDAQ:RIOT per previous posts with a minimum target of the $57 High Volume Node

RIOT.. Nothing changed, $40 targetNASDAQ:RIOT broke out through resistance earlier than expected! A retest of the High Volume Node as support is highly likely event and price has a little down to go to get there. It may even be front run today.
RSI is overbought with no bearish divergence and can persist here for months in trending asset.
Wave II is underway and the next target is $40 High Volume Node resistance and the R5 daily pivot.
Safe trading