Learn from my mistake! Failing to buy $RKLB at $40I tend to take an interest in aerospace and defence stocks....and increasingly energy and space stocks. Which brings us to $RKLB.
Its led a charmed life the last 18 months - and has demonstrated the volatility that you'd expect from a small company in a new industry.
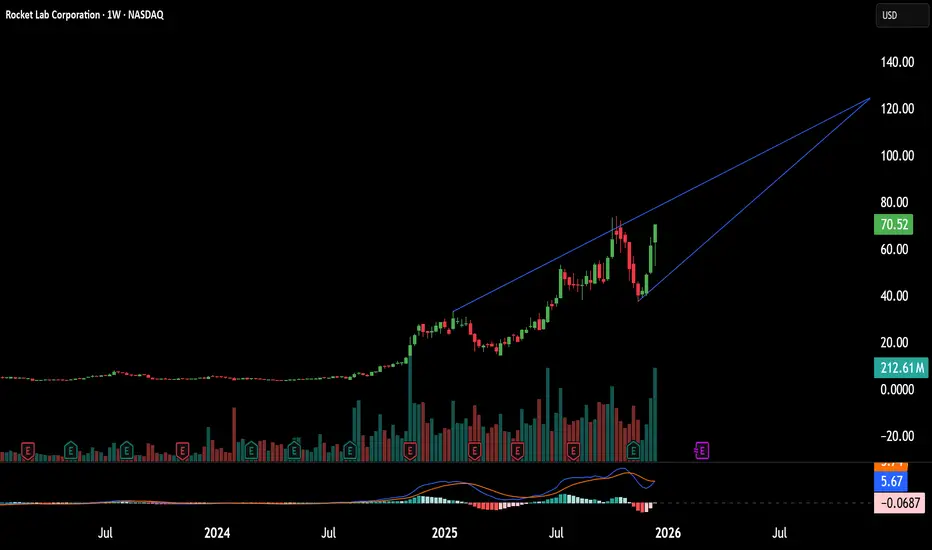
Price had recently rocketed north of $72 dollars, and having over-extended itself, it managed to to slide back rapidly. When it was fell back to $40 I where I started to get interested again. On the weekly chart price printed an inside bar spinning top. My view was that price would dip beneath $40, and flush out the recent lows, before reversing north. Which is when I planned to buy.
The best laid plans of mice and men. Price never came back below $0 before launching itself north and over the next two week traded as high as $64! My desire to get a perfect entry meant I missed out completely. So please learn from my mistake. There is no perfection in trading. Have a simple plan and execute well. And when you start trying to be a smart-arse and perfect an entry then have a word with yourself!
Anyway, overall I'm bullish on this stock.
Rocket Lab Corporation DR
No trades
Market insights

Fasten your seatbelts, we're about to take off!Rocket Lab (RKLB) is approaching a decisive technical inflection point after several weeks of heavy correction. The structure is shifting: compression, potential breakout, and early momentum recovery. Everything is lining up for a strong directional move.
Overall Structure
Price is attempting to break out of the descending H1 channel that has guided the entire decline from the 73–74 highs.
The 37.50 zone acted as a major floor: previous liquidity block + value-area low + FVG fill. The rebound that followed shows clear buyer defense.
Current Zone: 42.50 – 45.00
This is a rare confluence area:
EMA45
MA25/200 cluster
Retest of the former channel boundary
Key horizontal resistance
This zone is the switch.
Above it = takeoff.
Below it = turbulence.
Possible Scenarios
Bullish:
If RKLB closes an H1 candle above 45.00, the reversal becomes technically validated. Targets are straightforward:
53.80 (major pivot + prior distribution zone)
60.70 (extension of the breakout structure)
This represents a +20% to +40% upside if confirmation holds.
Bearish:
Rejection below 42.50 would send the price back toward 41.70, then possibly a full retest of 37.50 if momentum fades.
Momentum Check
RSI reclaimed the 50 line and is stabilizing above it — constructive, but still fragile.
MACD crossed bullish, though without real histogram expansion yet — early signal, not confirmed.
In summary: RKLB is entering a critical decision zone. The 45.00 level is the firewall. A clean breakout unlocks a high-velocity bullish corridor. A rejection keeps price trapped in the lower range.
Fasten your seatbelts,
The next move could be explosive.

$RKLB (NASDAQ) Weekly Structure & Possible ScenariosRKLB is currently trading around a key reaction zone after a strong impulsive move from the recent lows. The weekly structure suggests price is at an important decision point, with liquidity resting both above and below current levels.
At this stage, two primary scenarios stand out:
🟢 Bullish Continuation Scenario
Price holds above the mid-range support zone (~46–50).
A shallow pullback is followed by continuation toward higher-timeframe liquidity.
Upside targets are located around:
~97–100
~105
~112
These levels align with previous supply and inefficiencies on the weekly timeframe.
🟠 Pullback / Re-accumulation Scenario
Price rejects near current levels (~60–62).
Deeper retracement toward the demand cluster around 41–46.
This zone could act as a higher-timeframe support and offer better risk-defined long opportunities if structure holds.
Overall, the higher-timeframe bias remains constructive, but confirmation is needed at current levels. Patience is required to see whether price accepts above resistance or seeks additional liquidity below before continuation.
⚠️ Financial Disclaimer :
Nothing here is financial advice. If you trade based solely on internet posts, your wallet may experience high volatility — and possibly a full liquidation event. Always DYOR

Eyes on $110$110 is the measured move.
Key Catalysts
Spacex Eyeing $1-$1.5 Trillion valuation.
Neutron Launch
SDA Awards & Golden Dome Contract (High Probability)

Rocket Lab’s Strategic Ascent: Beyond the NumbersRocket Lab (NASDAQ: RKLB) has solidified its status as a cornerstone of the modern space economy. Following a turbulent period that saw shares retrace nearly 50%, the stock has staged a commanding recovery, rallying roughly 111% year-to-date. This resurgence is not merely a product of market speculation; it reflects a convergence of geopolitical necessity, operational maturity, and favorable macroeconomic shifts.
Geostrategy and Defense Dynamics
The company’s recent momentum is deeply rooted in shifting geopolitical realities. The successful STP-S30 mission for the U.S. Space Force, launched five months ahead of schedule, underscores Rocket Lab’s critical role in national security. In an era where orbital assets are vulnerable to kinetic and cyber threats, the ability to rapidly replace satellites is a strategic deterrent. Rocket Lab provides the "responsive space" capability that Western defense planners demand.
Furthermore, the dedicated launch for the Japan Aerospace Exploration Agency (JAXA) highlights a strengthening of allied aerospace integration. As nations like Japan seek to diversify launch providers away from domestic bottlenecks, Rocket Lab has emerged as the preferred neutral partner. This expands its total addressable market beyond U.S. borders, insulating it from single-market risks.
Industry Trends and Valuation Benchmarks
A massive sector-wide repricing is underway, catalyzed by reports of a potential SpaceX IPO in 2026 at a $1.5 trillion valuation. This news has fundamentally altered how investors assess the space industry’s long-term economics. SpaceX’s valuation serves as a powerful anchor, validating the orbital economy’s scale.
As the only other publicly traded, vertically integrated launch provider with a proven track record, Rocket Lab is the primary beneficiary of this sentiment shift. Capital that once flowed into speculative pre-revenue SPACs is consolidating into proven operators. Rocket Lab’s business model, which combines launch services with high-margin space systems, offers investors a tangible hedge against the capital-intensive nature of pure launch plays.
Operational Excellence and Culture
Corporate culture remains Rocket Lab’s hidden alpha. While the broader aerospace sector struggles with chronic delays, Rocket Lab’s delivery of the STP-S30 mission ahead of schedule speaks to a unique internal ethos. This "execution-first" culture sharply contrasts with competitors who rely on PowerPoint engineering.
Management’s ability to navigate high-tech manufacturing challenges while maintaining launch cadence has built a reservoir of institutional trust. This reliability is a defensive moat. In the launch business, reputation is currency; Rocket Lab’s consistency allows it to command pricing power and secure long-term government contracts that competitors cannot access.
Technology and the Neutron Horizon
The upcoming Neutron rocket represents a technological inflection point. Scheduled for its maiden flight in the first half of 2026, Neutron moves the company from a small-lift niche to medium-lift dominance. This vehicle targets the lucrative constellation deployment market, currently a SpaceX monopoly.
From a patent and science perspective, Neutron’s design—featuring unique carbon composite structures and reusable fairings—signals a leap in material science application. These proprietary engineering solutions create high barriers to entry. By securing intellectual property around rapid reusability and automated manufacturing, Rocket Lab protects its margins against commoditization.
Conclusion
Rocket Lab’s recovery is structural, not accidental. It is driven by a unique intersection of defense utility, superior execution, and a repricing of the space sector’s potential. As the company prepares for the Neutron era, it is shedding its label as a "small launch" provider and emerging as a diversified aerospace prime.
RKLB | Overextended Into Supply | SHORTNASDAQ:RKLB
Ticker: RKLB (Rocket Lab)
Timeframe: 1H
Bias: Short / Mean Reversion
Author: SHKSPR
Summary
RKLB just printed a parabolic leg straight into a major institutional supply zone, with the final candle closing outside the upper Keltner Channel. This is a statistically powerful signal for exhaustion and mean reversion. Volume profile confirms a thin liquidity pocket below, making the downside path clean.
This move is not sustainable without a pullback — and the chart is flashing a clear short.
Bearish Confluence:
1- Price Closed Outside Keltner Channel
RKLB broke beyond the upper KC band — a sign of volatility blowout and potential exhaustion.
Moves outside the channel historically revert back toward the median band.
2- Rejection From Supply (62.75–63.00)
The candle wicked into a well-defined supply zone:
Prior imbalance
Strong seller presence
Immediate rejection
Absorption at the top of the move
This is the exact area where smart money distributes.
3- Volume Profile: No Acceptance Above
The profile shows a thin volume region above the supply block.
Price briefly visited and got rejected instantly — signaling:
No willingness to build value above
Buyers are exhausted
Sellers are defending levels aggressively
4- Clean Targets Below
TP1: 61.87 — micro HVN + structural retest
TP2: 60.48 — Keltner median + volume shelf
A break below TP1 accelerates the drop.
5- Structure: Parabolic → Stall → Wick Reversal
Classic blowoff pattern:
Vertical expansion
Micro topping wick
Shift in momentum
High R/R short window
Market psychology: buyers trapped at the top, sellers preparing to unwind the move.
Trade Plan:
Short Zone: 62.75–63.00
Stops: Above 63.50 high
Targets:
TP1: 61.87
TP2: 60.48
Invalidation: 1H candle close above supply zone
Final Outlook
RKLB is extended, rejected from supply, out of volatility bounds, and sitting above a liquidity vacuum. Unless buyers reclaim and hold above the supply zone, the path of least resistance is down.
This is a high-probability mean-reversion short setup backed by structure, volatility, and volume profile.

It's a time for RKLB - 45% potential profit - 62 USDThe chart shows Rocket Lab Corporation on the daily timeframe. After a strong bullish trend, the price entered a deep correction phase, dropping into the 41–42 USD area. Currently, the decline appears to be losing momentum, and price action shows signs of stabilizing around a key support zone. This area has previously acted as a demand zone, which increases the likelihood of a short-term bounce.
The price is currently positioned below two moving averages, but it has started to approach them from underneath. This may indicate a potential short-term trend reversal if the price breaks above the first moving average and holds above it. Such behavior often signals the beginning of a corrective or reversal move to the upside.
The RSI indicator is in low territory, suggesting that the stock is near oversold conditions. Historically, this often results in a technical rebound as selling pressure weakens and buyers re-enter at discounted levels. Moreover, recent candlestick structure indicates decreasing selling pressure and early signs of demand returning to the market.
The highlighted price projection toward the 62 USD level reflects a potential corrective move back into a previous resistance zone, which also aligns with a psychological price level. From a technical perspective, this area represents a logical first upside target following such a strong downward move. If buying momentum continues and price breaks through local resistance levels, a move toward the 60–62 USD region in the near term is a realistic scenario.
Overall, the technical picture suggests that the stock may be entering an early recovery phase after a strong decline, with growing probability of a short-term upward movement. The coming sessions will be critical — a breakout accompanied by increased volume would strengthen the case for a move toward the 62 USD level.
Potential TP: 62 $
⚠️ Disclaimer
This analysis is for educational and informational purposes only and does not constitute financial or investment advice. The financial markets involve risk, and past performance is not indicative of future results. Always conduct your own research or consult with a licensed financial advisor before making any investment decisions.

Quant Signals V3 RKLB Bullish Momentum Versus Structural RiskRKLB Swing Signal | 2025-12-12
Ticker: RKLB
Signal Type: Swing (Options)
Signal Date: Dec 12
Time Horizon: ~14 days (to Dec 26)
Primary Direction: BUY CALLS
Confidence: 65%
Conviction: Medium
Risk Level: Moderate (extended move + model conflict)
💰 Trade Setup
Strike Focus: $60 CALL
Entry Zone: ~$6.25 – $6.50 (ideal near $6.38)
Target 1: $9.57 (≈ +50%)
Target 2: $12.76 (≈ +100%)
Stop Loss: $4.47 (≈ −30%)
Position Size: ~3% of portfolio (reduced due to volatility)
📈 Technical Overview
Recent Move: +54% single-day surge (very strong momentum)
Trend: Bullish breakout, but short-term overextended
VWAP Support: ~$52.11 (major structural support)
Swing Range: $55.61 – $64.15
Volume: 0.8× prior swing (not climax yet)
Read: Momentum favors continuation, but pullbacks are likely.
🧠 Market & News Context
Broader Market: Strong bullish (SPY bullish, QQQ moderately bullish)
Sector: Space / Aerospace momentum accelerating
News Sentiment: Highly bullish
Rocket Lab execution strength
Space sector hype + SpaceX IPO speculation
🧾 Options Flow
Put/Call Ratio: 0.50 → bullish institutional bias
Largest Flow: Heavy call positioning
Interpretation: Smart money leaning upside
⚠️ Model Conflict (Important)
LLM Direction: BUY CALLS
Katy Chart: BUY PUTS (large downside projection)
Conflict Severity: HIGH
What this means:
Momentum traders favor calls, but Katy model warns of a potential sharp pullback. Risk management is critical.
🎯 Trading Plan Guidance
Best entries on pullbacks, not green-chasing
Consider scaling out at Target 1
Tight discipline on stop loss
Expect high volatility after such a large move
🧠 Summary
RKLB is a high-momentum swing setup with strong bullish flow, but it is extended and model-conflicted. This is a momentum continuation play, not a low-risk entry. Position sizing and exits matter more than direction.

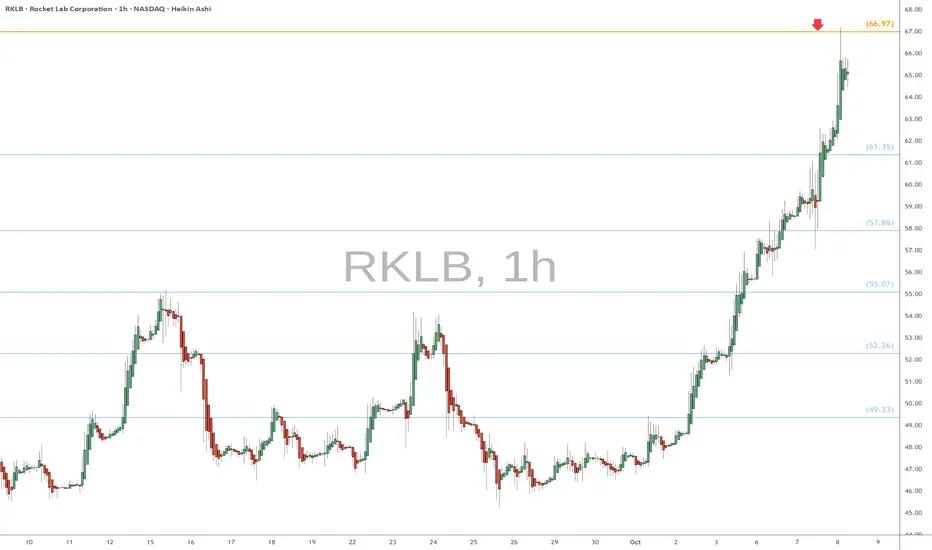
RKLB eyes on $66.97: Golden Genesis fib could make for a TOP RKLB rocketing (lol) from the last Golden Genesis break.
Now approaching the next Golden Genesis fib at $66.97
Look for a Dip-to-Fib or Break-n-Retest for next move.
.
Previous heads-up at last Golden Genesis:
Hit BOOST and FOLLOW for more such PRECISE and TIMELY charts.
========================================================
.
Ambitious expeditionThis idea suggests fractal repitition and some future announcement of a mission that will launch bears into submission and release any inhibition investors have regarding the decision to make an acquisition.

ABCD Pattern?RKLB Analysis
CMP 51.83 (09-12-2025)
Immediate Resistance seems to be around 59 - 60
& then around 70 - 72.
If 74.30 is crossed & sustained, we may witness 90+
However, it should not break 37 now.


Rocket Lab to 80$Rocket Lab
NASDAQ:RKLB is showing a high-probability setup for a major run, supported by a bullish technical structure and strong underlying fundamentals.
Technical Perspective
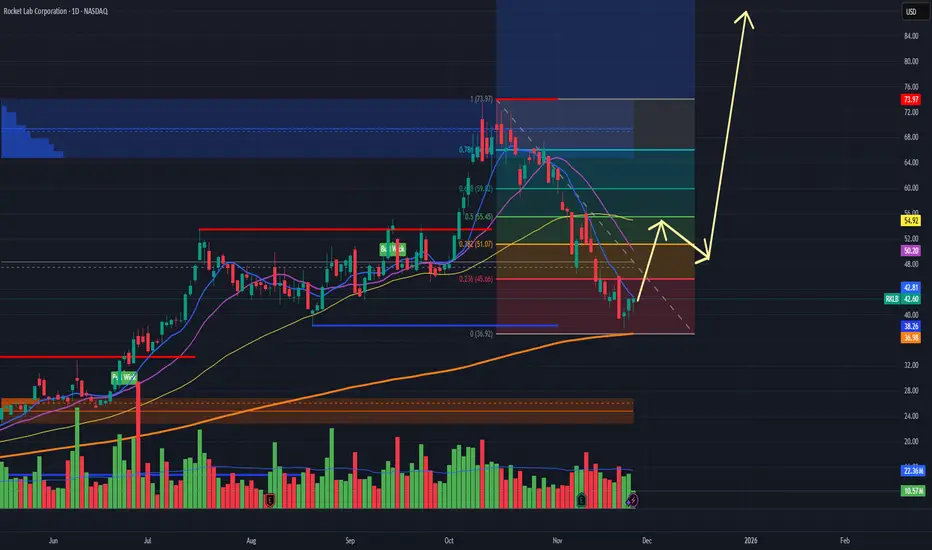
The daily chart reveals Rocket Lab has bounced off its recent lows near $36.90 on 200SMA, forming a potential bottom with climbing volume. Fibonacci retracement levels show key resistance around $51 and $54, and a breakout above these puts the $73 and $83 zones firmly in play. Price action is now holding above the rising 200-day moving average—often viewed as a strong support line—and the yellow arrows forecast a classic “ABC” recovery pattern targeting prior highs and new expansion zones.
Momentum and volume profiles back this thesis: the last few green bars suggest accumulation is underway, and the blue buy zone near $42.60 offers a defined risk entry. Such setups feature optimal reward/risk ratios for swing and position traders.
Fundamentals
Rocket Lab recently posted $155 million Q3 revenue, up 48% year-over-year, with improving gross margins and projections for record turnover next quarter. The company sports a healthy contract pipeline (including government/hypersonic deals), rapid satellite deployment, and consistent launch cadence—all signs of operational momentum.
Analysts now see upside targets between $55 and $83, driven by both revenue acceleration and vertical integration. Most importantly, Rocket Lab continues to narrow EBITDA losses, proof that its path to profitability is intact.
Why a Double Is Plausible
Technical setup favors a rally back toward the $80 level if supply at $54 is absorbed.
Growth rates far exceed sector averages; additional launches and government contracts can fuel a re-rating.
Accumulation on the chart supports a near-term reversal and multi-month breakout.
With momentum building and fundamentals supporting a much higher valuation, Rocket Lab is positioned to potentially double from current levels within the next rally cycle.
QuantSignals V3: RKLB Put Setup ActivatedRKLB QuantSignals V3 Weekly 2025-11-25
Ticker: RKLB
Signal Type: Weekly Short-Term Play
Direction: PUT (SHORT) — Contradicting Weekly Composite Guidance
Confidence: 60% (Moderate)
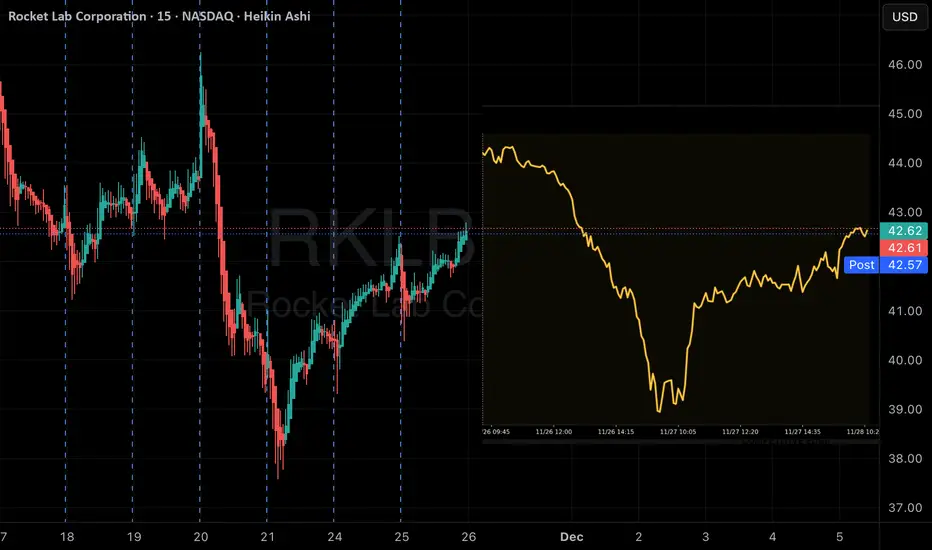
Current Price: $42.63
Entry: $0.29
Target 1: $0.58
Target 2: $0.87
Stop Loss: $0.15
Expiry: 2025-11-28 (3 days)
Weekly Momentum: BULLISH (+1.22%)
Options Flow: Neutral PCR 0.98, max OTM put volume indicates hedging
🧠 Key Technical & Chart Insights
Stock overextended at 87.3% of weekly range, RSI 90.3
Katy AI predicts sharp short-term decline (-14.73%) to $36.35 over 3 days
Support at $40.00, $39.00, $38.00; Resistance at $43.27
🎯 Trade Rationale
Katy AI’s high-precision 168-point prediction overrides bullish weekly composite score
Short-term reversal opportunity after +10.35% daily gain
Tight stop loss at $0.15 and conservative position size (2%) mitigate directional conflict
⚠️ Key Risks
Contradicts weekly composite bullish guidance (+2.0)
Moderate-high risk due to short 3-day horizon and potential news catalysts
Requires strict monitoring and potential scaling out at Target 1
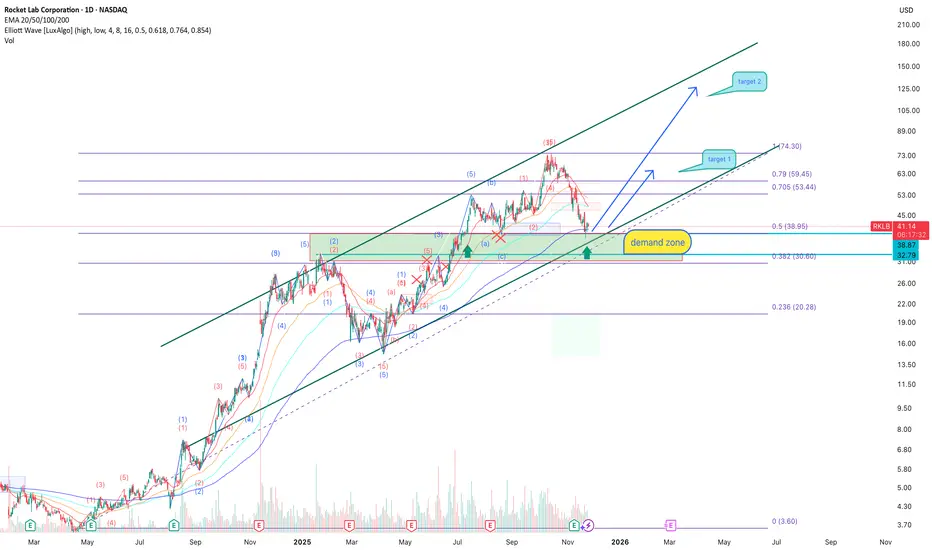
RKLB: demand zone may launch the next rallyRocket Lab remains one of the strongest long-term stories in the small-launch sector. The company continues expanding production capacity, scaling its launch cadence, securing new government contracts, and increasing recurring revenue from satellite services. The global demand for small-satellite deployment is growing faster than supply, and RKLB is steadily becoming the second major player after SpaceX in the commercial-launch and orbital-services niche. Additional growth in spacecraft manufacturing and analytics strengthens the company’s strategic positioning. From a long-term fundamental perspective, the recent price decline looks more like a technical correction inside a broader bullish cycle, rather than a structural reversal. For mid- and long-term investors, this area historically acts as a key accumulation zone -especially when fundamentals align with major technical supports.
Technically, price has held a major demand zone between 38–33 USD - the same zone that previously generated strong upward impulses. The correction stopped right at the 0.5 Fibonacci retracement (38.95), and buyers are showing absorption on lower timeframes. Price remains inside the broader ascending channel, while EMA 20/50 are stabilizing above the demand level, suggesting momentum may soon shift upward again. A clean entry setup forms once the market breaks and confirms the 0.705/0.79 Fibonacci cluster, opening the road toward the first target at 59.45 and then the extended target at 74.30. The bullish scenario remains valid as long as price stays within the demand zone and above the long-term trendline.
Fundamentally, the engine is already running -now all the chart needs is technical ignition to send RKLB back into the upper band of the long-term channel.
Last hope I seeA bit of divergence between price action and rsi. Couple weeks left for a turnaround but not looking good.

Rocket Lab Successfully Launches HASTE MissionRocket Lab continues to strengthen its position in the U.S. defense ecosystem with the successful launch of its HASTE suborbital mission. The mission, executed for the Defense Innovation Unit (DIU) and Missile Defense Agency (MDA), highlights Rocket Lab’s growing role in hypersonic technology testing—an area of strategic national importance.
The HASTE rocket, a suborbital variant of Rocket Lab’s Electron launcher, carried multiple government and industry payloads designed to test technologies relevant to missile-defense applications. This flight, conducted from Launch Complex 2 in Wallops Island, Virginia, marks the company’s sixth HASTE mission since 2023. The 14-month turnaround from contract signing to launch showcases Rocket Lab’s ability to deliver rapid, cost-efficient flight testing compared to traditional government programs—an advantage that has become increasingly valuable in the evolving defense landscape.
This mission also reinforces the HyCAT program’s goal of expanding low-cost, high-cadence hypersonic testing. As U.S. agencies push to accelerate development of hypersonic aircraft, re-entry vehicles, and counter-hypersonic systems, commercial partners like Rocket Lab are becoming essential contributors.
Technical Analysis:
RKLB shares have been bullish for most of the year and recently hit an all-time high near $74 before pulling back. The chart shows price tapping a key support zone around the $39 region. Bulls will want to see a clean bounce here, which could send price toward psychological levels at $72, $110, and $120. A failure to hold this zone, however, opens a potential drop toward the deeper support around $31 support area.
Overall, Rocket Lab’s strong fundamental momentum, increased government partnerships, and expanding launch cadence continue to provide long-term upside potential—while near-term volatility will depend on how price reacts to current support.

Looking rough for short term. Massive red candle.If we retest trend line we are looking around $30. If we can get a strong push from a possible year end rally maybe a retest of highs?
Rocketlab Bullish Flag DeviationI will try a long here. Risk 5% of Capital. Low leverage. Wide stop loss below latest low.
IMO: Be deviated just below support line in white and the bullflag. We are now testing the gap up. next days we can see higher price discovery fast. Gov. Shutdown is coming to an end.
Target as shwon in the chart. Aiming here for 120% gain on position size.

Flagging to more upside?Broke out of triangle after earnings push. Would love to see a retest of +/-$60 to close some calls that where bought on last week's dip.

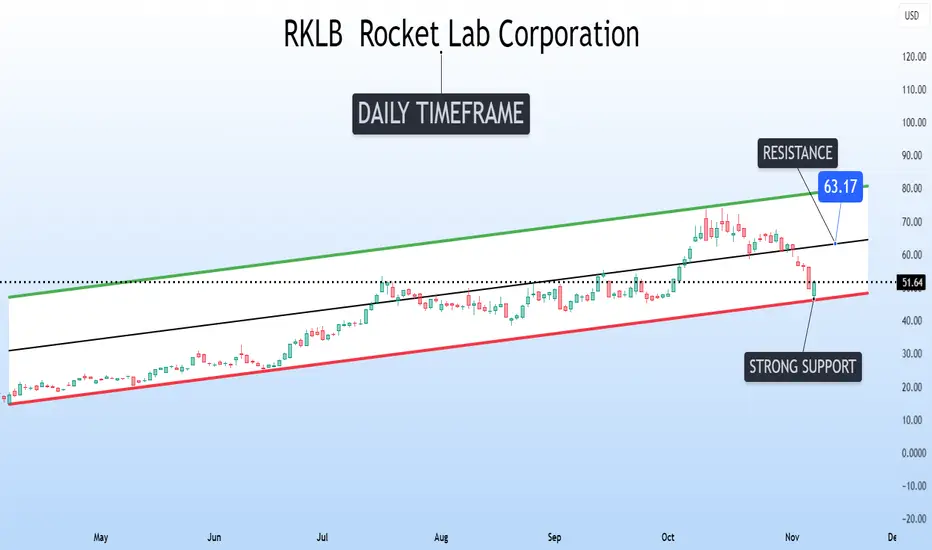
Rocket Lab is bouncing from the bottom of its ascending channelRocket Lab NASDAQ:RKLB is bouncing perfectly from the bottom of its ascending channel on the daily timeframe.
This level has acted as strong support multiple times before, and once again buyers stepped in right where they needed to.
If momentum continues, the next key area to watch is the mid-range resistance near $63.
A solid move toward that level could signal the start of another strong leg for the top of the channel around $80.
Trend reversalThe leading company in the space sector dropped 7% yesterday, but reversed at the lower edge of the indicated channel and closed with a nearly +5% gain.
This could be an interesting opportunity for entry or accumulation.
Always remember to set stop-loss levels due to the high volatility typical of these stocks.

KLOKThe content of today's is provided for educational purposes.
I , YES , I make NO promises or guarantees of earnings.
YO , YES , I'M NOT a broker/dealer, not a Certified Financial Planner
and not a Registered Investment Adviser. GRACIA$:{)
-RKLB-
Short Put
P-47
Exp.--11/14/25
S--44.21
IV4--11/07
OI--OK
Liq.--OK
EarningD.--11/10/26
W.atr--8.68
