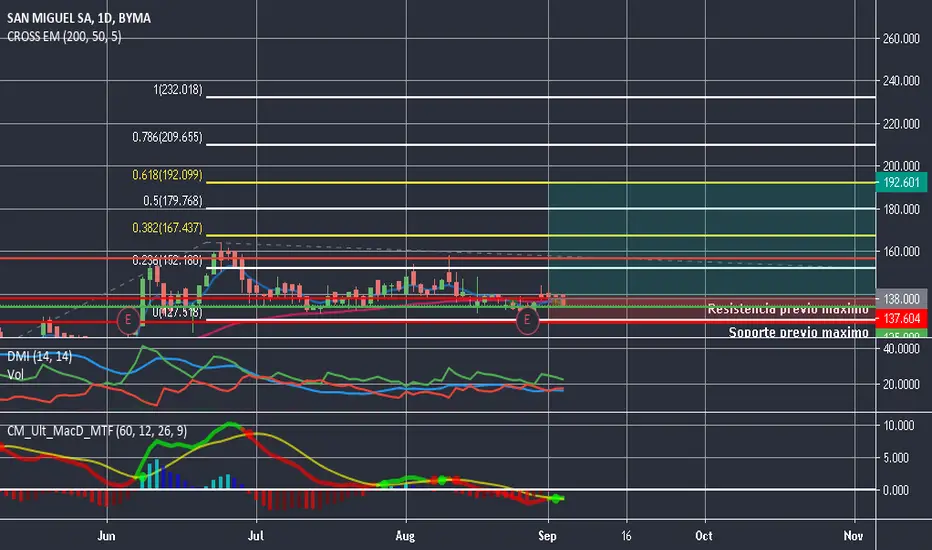
SAMI long Corto plazoMACD Y DMI diarios en compra
MACD semanal: Venta
DMI semanal: Tendencia alcista fuerte
Precio lateralizando entre su nuevo soporte (Previa resistencia de los maximos historicos) y 0.236 FIB
EMA 20 cruza EMA 50 al alza: Señal de compra.
MACD Mensual: Compora
DMI Mensual: Leve tendencia alcista
En
Next report date
—
Report period
—
EPS estimate
—
Revenue estimate
—
−0.119 USD
−17.53 M USD
100.51 M USD
896.95 M
About S.A. San Miguel A.G.I.C.I. y F. Class B
Sector
Industry
CEO
Pablo Plá
Website
Headquarters
Vicente Lopez
Founded
1954
ISIN
ARSMIG010018
SA San Miguel engages in the production and export of fruits, lemons and processed products. Its processed products include lemon oil, juice and dehydrated lemon peel. The company was founded on December 22, 1954 and is headquartered in Vicente Lopez, Argentina.
Related stocks
$samiGRAN reunion de traders gracias a todos fue excelente la participación ... analizamos mas de 20 activos $bma #gold $txar $come #ko $sami #nvda #ba #x #wti #hmi $mori $ypf $teco $ceco $trans $byma $dgcu $auy $ggal $merval $imv planeta trading by Versa

SAMI - Head and shoulders confirmationSan Miguel S.A (SAMI) Is about to confirm a head and shoulders formation. After a tremendous price sinking, the only way now is upwards, but not that up: With some luck prices will recover up to ARS 142 before decreasing up to who knows at which price.


sami en ccl sigue muy firmeSi logra superar los 1.57 usd debería ir a buscar los 2.20/2.25 usd por desdoble de canal

SAMI en CCLSi logra superar la resistencia de 1.57, deberíamos ir a buscar por desdoble de canal los 2.20/2.25 usd.
El papel tanto en usd como en pesos se ve muy solido


San Miguel (SAMI) - BCBA - MervalSan Miguel (SAMI) with high probability to stop bearish trend today and turn upward.
Sam Miguel (SAMI) con alta probabilidad de detener tendencia bajista el día de hoy y girar al alza.

See all ideas
Displays a symbol's price movements over previous years to identify recurring trends.
SNABD
S.A. San Miguel A.G.I.C.I. y F. 9.0% 29-JUL-2026Yield to maturity
67.91%
Maturity date
Jul 29, 2026
SNSBD
S.A. San Miguel A.G.I.C.I. y F. 9.5% 14-OCT-2026Yield to maturity
48.25%
Maturity date
Oct 14, 2026
SNSDD
S.A. San Miguel A.G.I.C.I. y F. 9.5% 06-FEB-2027Yield to maturity
31.80%
Maturity date
Feb 6, 2027
See all SAMIC bonds
Frequently Asked Questions
Depending on the exchange, the stock ticker may vary. For instance, on BCBA exchange S.A. San Miguel A.G.I.C.I. y F. Class B stocks are traded under the ticker SAMIC.
SAMIC reached its all-time high on Sep 30, 2019 with the price of 1.220 USD, and its all-time low was 1.220 USD and was reached on Sep 30, 2019. View more price dynamics on SAMIC chart.
See other stocks reaching their highest and lowest prices.
See other stocks reaching their highest and lowest prices.
SAMIC stock is 0.00% volatile and has beta coefficient of 1.29. Track S.A. San Miguel A.G.I.C.I. y F. Class B stock price on the chart and check out the list of the most volatile stocks — is S.A. San Miguel A.G.I.C.I. y F. Class B there?
Today S.A. San Miguel A.G.I.C.I. y F. Class B has the market capitalization of 80.55 M, it has decreased by −6.62% over the last week.
Yes, you can track S.A. San Miguel A.G.I.C.I. y F. Class B financials in yearly and quarterly reports right on TradingView.
S.A. San Miguel A.G.I.C.I. y F. Class B is going to release the next earnings report on Feb 25, 2026. Keep track of upcoming events with our Earnings Calendar.
SAMIC net income for the last quarter is −1.23 M USD, while the quarter before that showed −9.13 M USD of net income which accounts for 86.53% change. Track more S.A. San Miguel A.G.I.C.I. y F. Class B financial stats to get the full picture.
EBITDA measures a company's operating performance, its growth signifies an improvement in the efficiency of a company. S.A. San Miguel A.G.I.C.I. y F. Class B EBITDA is 9.68 M USD, and current EBITDA margin is 6.72%. See more stats in S.A. San Miguel A.G.I.C.I. y F. Class B financial statements.
Like other stocks, SAMIC shares are traded on stock exchanges, e.g. Nasdaq, Nyse, Euronext, and the easiest way to buy them is through an online stock broker. To do this, you need to open an account and follow a broker's procedures, then start trading. You can trade S.A. San Miguel A.G.I.C.I. y F. Class B stock right from TradingView charts — choose your broker and connect to your account.