SE (rejected breakout)Consolidation breakout rejected. Broke trendline support (greenline).
Fib levels shown.
a Drop below 248.20 is a double top
Trade ideas


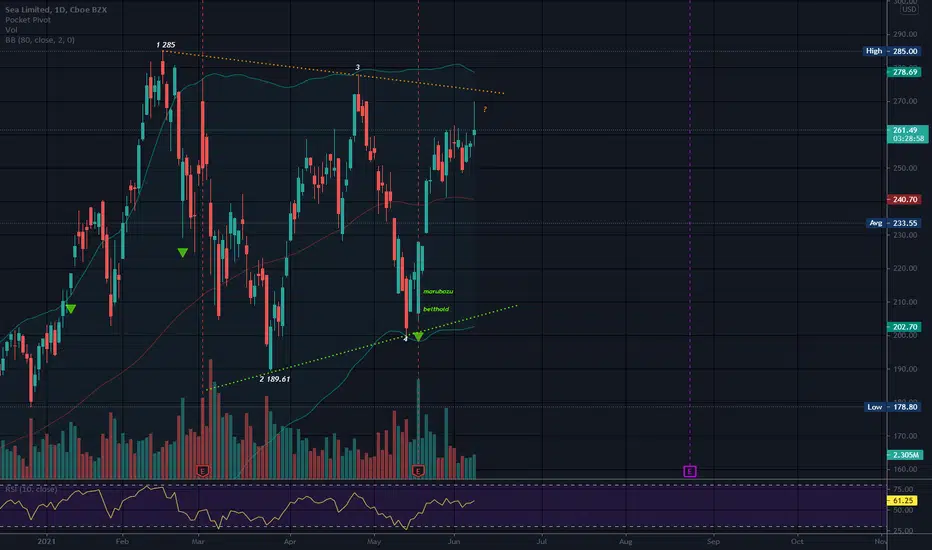
$SE Ready to Break Out of 4 Month Consolidation?$SE BofA upgrades to BUY with $340 price target! This looks actionable now however, I want to wait a bit until it moves up over the $278 area. I'm hopeful that once above that area it will become support vs resistance. All TBD. I have an alert set at $278.10. I have made a number of notations on the chart that are important to my "building a case" for going long. SE reported earnings on May 18 and had an earnings beat. Ideas, not investing / trading advice.
from earningswhispers.com
Sea Ltd ADR (SE) reported a 1st Quarter March 2021 loss of $0.82 per share on revenue of $1.8 billion. The consensus estimate was a loss of $0.56 per share on revenue of $1.8 billion. Revenue grew 146.7% on a year-over-year basis.
Sea Limited is a leading global consumer internet company founded in Singapore in 2009.

SE W pattern setting up for breakout.After testing the 200sma and finding support SE has formed a Bullish W pattern. Inside day at resistance today gives a tight Risk to reward entry here and makes me think this one is ready to go higher.

Symmetrical TriangleSE appears to be trading in a triangle. This is a neutral pattern until a trendline is broken with a trend in that direction.
It is not a tight triangle, as there is a lot of space that is not filled with price/candles. It has not reached the top trendline as of yet. The top is resistance until broken and the bottom is support unless broken.
No recommendation
SE STOCK - Take long position I am not an analyst, this is just a recommendation and should not be considered a professional recommendation that can be relied on


SE, short itThought this could breakout with the resurgence of covid in Malaysia but you can see 8ts already turning over in the RSI. Candle sticks are getting shorter also which let me know that bulls are losing strength. Money flow says overbought .Grabbing some June 25 222 puts

6/1 SEI like SE this company, but I would personally wait it to consolidate above 247 and break out the blue trend line above first
longterm bullish on SE

SE : POSITION TRADEFresh from consolidation. Tailwinds include exponential growth and adoption of e-commerce in South East Asia along with recently awarded digital bank license in Singapore.


SE trimming its losses
Sea Limited stock SE dipped after first quarter revenue topped estimates with 147% year-over-year growth to $1.8B but fell short on adjusted EBITDA.
The stock fell on the news to test the major support around $202.40.
SE showed a significant retreat from the mentioned support.
Prices could target $253 and $270 respectively within the sideways range.

Butterfly SEHi tarders
Possibale Butterfly Advanced formation here
this setup ment for short around D point
Drive safe

$SE with a Bullish outlook following its earnings #Stocks The PEAD projected a Bullish outlook for $SE after a Negative over reaction following its earnings release placing the stock in drift C
If you would like to see the Drift for another stock please message us. Also click on the Like Button if this was useful and follow us or join us.

This Is The Bottom On $SE
Spotted a hidden bullish divergence on SE, marked by the purple arrows and H Bull label. On the higher weekly timeframe, price is above the Ichimoku Cloud telling us that it is still on a long term uptrend. On the daily timeframe, price is currently below the cloud, showing temporary downtrend. Looking at the recent 3 Heikin Ashi candlesticks, we can see a reduction in bearish momentum, with looming indecision. In my opinion, this could be the pivot low and price would move higher in the next few days. I'd go long here.

$SE Trade Idea $SE Trade Idea
Entry: 230
Strike: 5/28 235c
Targets: 235, 240, 247
Support: 220, 214, 208

$SE Update on Cypher Lets see guys, we took most off here (green arrow) due to over head supply. Still a nice entry, stop even on balance. tp's listed aiming 1 and 2 only, 1 stop is break even , DO NOT BUY NOW PLEASE


SE: Incoming C WaveLooks like the bounce after the initial selloff has completed. Looking for a re-test of previous lows and perhaps even the creation of new lows. Hard to gauge how fast this will play out but holding 200P 6/18

Expectation Record SE for 03 May 2021 - 07 May 2021Resistance 1 : 285
Support 1 : 240
Support 2 : 226
Support 3 : 212
SE got a window around 240 - 252 and careful Support_1 : 240. If break, will forward to Support_2 : 226

Expectation Record SEA for 26 - 30 April 2021Resistance 1 : 285
Support 1 : 240
Support 2 : 232
Support 3 : 204


