SHOP in BUY ZONEMy trading plan is very simple.
I buy or sell when at either of these events happen:
* Price tags the top or bottom of parallel channel zones
* Money flow volume spikes beyond it's Bollinger Bands
So...
Here's why I'm picking this symbol to do the thing.
Price in buying zone at bottom of channels
Money flow momentum is spiked negative and under bottom of Bollinger Band
Entry at $143.85
Target is upper channel around $180 but may close at moving average at $156
Trade ideas

Shopify is holding its ground within a strong ascending channelShopify Inc. NASDAQ:SHOP is holding its ground within a strong ascending channel on the daily timeframe.
After facing resistance near $250, price pulled back to retest the lower boundary of the channel around $223, a level that could now act as key support.
As long as it stays above this trendline, the structure remains bullish with potential to retest $250 in the near term.
If momentum picks back up, Shopify could be gearing up for another powerful run toward the upper channel.

SHOP QuantSignals V3 Earnings 2025-11-03SHOP QuantSignals V3 Earnings 2025-11-03
SHOP Earnings Signal | 2025-11-03
• Direction: NEUTRAL | Confidence: 55%
• Entry Plan: Open | Expiry 2025-11-07
• Strike Focus: $167.50
• Entry Range: $7.55
• Target 1: $11.03
• Stop Loss: $5.15
• Implied Move: $20.75 (12.0%)
• 24h Move: -2.15%
• Flow Intel: Bearish (High P/C Ratio) | PCR 2.82
• 🔴 HIGH RISK WARNING: Use only small position size due to lower confidence and high uncertainty.
• Earnings Date: 2025-11-04 | Estimate: $0.34
⚖️ Compliance: Educational earnings analysis for QS Premium members only. Not financial advice.
🎯 TRADE RECOMMENDATION
Direction: BUY PUTS
Confidence: 55%
Conviction Level: SPECULATIVE
🧠 ANALYSIS SUMMARY
Katy AI Signal: Katy AI shows NEUTRAL bias with 50% confidence but indicates a bearish target of $171.63 (below current $173.19) with a stop loss at $175.79, suggesting slight downward pressure despite neutral overall rating.
Technical Analysis: RSI at 77.7 indicates overbought conditions with potential reversal risk. Price declined -2.15% in past 24h with above-average volume (1.5x), showing selling pressure. EMA alignment remains bullish but momentum shows signs of exhaustion.
News Sentiment: Mixed signals with analysts noting Shopify is "Priced for Perfection" setting high bar for earnings. Recent news highlights earnings focus but lacks clear bullish catalysts. Neutral-to-cautious pre-earnings sentiment.
Options Flow: Strong bearish signal with Put/Call Ratio of 2.82 (High P/C Ratio) indicating heavy put buying. Unusual activity at $100 put strike shows institutional hedging against downside. Implied move of 12.0% ($20.75) suggests significant volatility expected.
Risk Level: HIGH - Neutral AI signal with conflicting technicals and extreme volatility expected. Earnings beat rate only 50% adds uncertainty.
💰 TRADE SETUP
Expiry Date: 2025-11-07 (4 days)
Recommended Strike: $167.50
Entry Price: $7.35 - $7.75
**Ta
Image
QS Analyst
APP
— 10:49 AM
rget 1: $11.03 (50% gain from entry)
Target 2: $14.70 (100% gain from entry)
Stop Loss: $5.15 (30% loss from entry)
Position Size: 2% of portfolio
⚡ COMPETITIVE EDGE
Why This Trade: Combines overbought technicals with heavy put flow indicating institutional caution, despite neutral AI rating. High PCR of 2.82 suggests smarter money positioning for downside.
Timing Advantage: Earnings volatility capture with 4-day expiry maximizes theta decay while capturing post-earnings movement. Overbought RSI provides technical edge.
Risk Mitigation**: Conservative strike selection ($167.50 put has -0.382 delta) provides buffer against whipsaw. Tight stop loss limits losses if reversal doesn't materialize.
🚨 IMPORTANT NOTES
Katy AI shows NEUTRAL bias (50% confidence) - this is a speculative trade based on technical overbought conditions and options flow rather than strong AI conviction
High implied volatility (142-148%) means expensive options - rapid time decay risk
Earnings beat rate only 50% - high binary outcome risk
Consider smaller position size given speculative nature
Monitor pre-market movement closely for early exit signals
📊 TRADE DETAILS 📊
🎯 Instrument: SHOP
🔀 Direction: PUT (SHORT)
🎯 Strike: 167.50
💵 Entry Price: 7.55
🎯 Profit Target: 11.03
🛑 Stop Loss: 5.15
📅 Expiry: 2025-11-07
📏 Size: 2.0
📈 Confidence: 55%
⏰ Entry Timing: N/A
🕒 Signal Time: 2025-11-03 13:49:38 EST
🔴 HIGH RISK WARNING: Use only small position size due to lower confidence and high uncertainty.

$SHOP: A 4-Year Pattern Breakout Before EarningsWith the AI bubble looking frothy, investors are hunting for the next big rotation. The consumer holiday play looks like the perfect switch, and all eyes are on $SHOP.
This is looking like a clean breakout from a massive 4-year rounding bottom—a pattern this big is a major deal.
The setup couldn't be more critical:
• Catalyst: Earnings are tomorrow (Nov 4) pre-market.
• Sector: AMZN just hit a record high. The e-commerce holiday season is the clear narrative right now.
• History: SHOP has a strong track record of beating revenue estimates for the last two years.
• Momentum: The stock is already up over 60% YTD and the RSI is high, showing strong buying interest.
• High Beta: The stock's beta is over 3.5. This thing is built to move on a catalyst.
You have a long-term technical break, a major sector rotation, and a huge earnings catalyst all hitting at the same time. This is a powerful combination. Watching this one very, very closely today.

SHOP | Consensus Dealer Price Target $185Shopify ripped through its pivot on Friday, but dealers indicate that the run has further to go. Watch for continued strength.

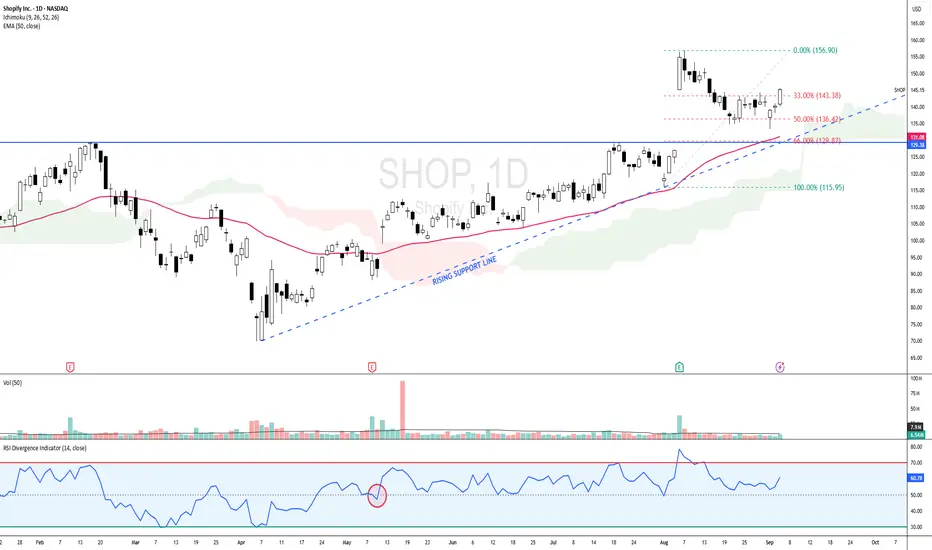
SHOP - BULLISH SCENARIO since 12 MAY 2025 SHOP - CURRENT PRICE : 145.15
SHOP is bullish as the share price is above 50-day EMA. Price action on 12 MAY 2025 is considered starting of bullish scenario because supported by several key indicators :
Share price gap up
Price broke out 50-day EMA
Price moving above ICHIMOKU CLOUD
RSI moving above 50
From 1 August (near 50-day EMA support) to 6 August, the stock recorded a strong upward rally. Following this advance, prices entered a corrective phase and retraced approximately 50% of the prior upswing. According to Dow Theory, such a retracement is considered a normal and healthy correction within an ongoing uptrend. Retracements in the range of one-third to two-thirds of the prior move are typical, with the 50% level often serving as a natural equilibrium point where buyers re-enter the market. Sustaining above the 50% retracement level would reinforce the bullish structure, while a recovery from this zone could pave the way for a retest of the recent highs. However, a decisive break below the 61.8% retracement may imply weakening momentum and a deeper corrective phase.
Take note that until now the share price is still above 50-day EMA and ICHIMOKU CLOUD while RSI also moving steadily above 50 level. There is also rising support line - strengthening bullish outlook.
ENTRY PRICE : 141.00 - 145.50
TARGET : 159.00 and 175.00
SUPPORT : 50-day EMA (CUTLOSS below 50-day EMA on closing basis)
SHOP - all time highs incomingSHOP - Stock is approaching recent highs at $167.69. looking strong for a possible breakout. Stock making a cup shaped reversal on the daily. Company to report earnings early next month. Looking for calls above $167.69 for a move towards $170 and $177(all time highs).

SHOP Breakout Watch – Bulls Eyeing $169 Zone!
Shopify (SHOP) is testing key resistance near $167, forming a bullish ascending structure.
A breakout above could trigger momentum toward $169–$170.
Holding above $164 keeps the short-term trend strong — below it, a retest of $160 is possible.
📊 Bias: Bullish above $164 – breakout confirmation awaited.
🎯 Targets: 167 / 169.5
🛑 Support: 164 / 160

SHOP BullishContinues to trade within this ascending wedge. Both times we saw an intraday wick trade below and then close within the channel, prices ripped higher. It looks like Shopify is finally ready to break all time highs with a daily close above this wedge, looking above 170+. Targeting $200+ into earnings

Keep your Eye on SHOPThere are so many Bullish patterns on this chart, I don't see how it will stay down. The weekly has an even Bigger pattern not included in this.

Shopify - Bears will get wrecked!☎️Shopify ( NASDAQ:SHOP ) will soon break out:
🔎Analysis summary:
In 2021, Shopify created the previous all time high which was followed by a drop of more than -80%. But over the course of the past couple of years, Shopify managed to regain most of its strength. Therefore an all time high breakout will happen after the bullish break and retest.
📝Levels to watch:
$150, $120
SwingTraderPhil
SwingTrading.Simplified. | Investing.Simplified. | #LONGTERMVISION

Buying ShopifyI'm looking to start building a position in Shopify again. Last chart i did on this played out very well. My two green horizontals are based off monthly support levels. Low 80s to mid 60s are great areas to add. I become very interested below $70, maybe earning provides the fuel to get there.

SHOP has one more seller to BuyHello I am the Cafe Trader.
Today we are going to be looking at Shopify, Thanks to a request from a follower.
Couple things to note here. This is a Massive range for a decent stock.
With a bottom of 23.61, and a high of 176.34 some may wonder if we might see some more downside before testing the highs (rightfully so).
Today we are going to look at some long term prices I think are suitable for your personal risk tolerance. as well as two possible short term scenarios and how you can navigate them.
Enough talking let's get into the charts.
Long Term
These prices are chosen from current market participants. I've measured them in order of your own conviction.
Aggressive = 122 (Top of Demand)
Fair Price = 99-102 (Concentrated demand)
Steal = 70-81 (Top of Strong Buyers)
Short Term
I'm going to be honest here, I don't particularly like the positioning of the range to go long here. That Strong Supply area is still very active, and we may have to hit that concentrated demand before having enough strength to get through that supply.
As this stands though, Bulls are in control. We have that trend break with real buyers, this is looking to hit top of supply in it's current context.
If at all we close above that strong supply (especially on friday) This is a great case to have a continuation.
If we cannot get above this strong supply after a test or two more, this is going to put pressure on the buyers.
Green Scenario
Entry 122
Stop 111.50
1st TP 141
Final TP 145.50
Red Scenario
If bulls make a big push and fail back below the strong supply, Bulls will be trapped, and This will put alot of pressure on the "Top of Demand".
Entry = close of the candle that is the false breakout.
Stop = Depends on how big the wick was on the false breakout. I'll assume about 131.50. but if its a huge wick, it will need to be higher. I'll update this depending.
1st TP = 106
Final = 102.5
That's all for SHOP Stay tuned for updates and more charts!
Happy Trading!
@thecafetrader
@livelclark

SHOP watch $126.79-127.28: Major Resistance may start a RetraceSHOP surged into a significant resistance at $126.79-127.28.
Zone of a Golden Genesis fib paired with a Covid Simulus fib.
Looking for a Break-n-Retest or Dip-to-Fib for long entries.
.

SHOPIFY ready to perform Price has break upwards and retest raising channel.
Strong signal for the further growth.
Target is on chart
DYOR
NFA

SHOP Bulls Are Back!
**SHOP Bulls Are Back! \$128 Calls Flash 80% Confidence Ahead of Earnings 🚀**
---
### 📋 **Post Body (TradingView Viral Format):**
**SHOP Weekly Options Alert — Aug 8 Expiry 💥**
📈 **Momentum Check:**
* RSI (Daily/Weekly): 🔼 Rising
* Call/Put Ratio: **1.35** (Bullish)
* Volume: Confirmed Institutional Support
* Confidence Level: **80%**
---
📊 **Recommended Trade:**
* **Type:** Buy Call
* **Strike:** \$128
* **Entry:** \$5.70
* **Stop Loss:** \$2.85
* **Targets:** 🎯 \$8.55 / 💰 \$11.40
* **Expiry:** Aug 8, 2025
* **Entry Timing:** Market Open
---
⚠️ **Key Risk:**
Major earnings event approaching — **exit before earnings** if holding through volatility isn’t part of your plan. Position sizing is **crucial**.
---
💡 **Strategy Insight:**
Strong consensus across models (Grok, Gemini, Claude, Llama, DeepSeek) aligns on bullish bias. This is a **premium setup** — watch for confirmation early in the week.
---
📦 **Trade JSON (for automation nerds):**
```json
{
"instrument": "SHOP",
"direction": "call",
"strike": 128.00,
"expiry": "2025-08-08",
"confidence": 0.80,
"profit_target": 8.55,
"stop_loss": 2.85,
"size": 1,
"entry_price": 5.70,
"entry_timing": "open",
"signal_publish_time": "2025-08-05 07:05:45 UTC-04:00"
}
```
---
### 🏷️ **Recommended Tags (TradingView Style):**
`#SHOP #OptionsTrading #WeeklyOptions #CallOptions #SHOPStock #BullishBreakout #TechnicalAnalysis #EarningsPlay #TradingStrategy #MomentumTrade #RSI #VolumeAnalysis #SmartMoney #TradingView`

Shopify (SHOP) – Powering the Next Wave of Global E-CommerceCompany Snapshot:
Shopify NASDAQ:SHOP continues to dominate as a leading commerce infrastructure provider, backed by record merchant adoption, a recurring revenue engine, and cutting-edge AI integration that enhances merchant capabilities.
Key Catalysts:
AI-Powered Ecosystem 🤖
From automated content creation to smart marketing tools, Shopify’s AI advancements are boosting merchant efficiency and making the platform indispensable for sellers.
Global Expansion 🌍
Shopify is scaling aggressively in Europe, Latin America, and Asia-Pacific, with localized services improving merchant onboarding and consumer reach.
Fulfillment Firepower via Deliverr 🚚
The Deliverr acquisition supercharges Shopify’s logistics network, enabling fast, reliable delivery that improves merchant retention and directly competes with Amazon.
Sticky, Scalable Revenue 💸
Its subscription-based model ensures high predictability, while growth in merchants and services lifts average revenue per user (ARPU).
Investment Outlook:
Bullish Entry Zone: Above $105.00–$107.00
Upside Target: $170.00–$175.00, powered by AI leverage, global scale, and logistics innovation.
🚀 Shopify is emerging not just as a storefront builder, but as a global commerce operating system.
#Shopify #Ecommerce #AI #DigitalRetail #GlobalExpansion #Deliverr #Fulfillment #TechStocks #SHOP #AmazonRival #ARPU #SaaS #GrowthStock #MerchantEconomy

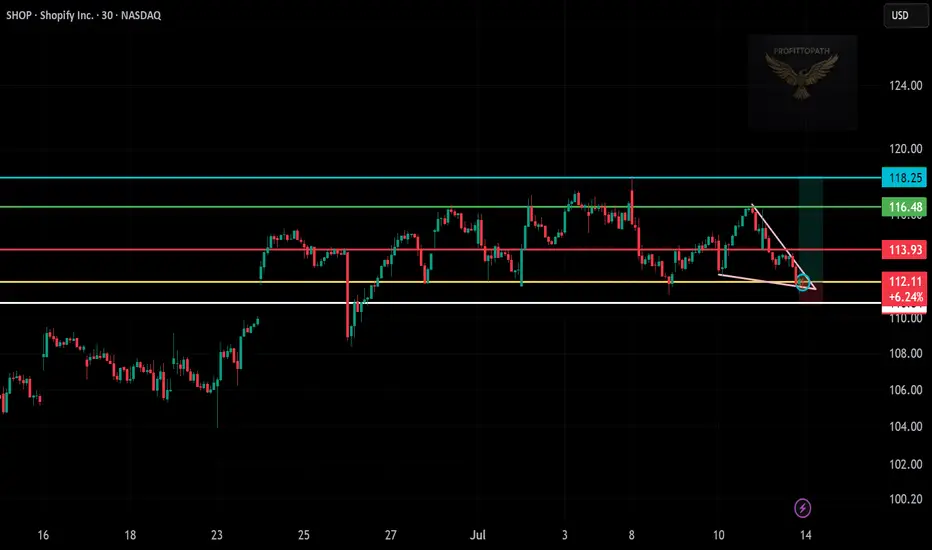
Trade Setup: Long on SHOP!📊
🕒 Timeframe:
30-minute chart
📍 Technical Overview:
Falling wedge breakout detected ✅
Support zone: $111.50–$112 (held well)
Breakout confirmation near $113
Target zones:
TP1 🎯: $116.48 (green resistance)
TP2 🎯: $118.25 (major resistance)
🔐 Risk Management:
Stop loss: Below $111.50 (white support)
Risk–Reward Ratio: Over 2:1 ✅
📈 Trade Plan Summary:
Entry: $113.00–$113.50 (breakout zone)
Target: $116.48 → $118.25
Stop loss: Below $111.50
Ascending Triangle With Breakout Incoming?📈 Ascending Triangle formation (bullish)
🔥 MACD crossover above signal line, bullish momentum gaining
✅ RSI at 61, showing strength but not overbought
📊 Watching for volume confirmation on breakout
Plan: Wait for daily close or strong intraday breakout above 160. If it confirms, this could be a strong swing setup. Watching closely!

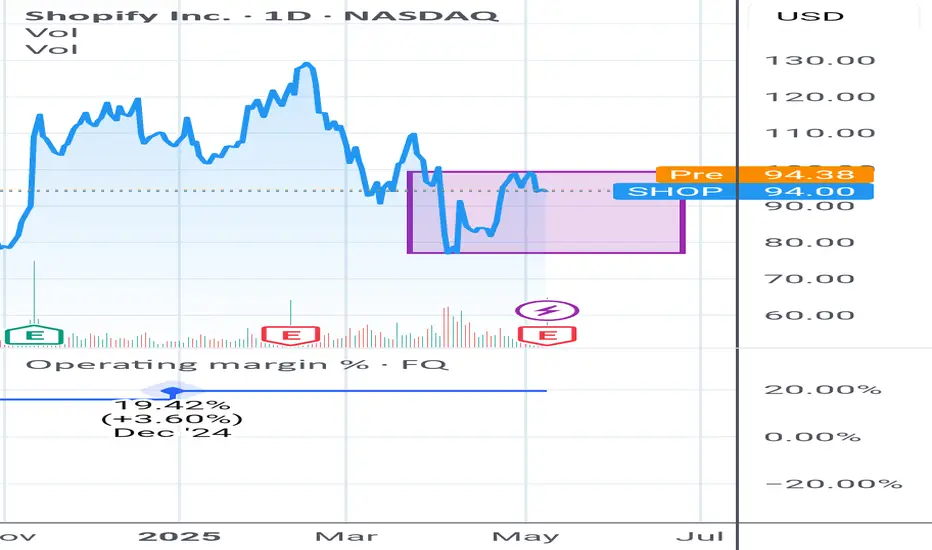
Trading box for SHOPThesis : the operating performance of SHOP's business is positive and it provides an optimistic outlook.
How to trade it: at this juncture the stock seems poised to go higher, therefore I will setup a trading box to confirm or deny the thesis.
Sell if it drops below 77
Buy if it breaks the 94/95 level.
$SHOP will break out shortly! Shopify is dtuck under it's arc for a while now, Ones it breaks it will gravitade to the next one. Good Symmetry.
Shopify Escapes Tight ConsolidationShopify has been trapped in a tight range, but now the e-commerce stock may be breaking out.
The first pattern on today’s chart is the falling trendline since May 14 (based on closing prices). SHOP ended Friday above it, which may draw fence-sitters from the sidelines.
Second is the April high of $101.45. Prices tested below that level on May 23 but held. Has old resistance become new support?
Third is the narrowing Bollinger Band Width. Such a volatility squeeze may create potential for prices to expand following a period of compression.
Next, the 8-day exponential moving average (EMA) has stayed above the 21-day EMA. That may reflect short-term bullishness.
Finally, prices are near the rising 200-day simple moving average. That may suggest a longer-term uptrend is still in effect.
Check out TradingView's The Leap competition sponsored by TradeStation.
TradeStation has, for decades, advanced the trading industry, providing access to stocks, options and futures. If you're born to trade, we could be for you. See our Overview for more.
Past performance, whether actual or indicated by historical tests of strategies, is no guarantee of future performance or success. There is a possibility that you may sustain a loss equal to or greater than your entire investment regardless of which asset class you trade (equities, options or futures); therefore, you should not invest or risk money that you cannot afford to lose. Online trading is not suitable for all investors. View the document titled Characteristics and Risks of Standardized Options at www.TradeStation.com . Before trading any asset class, customers must read the relevant risk disclosure statements on www.TradeStation.com . System access and trade placement and execution may be delayed or fail due to market volatility and volume, quote delays, system and software errors, Internet traffic, outages and other factors.
Securities and futures trading is offered to self-directed customers by TradeStation Securities, Inc., a broker-dealer registered with the Securities and Exchange Commission and a futures commission merchant licensed with the Commodity Futures Trading Commission). TradeStation Securities is a member of the Financial Industry Regulatory Authority, the National Futures Association, and a number of exchanges.
TradeStation Securities, Inc. and TradeStation Technologies, Inc. are each wholly owned subsidiaries of TradeStation Group, Inc., both operating, and providing products and services, under the TradeStation brand and trademark. When applying for, or purchasing, accounts, subscriptions, products and services, it is important that you know which company you will be dealing with. Visit www.TradeStation.com for further important information explaining what this means.

Shopify has been trending steadily since 2022 Q4NASDAQ:SHOP is strongly in a steady uptrend since Oct 2022. Despite some strong correction in Feb 2025, the correction ended in a 3-wave manner before resuming its upside. We believe that the upside is likley to continue as the ascending triangle is strong.
Furthermore, the long and short-term momentum are in unsion, pointing towards a strong bullish momentum. Volume remain healthy.
