T-Mobile US, Inc. (TMUS) – Long Setup Technical AnalysisT-Mobile US, Inc. (TMUS) – Long Setup Technical Analysis
TMUS is currently trading above the Anchored VWAP, where price has formed a bullish harmonic pattern directly at the main VWAP level. This behavior indicates strong acceptance above fair value, with buyers successfully defending the volume-we
T-Mobile US, Inc. Shs Cert Deposito Arg Repr 0.0303030303 Shs
No trades
360 ARS
10.38 T ARS
74.54 T ARS
About T-Mobile US, Inc.
Sector
Industry
CEO
Srinivasan Gopalan
Website
Headquarters
Bellevue
Founded
1994
Identifiers
2
ISINAR0964115726
T-Mobile US, Inc. engages in the provision of wireless communications services under the T-Mobile and MetroPCS brands. It offers postpaid and prepaid wireless voice, messaging and data services, and wholesale wireless services. The company was founded in 1994 and is headquartered in Bellevue, WA.
Related stocks

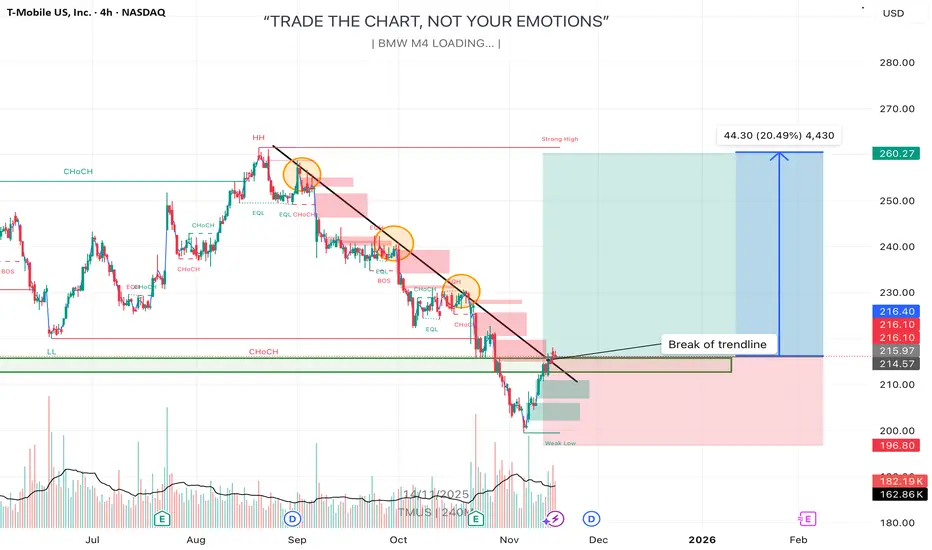
TMUS – Trendline Break & Bounce From Support Zone🔍 Quick Summary
I’m seeing T‑Mobile US, Inc. (TMUS) break a long-term descending trendline and bounce off a key support region. The chart suggests a breakout scenario where I expect price to push toward the strong high near $260 (≈ +20% upside).
⸻
📊 Deep Analysis
• On the 4-hour timeframe, TMUS
$TMUS Earnings and Technical AnalysisUndercut and Reverse Pattern Observed in TMUS
On October 23rd, T-Mobile US (TMUS) released its earnings report, surpassing analyst expectations. Despite the positive results, the stock initially experienced a sell-off and closed down approximately 3.3%. The overall downward movement exceeded 5%, wi

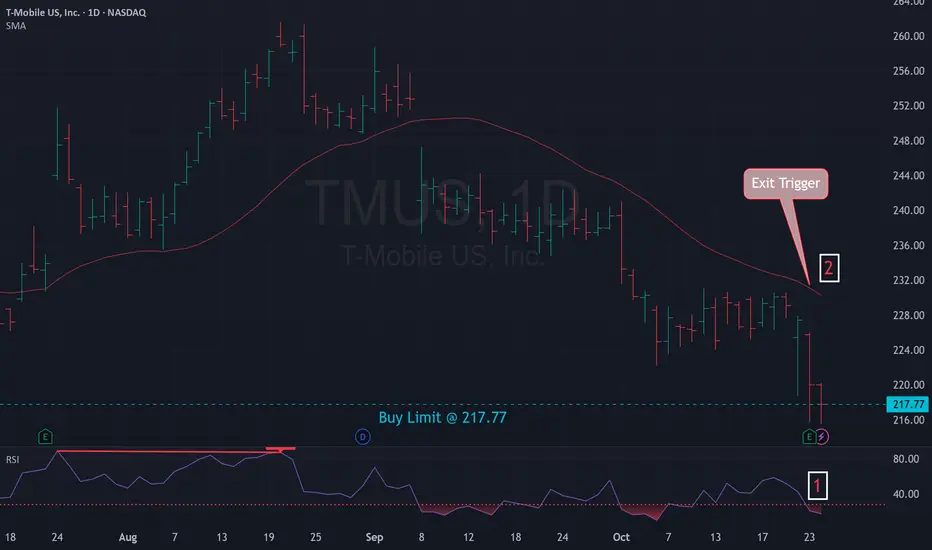
Mean Reversion Setup: TMUS1. RSI in oversold region
2. Price likely to rebound back the the mean
Trade Rules:
Entry Trigger - RSI has cross below oversold region, enter limit buy at close price
Exit Trigger - Close at market when close price cross above exit trigger (Red Line)
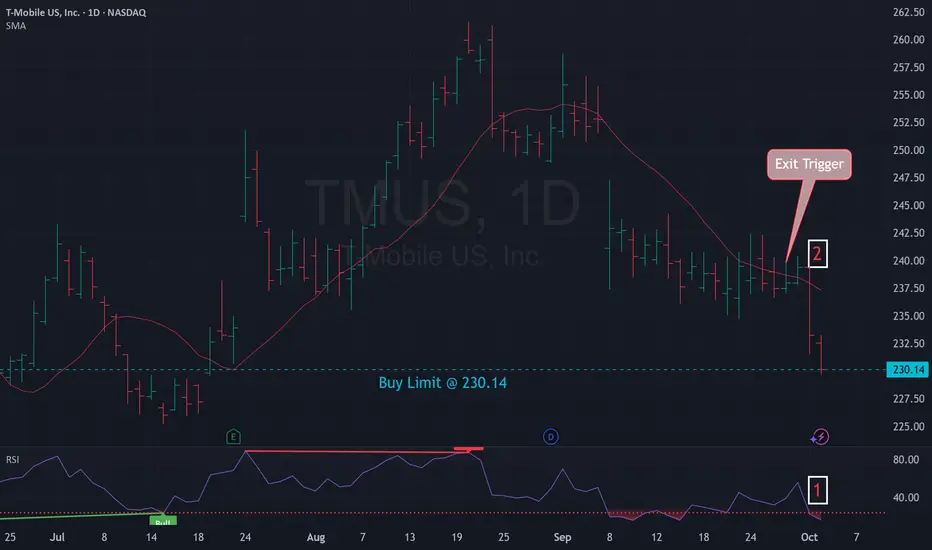
Mean Reversion Setup: TMUS1. RSI in oversold region
2. Price likely to rebound back the the mean
Trade Rules:
Entry Trigger - RSI has cross below oversold region, enter limit buy at close price
Exit Trigger - Close at market when close price cross above exit trigger (Red Line)
T-Mobile: Weak in a Strong Market?T-Mobile USA has limped as the broader market hits new highs, and now some traders may see downside signals emerging.
The first pattern on today’s chart is the gap lower on September 8. (The drop came after SpaceX’s Starlink purchased wireless spectrum licenses with plans to compete against carrier

Mean Reversion Setup: TMUS1. RSI in oversold region
2. Price likely to rebound back the the mean
Trade Rules:
Entry Trigger - RSI has cross below oversold region, enter limit buy at close price
Exit Trigger - Close at market when close price cross above exit trigger (Red Line)

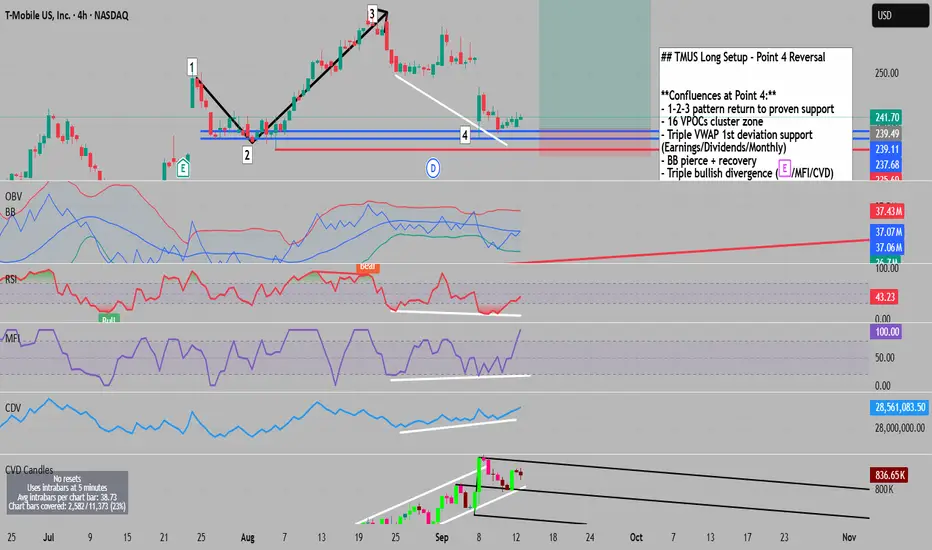
A+ Setup with 5:1 at Key Support```markdown
# 🎯 TMUS: The Perfect Storm - 8 Signals Screaming "BUY" at Critical Support
## **The Setup That Has It All**
When the stars align in trading, you take notice. When EIGHT technical indicators converge at the same price point? You take action.
TMUS just delivered what might be the trade
TMUS watch $227.03-227.69: Key support zone to end downtrend? TMUS has dropped a lot from its ATH a few months ago.
Currently testing a key support zone at $227.03-227.69
Look for a clean bounce to signal end of the downtrend.

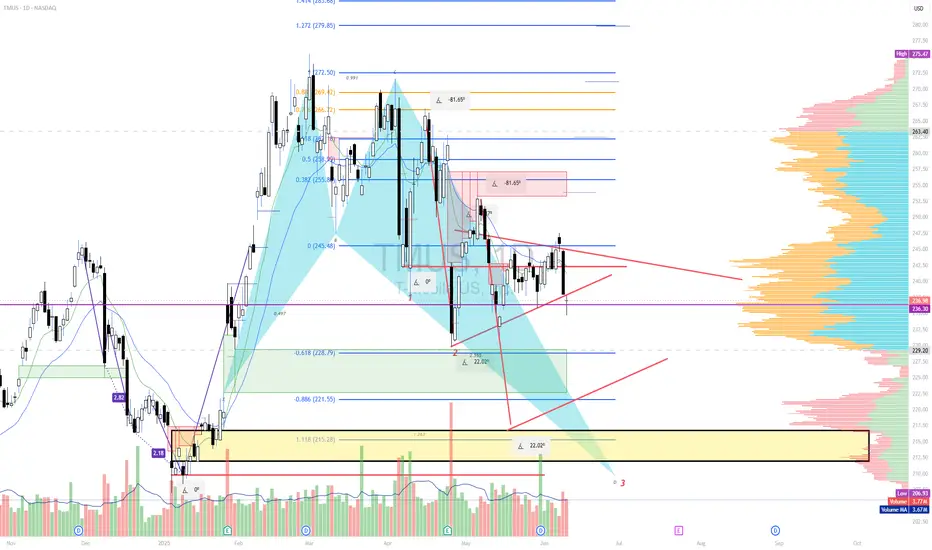
TMUS shortT mobile run seems to been exhausted and setting up. Weekly and Daily setup so anticipate a lot of head spin but on my radar. For now short seems to be my bias. 242.25 shows to be POC before 220 target of max pain. 218-209 is the area of interest for base bullish harmonic.
See all ideas
Summarizing what the indicators are suggesting.
Oscillators
Neutral
SellBuy
Strong sellStrong buy
Strong sellSellNeutralBuyStrong buy
Oscillators
Neutral
SellBuy
Strong sellStrong buy
Strong sellSellNeutralBuyStrong buy
Summary
Neutral
SellBuy
Strong sellStrong buy
Strong sellSellNeutralBuyStrong buy
Summary
Neutral
SellBuy
Strong sellStrong buy
Strong sellSellNeutralBuyStrong buy
Summary
Neutral
SellBuy
Strong sellStrong buy
Strong sellSellNeutralBuyStrong buy
Moving Averages
Neutral
SellBuy
Strong sellStrong buy
Strong sellSellNeutralBuyStrong buy
Moving Averages
Neutral
SellBuy
Strong sellStrong buy
Strong sellSellNeutralBuyStrong buy
Displays a symbol's price movements over previous years to identify recurring trends.
TMUS5475071
T-Mobile USA, Inc. 5.8% 15-SEP-2062Yield to maturity
5.88%
Maturity date
Sep 15, 2062
TMUS5584909
T-Mobile USA, Inc. 5.75% 15-JAN-2054Yield to maturity
5.87%
Maturity date
Jan 15, 2054
TMUS5731959
T-Mobile USA, Inc. 5.5% 15-JAN-2055Yield to maturity
5.87%
Maturity date
Jan 15, 2055
TMUS5900487
T-Mobile USA, Inc. 5.25% 15-JUN-2055Yield to maturity
5.87%
Maturity date
Jun 15, 2055
TMUS6037451
T-Mobile USA, Inc. 5.875% 15-NOV-2055Yield to maturity
5.87%
Maturity date
Nov 15, 2055
TMUS5475070
T-Mobile USA, Inc. 5.65% 15-JAN-2053Yield to maturity
5.86%
Maturity date
Jan 15, 2053
TMUS4973557
T-Mobile USA, Inc. 4.5% 15-APR-2050Yield to maturity
5.86%
Maturity date
Apr 15, 2050
TMUS6197961
T-Mobile USA, Inc. 5.7% 15-JAN-2056Yield to maturity
5.86%
Maturity date
Jan 15, 2056
TMUS5650474
T-Mobile USA, Inc. 6.0% 15-JUN-2054Yield to maturity
5.86%
Maturity date
Jun 15, 2054
TMUS5194656
T-Mobile USA, Inc. 3.6% 15-NOV-2060Yield to maturity
5.83%
Maturity date
Nov 15, 2060
TMUS5049937
T-Mobile USA, Inc. 3.3% 15-FEB-2051Yield to maturity
5.81%
Maturity date
Feb 15, 2051
See all TMUS bonds
Curated watchlists where TMUS is featured.

